• Cat-intel
  • MedIntelliX
  • Resources
  • About Us
  • Hero Background
    English
    Chinese
    French
    Japanese
    Korean
    German
    Spanish

    Molecular Sieves Market Share

    ID: MRFR/CnM/6965-CR
    215 Pages
    Chitranshi Jaiswal
    August 2021

    Molecular Sieves Market Research Report Information by Type (4A, 3A, 5A, 13X, Zeolite Y, and Others), by Shape (Beads, Pellets, and Powder), by Product (Zeolites, Activated Carbon, Clay, and Others), by End-use (Oil & Gas, Automotive, Packaging, Coatings, Wastewater Treatment, Detergents, and Others), And By Region (North America, Europe, Asia-Pacific, And Rest Of The World) –Market Forecas...

    Share:
    Download PDF ×

    We do not share your information with anyone. However, we may send you emails based on your report interest from time to time. You may contact us at any time to opt-out.

    Molecular Sieves Market Infographic
    $ 4,950.0
    $ 5,950.0
    $ 7,250.0

    Market Share

    Molecular Sieves Market Share Analysis

    Market share positioning strategies in the Molecular Sieves Market play a crucial role in helping companies establish a competitive edge and expand their presence in this dynamic sector. Molecular sieves, versatile materials known for their ability to selectively adsorb molecules based on size and shape, offer a wide range of applications across industries such as petrochemicals, healthcare, and automotive. To effectively position themselves in this market, companies employ various strategies: Product Differentiation: Companies focus on developing molecular sieve products with unique properties and functionalities tailored to specific applications and customer requirements. Differentiation may include variations in pore size, surface area, thermal stability, or selectivity, allowing companies to target diverse industries and niche segments within the Molecular Sieves Market effectively. Targeted Market Segmentation: Identifying and prioritizing key market segments based on industry verticals, applications, and geographical regions allows companies to allocate resources strategically and tailor their marketing efforts. Segmentation facilitates the customization of product offerings and messaging to address the specific needs, preferences, and challenges of each target segment, maximizing market penetration and customer satisfaction. Strategic Partnerships and Alliances: Collaborating with key stakeholders such as petrochemical companies, catalyst manufacturers, or research institutions enables companies to leverage complementary strengths and resources. Partnerships can facilitate access to new technologies, distribution channels, and market insights, enhancing companies' competitiveness and market reach in the Molecular Sieves Market. Geographic Expansion: Expanding into emerging markets and regions with growing industrial sectors presents opportunities for companies to diversify their customer base and revenue streams. Companies adapt their market positioning strategies to address regional preferences, regulatory frameworks, and market dynamics, enabling effective penetration and establishment in new geographic markets. Brand Positioning: Establishing a strong brand identity centered around reliability, quality, and innovation helps companies differentiate their molecular sieve products in a competitive market landscape. Investing in brand-building activities such as advertising, sponsorships, and participation in industry events enhances visibility and credibility, driving customer preference and loyalty. Technical Expertise and Customer Support: Demonstrating technical expertise and providing comprehensive customer support services, including technical documentation, training programs, and troubleshooting assistance, helps build trust and confidence among customers. Companies focus on understanding customer requirements and offering tailored solutions, thereby enhancing customer satisfaction and loyalty in the Molecular Sieves Market. Continuous Innovation and R&D Investments: Continued investment in research and development (R&D) is essential for driving innovation, product improvement, and differentiation in the Molecular Sieves Market. Companies focus on developing advanced materials, optimizing manufacturing processes, and exploring new applications to meet evolving customer needs, stay ahead of competitors, and capitalize on emerging trends. Sustainability Initiatives: Incorporating sustainable practices such as eco-friendly manufacturing processes, recycling programs, and environmentally friendly product offerings resonates with environmentally conscious customers and regulatory requirements. Companies communicate their commitment to sustainability through marketing campaigns and product labeling, enhancing brand reputation and attracting environmentally conscious customers in the Molecular Sieves Market. Market Monitoring and Adaptation: Regularly monitoring market trends, competitor activities, and customer feedback enables companies to adapt their market positioning strategies in response to changing market dynamics. Being agile and responsive to market developments allows companies to seize opportunities, mitigate risks, and maintain a competitive edge in the Molecular Sieves Market.

    Market Summary

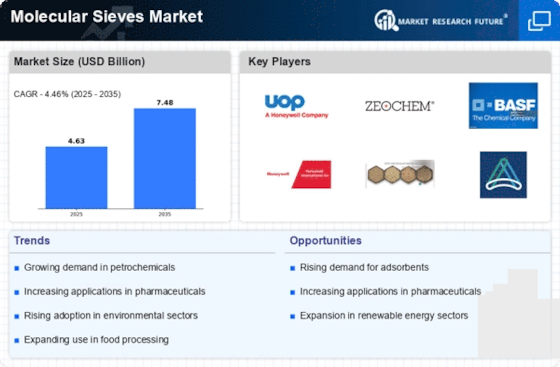
    As per Market Research Future Analysis, the Global Molecular Sieves Market was valued at USD 4.63 Billion in 2024 and is projected to grow to USD 7.48 Billion by 2035, with a CAGR of 4.46% from 2025 to 2035. Key drivers include increasing demand from the automotive and transport sectors, as well as the oil and gas industries. The market is also influenced by environmental regulations favoring eco-friendly molecular sieves and their anticipated applications in medical fields. The COVID-19 pandemic has impacted distribution and manufacturing, but government regulations have eased, promoting the use of molecular sieves. The 4A type dominated the market in 2022, accounting for 345% of market revenue, while the oil and gas sector led end-user applications with 345% market share.

    Key Market Trends & Highlights

    The molecular sieves market is experiencing significant growth driven by various sectors.

    • Market Size in 2024: USD 4.63 Billion Projected Market Size by 2035: USD 7.48 Billion CAGR from 2025 to 2035: 4.46% 4A type accounted for 345% of market revenue in 2022

    Market Size & Forecast

    2024 Market Size USD 4.63 Billion
    2035 Market Size USD 7.48 Billion
    CAGR (2024-2035) 4.46%
    Largest End-user Segment Oil & Gas

    Major Players

    <p>Key players include Sorbead India, Tosoh Corporation, BASF SE, Honeywell International Inc, Grace &amp; Co, Zeochem AG, Merck KGaA, MolsivCN, and Union Showa KK.</p>

    Market Trends

    Growing automotive & transport sectors are driving the market growth

    The market CAGR for molecular sieves is driven by the rising automotive & transport sectors. Transportation and automotive sectors depend on molecular sieves to handle different water concerns. Moisture can shorten the life of automobile parts by causing short corrosion. Desiccants are incorporated into automotive systems in the Shape of bags or cartridges to safeguard them against moisture impacts. Furthermore, by maintaining the air as dehydrated as possible, molecular sieves avoid the rusting of metal components in the air braking systems of buses, trains, and intermediate and heavy-duty vehicles.

    As an outcome, increased demand from the transportation and automotive sectors is driving the growth of this market. According to the OICA, the automobile industry generated 424.1 million vehicles in 2016 and is predicted to produce 460.1 million in 2021.

    These sieves are also widely used as a type of catalyst in the oil and petrochemical sectors. Aside from that, raising awareness of the environment, along with the adoption of stringent regulatory rules favoring the usage of environmentally friendly molecular sieves, is fueling market expansion. Furthermore, the anticipated uses for biodegradable molecular sieves in the medical field, such as the regulated release of drugs in the human body, are predicted to be a key growth driver.

    Aside from that, growing water treatment operations for the purifying of gas and water streams, as well as the elimination of nuclear waste using molecular sieves, are expected to drive up demand for goods ly.

    The COVID-19 epidemic has impacted chemical and materials distribution systems, manufacturing activities, and international trade worldwide. Industrial has been hampered owing to worldwide security tightening and industrial problems. Furthermore, oxygen is produced by passing aluminum, silicon, and additional molecules via high-speed molecular sieves. As a result, government regulations have been relaxed, enabling more people to utilize molecular sieves. Aside from molecular sieves, a handful of organizations in major impacted nations have received oxygen generators, which transform nitrogen into oxygen.

    For instance, molecular sieves have a microporous outer layer of 200-1200m2/g. They are typically used to separate inorganic gases, C1-C3 hydrocarbons, and tiny molecules that are polar such as fluid, formaldehyde, and hydrogen sulfide. As a result, increasing requirements for CMS across different industries will drive market expansion throughout the forecast period. Thus, it is anticipated that demand for Molecular Sieves will increase throughout the projected timeframe due to the rising automotive & transport sectors. Thus, driving the Molecular Sieves market revenue.

    October 2023

    SiPore21® is a cutting-edge medical device that was created to enable long-term control of diabetes and weight. Sigrid Therapeutics has begun the SHINE clinical trial for SiPore21®. Through the use of Mesoporous Silica particles (MSPs), SiPore21® is a unique technology that utilizes MSPs to solve significant health concerns. Orally given MSPs, when taken in the form of a gel, perform the role of "molecular sieves," successfully preventing the interaction between digestive enzymes and the food that is being consumed. This activity results in a reduction in the amount of carbohydrates and lipids that are broken down.

    In order to determine whether or not SiPore21® is effective, the SHINE trial, which is currently the largest commercial research on prediabetes, is now being conducted. The primary purpose of this study is to determine whether or not the medicine SiPore21® results in significantly lower HbA1c levels as compared to placebo during the treatment of individuals who are obese or overweight and have elevated blood glucose levels.

    <p>The increasing demand for efficient separation processes across various industries is driving innovation and expansion within the molecular sieves market, reflecting a broader trend towards sustainable and optimized resource utilization.</p>

    U.S. Department of Energy

    Molecular Sieves Market Market Drivers

    Rising Demand in Adsorption Applications

    The Global Global Molecular Sieves Market Industry experiences heightened demand driven by the increasing utilization of molecular sieves in adsorption applications across various sectors. Industries such as petrochemicals, pharmaceuticals, and environmental protection rely on molecular sieves for efficient separation and purification processes. For instance, in the petrochemical sector, molecular sieves are essential for removing impurities from hydrocarbon streams, enhancing product quality. This trend is expected to contribute significantly to the market's growth, with projections indicating a market value of 4.63 USD Billion in 2024, reflecting the industry's pivotal role in optimizing production processes.

    Market Segment Insights

    Molecular Sieves Type Insights

    <p>The Molecular Sieves market segmentation, based on type, includes 4A, 3A, 5A, 13X, zeolite Y, and Others. 4A category dominated the market, accounting for 345% of market revenue (USD 1.9 Billion) in 2022. It enjoyed a cost advantage as a pristine state. H2O, ethanol, and CO2 are all absorbed. It is a 2-angstrom efficient hole-opening alkali metal aluminosilicate. Moisture may be removed from gases and liquids using the 4A coating.</p>

    Molecular Sieves Shape Insights

    <p>The Molecular Sieves market segmentation, based on Shapes, includes Beads, Pellets, and Powder. The beads category generated the highest market revenue of about 53% (USD 2.2 billion) in 2022 due to their extensive use in many industrial uses.</p>

    <p>Figure 1: &nbsp;Molecular Sieves Market, by Shape, 2022 &amp; 2032 (USD Billion)</p>

    <p>Source: Secondary Research, Primary Research, Market Research Future Database, and Analyst Review</p>

    Molecular Sieves Product Insights

    <p>The Molecular Sieves market segmentation, based on Product, includes Zeolites, Activated Carbon, Clay, and Others. The zeolites segment dominated the market, accounting for 37% of market revenue (USD 1.6 Billion) in 2022.</p>

    Molecular Sieves End-user Insights

    <p>The Molecular Sieves market segmentation, based on End-user, includes <a href="https://www.marketresearchfuture.com/reports/offshore-oil-gas-paints-coating-market-29665">Oil &amp; Gas</a>, Automotive, Packaging, Coatings, Wastewater Treatment, Detergents, and Others. The oil &amp; gas segment dominated the market, accounting for 345% of market revenue (USD 2.5 Billion) in 2022. The applicability for the purification and dehydration of aromatic and aliphatic hydrocarbons, synthetic gas,&nbsp;and other contaminants is a major reason for its expansion.</p>

    Get more detailed insights about Molecular Sieves Market Research Report—Global Forecast till 2035

    Regional Insights

    By region, the research provides market insights into North America, Europe, Asia-Pacific, and the Rest of the World. The North American Molecular Sieves market area will dominate this market during the projected timeframe, owing to an increase in Urbanization and fast industrialization is driving the market expansion, which will boost the market growth in the North American region.

    Further, the major countries studied in the market report are the US, Canada, German, France, the U.K., Italy, Spain, China, Japan, India, Australia, South Korea, and Brazil.

    Figure 2:  Molecular Sieves Market Share by Region 2022 (USD Billion)

    Molecular Sieves Market Share by Region

    Source: Secondary Research, Primary Research, Market Research Future Database, and Analyst Review

    Europe region’s Molecular Sieves market accounts for the second-highest market share owing to the expansion of end-use sectors such as packaging, natural gas & oil, automobiles, and coatings. Further, the German Molecular Sieves market holds the largest market share, and the U.K. Molecular Sieves market is expected to grow and expand significantly in the European region during the projected timeframe.

    The Asia-Pacific Molecular Sieves Market is expected to grow quickly during the projected timeframe. This is because of the region's substantial manufacturing operations in sectors such as oil refining and petroleum products, automobiles, medicine, industrial gas generation, treatment of water, and numerous others. Moreover, China’s Molecular Sieves market dominates the market share, and the Indian Molecular Sieves market is expected to expand and grow steadily in the Asia-Pacific region during the projected timeframe.

    Key Players and Competitive Insights

    Leading market players invested heavily in research and Development (R&D) to scale up their manufacturing units and develop technologically advanced solutions, which will help the Molecular Sieves market grow worldwide. Market participants are also undertaking various organic or inorganic strategic approaches to strengthen and expand their footprint, with significant market developments including new product portfolios, contractual deals, mergers and acquisitions, capital expenditure, higher investments, and strategic alliances with other organizations. Businesses are also coming up with marketing strategies such as digital marketing, social media influencing, and content marketing to increase their scope of profit earnings.

    The Molecular Sieves industry must offer cost-effective and sustainable options to survive in a highly fragmented and dynamic market climate.

    Manufacturing locally to minimize operational expenses and offer aftermarket services to customers is one of the critical business strategies organizations use in the Molecular Sieves industry to benefit customers and capture untapped market share and revenue. The Molecular Sieves industry has recently offered significant advantages to the Chemicals industry. Moreover, more industry participants are utilizing and adopting cutting-edge Technology has grown substantially.

    Major players in the Molecular Sieves market, including Sorbead India, Tosoh Corporation, BASF SE, Honeywell International Inc, Honeywell Fluka, Grace & Co, SYLOBEAD & SYLOSIV, Zeochem AG, Merck KGaA, MolsivCN, UNION SHOWA KK, Van Air, are attempting to expand market share and demand by investing in R&D operations to produce sustainable and affordable solutions.

    Shell Plc manufactures oil and natural gas. It works in four divisions: Unified Gas, Upstream, Downstream, and Administration. The Hague, the Netherlands-based firm, was formed in February 1907. The corporation seeks and generates natural gas and oil from traditional fields and resources, including tight rock, shale rock, and coal deposits. Following collaborative cooperation, Shell, a key participant in the energy business, established a partnership with catalyst specialist BASF's Sorbead Adsorption Technologies in its carbon fall program. The collaboration involves evaluating the use of Sorbead technologies across post-combustion CCS (carbon capture and storage) operations.

    Honeywell International is a software technology corporation specializing in aerospace and automobile services and goods. Albert M. Butz created the corporation in 1885, located in Charlotte, North Carolina. It specializes in turbocharger control, sensing, and safety equipment for buildings & homes; specialized chemicals; electronics and sophisticated materials; refining and petrochemical process Technology; and energy-efficient goods and products for homes, businesses, and transportation. Its business divisions are Aerospace, Housing, Construction Technologies, Superior Materials and Technologies, and Security and Efficiency Solutions. In May 2021, Honeywell International announced that it would provide USD 3 million in assistance to India through the Covid-19 procedure.

    Personnel from the company constructed critical care units with protective gear, air, and beds. Defense Research and Development Organization and the Indian Institute of Petroleum also use the company's molecular sieve adsorbents.

    Key Companies in the Molecular Sieves Market market include

    Industry Developments

    October 2021: Carbon Capture Inc. reported the completion of a USD thirty-five million Series A fundraising round. The money will be used to establish initial installations of the company's sustainable energy-powered Direct Air Capture devices across the United States.

    September 2021: Following collaborative cooperation, Shell, a key participant in the energy business, established a partnership with catalyst specialist BASF's Sorbead Adsorption Technologies in its carbon fall program. The collaboration involves evaluating the use of Sorbead technologies across post-combustion CCS (carbon capture and storage) operations.

    May 2021: Honeywell International announced that it will provide USD 3 million in assistance to India through the Covid-19 procedure. Personnel from the company constructed critical care units with protective gear, air, and beds. DRDO and the Indian Institute of Petroleum also use the company's molecular sieve adsorbents.

    Future Outlook

    Molecular Sieves Market Future Outlook

    <p>The Global Molecular Sieves Market is projected to grow at a 4.46% CAGR from 2025 to 2035, driven by increasing demand in petrochemical and gas separation applications.</p>

    New opportunities lie in:

    • <p>Develop advanced molecular sieve technologies for enhanced adsorption efficiency. Expand into emerging markets with tailored product offerings. Leverage digitalization for predictive maintenance and operational efficiency.</p>

    <p>By 2035, the market is expected to exhibit robust growth, solidifying its position as a key player in industrial applications.</p>

    Market Segmentation

    Molecular Sieves Regional Outlook

    • {"North America"=>["US"
    • "Canada"]}
    • {"Europe"=>["Germany"
    • "France"
    • "UK"
    • "Italy"
    • "Spain"
    • "Rest of Europe"]}
    • {"Asia-Pacific"=>["China"
    • "Japan"
    • "India"
    • "Australia"
    • "South Korea"
    • "Rest of Asia-Pacific"]}
    • {"Rest of the World"=>["Middle East"
    • "Africa"
    • "Latin America"]}

    Molecular Sieves Shape Outlook (USD Billion, 2018-2032)

    • Beads
    • Pellets
    • Powder

    Molecular Sieves Product Outlook (USD Billion, 2018-2032)

    • Zeolites
    • Activated Carbon
    • Clay
    • Others

    Molecular Sieves End-User Outlook (USD Billion, 2018-2032)

    • Oil & Gas
    • Automotive
    • Packaging
    • Coatings
    • Wastewater Treatment
    • Detergents
    • Others

    Molecular Sieves Component Outlook (USD Billion, 2018-2032)

    • 4A
    • 3A
    • 5A
    • 13X
    • Zeolite Y
    • Others

    Report Scope

    Report Attribute/MetricDetails
    Market Size 2024USD 4.63 Billion
    Market Size 20357.48 (Value (USD Billion))
    Compound Annual Growth Rate (CAGR)4.46% (2025 - 2035)
    Base Year2024
    Market Forecast Period2025 - 2035
    Historical Data2018- 2022
    Market Forecast UnitsValue (USD Billion)
    Report CoverageRevenue Forecast, Market Competitive Landscape, Growth Factors, and Trends
    Segments CoveredType, Shape, Product, End-User, and Region
    Geographies CoveredNorth America, Europe, Asia Pacific, and the Rest of the World
    Countries CoveredThe US, Canada, German, France, UK, Italy, Spain, China, Japan, India, Australia, South Korea, and Brazil
    Key Companies Profiled Sorbead India, Tosoh Corporation, BASF SE (Germany), Honeywell International Inc, Honeywell Fluka, Grace & Co, SYLOBEAD & SYLOSIV, KNT Group, Zeochem AG, Merck KGaA, MolsivCN, UNION SHOWA KK, Van Air, Inc
    Key Market OpportunitiesThe need for the automotive & transport sectors is increasing
    Key Market DynamicsThe oil and gas sectors have a high need for molecular sieving devices
    Market Size 20254.84 (Value (USD Billion))

    Market Highlights

    Author

    Chitranshi Jaiswal
    Research Analyst Level I

    She holds an experience of about 6+ years in market research and business consulting, working under the spectrum of information communication technology, telecommunications and semiconductor domains. aarti conceptualizes and implements a scalable business strategy and provides strategic leadership to the clients. her expertise lies in market estimation, competitive intelligence, pipeline analysis, customer assessment, etc.

    Leave a Comment

    Latest Comments

    John Doe
    john@example.com

    This is a great article! Really helped me understand the topic better.

    Posted on July 23, 2025, 10:15 AM
    Jane Smith
    jane@domain.com

    Thanks for sharing this. I’ve bookmarked it for later reference.

    Posted on July 22, 2025, 7:45 PM

    FAQs

    How much is the Molecular Sieves market?

    The Molecular Sieves market size was valued at USD 4.41 Billion in 2023.

    What is the growth rate of the Molecular Sieves market?

    The Molecular Sieves market is projected to grow at a CAGR of 4.46% during the forecast period, 2024-2032.

    Which region held the largest market share in the Molecular Sieves market?

    North America had the largest share of the Molecular Sieves market

    Who are the key players in the Molecular Sieves market?

    The key players in the Molecular Sieves market are Sorbead India, Tosoh Corporation, BASF SE, Honeywell International Inc, Honeywell Fluka, Grace &amp; Co SYLOBEAD &amp; SYLOSIV, KNT Group, Zeochem AG, Merck KGaA, MolsivCN, UNION SHOWA KK, Van Air.

    Which type led the Molecular Sieves market?

    The 4A category dominated the Molecular Sieves market in 2023.

    Which Shape had the largest market share in the Molecular Sieves market?

    The Beads has the largest share in the Molecular Sieves market.

    1. Table of Contents
    2. Executive Summary 22
      1. GLOBAL MOLECULAR SIEVES MARKET, BY TYPE 24
        1. GLOBAL MOLECULAR SIEVES MARKET, BY SHAPE 25
        2. GLOBAL MOLECULAR SIEVES MARKET, BY PRODUCT 26
        3. GLOBAL MOLECULAR SIEVES MARKET, BY END USE 27
        4. GLOBAL MOLECULAR SIEVES MARKET, BY REGION 28
    3. Market Introduction 29
      1. DEFINITION 29
      2. Scope of the Study 29
      3. MARKET STRUCTURE 29
    4. Research Methodology 30
      1. RESEARCH PROCESS 30
      2. PRIMARY RESEARCH 31
      3. SECONDARY RESEARCH 32
      4. MARKET SIZE ESTIMATION 32
      5. FORECAST MODEL 34
      6. LIST OF ASSUMPTIONS 34
    5. MARKET DYNAMICS 35
      1. INTRODUCTION 35
      2. DRIVERS 36
        1. SUPERIOR PERFORMANCE CHARACTERISTICS 36
        2. HIGH DEMAND IN THE OIL & GAS INDUSTRY 36
        3. GROWING DEMAND IN THE AUTOMOTIVE & TRANSPORTATION INDUSTRIES 37
        4. DRIVERS IMPACT ANALYSIS 38
      3. RESTRAINTS 38
        1. HIGH COST OF MOLECULAR SIEVES 38
        2. RESTRAINTS IMPACT ANALYSIS 39
      4. OPPORTUNITIES 39
        1. GROWTH PROSPECTS IN THE PHARMACEUTICAL INDUSTRY 39
      5. TRENDS 39
        1. EXPANDING DEMAND FOR MEDICAL-GRADE MOLECULAR SIEVES FOR OXYGEN CONCENTRATORS 39
        2. INCREASING APPLICATION OF MOLECULAR SIEVES IN THE CONSUMER GOODS PACKAGING 40
    6. MARKET FACTOR ANALYSIS 41
      1. SUPPLY CHAIN ANALYSIS 41
        1. RAW MATERIALS SUPPLIERS 41
        2. MOLECULAR SIEVES MANUFACTURERS 42
        3. DISTRIBUTION CHANNELS 42
        4. END USERS 42
      2. PORTER’S FIVE FORCES MODEL 43
        1. THREAT OF NEW ENTRANTS 44
        2. BARGAINING POWER OF SUPPLIERS 44
        3. THREAT OF SUBSTITUTES 44
        4. BARGAINING POWER OF BUYERS 44
        5. INTENSITY OF RIVALRY 44
      3. GLOBAL MOLECULAR SIEVES MARKET, PRICING ANALYSIS 44
      4. IMPACT OF COVID-19 ON THE GLOBAL MOLECULAR SIEVES MARKET 45
        1. SUPPLY-DEMAND SCENARIO 45
        2. MAJOR GOVERNMENT POLICIES TO COUNTER THE IMPACT OF COVID-19 45
        3. QUALITATIVE ANALYSIS ON CHANGE IN DEMAND FROM END USERS 48
    7. GLOBAL MOLECULAR SIEVES MARKET, BY TYPE 50
      1. OVERVIEW 50
        1. MOLECULAR SIEVES: MARKET ESTIMATES & FORECAST BY TYPE, 2023-2032 51
        2. MOLECULAR SIEVES: MARKET ESTIMATES & FORECAST BY TYPE, 2023-2032 52
      2. 4A 52
        1. 4A: MARKET ESTIMATES & FORECAST BY REGION,2023-2032 52
      3. 3A 53
        1. 3A: MARKET ESTIMATES & FORECAST BY REGION,2023-2032 53
      4. 5A 54
        1. 5A: MARKET ESTIMATES & FORECAST BY REGION,2023-2032 54
      5. 13X 55
        1. 13X: MARKET ESTIMATES & FORECAST BY REGION,2023-2032 55
      6. ZEOLITE Y 56
        1. ZEOLITE Y: MARKET ESTIMATES & FORECAST BY REGION,2023-2032 56
      7. OTHERS 57
        1. OTHERS: MARKET ESTIMATES & FORECAST BY REGION,2023-2032 57
    8. GLOBAL MOLECULAR SIEVES MARKET, BY SHAPE 59
      1. OVERVIEW 59
        1. MOLECULAR SIEVES: MARKET ESTIMATES & FORECAST BY SHAPE, 2023-2032 60
        2. MOLECULAR SIEVES: MARKET ESTIMATES & FORECAST BY SHAPE, 2023-2032 61
      2. BEADS 61
        1. BEADS: MARKET ESTIMATES & FORECAST BY REGION,2023-2032 61
      3. PELLET 62
        1. PELLET: MARKET ESTIMATES & FORECAST BY REGION,2023-2032 62
      4. POWDER 63
        1. POWDER: MARKET ESTIMATES & FORECAST BY REGION,2023-2032 63
    9. GLOBAL MOLECULAR SIEVES MARKET, BY PRODUCT 65
      1. OVERVIEW 65
        1. MOLECULAR SIEVES: MARKET ESTIMATES & FORECAST BY PRODUCT, 2023-2032 66
        2. MOLECULAR SIEVES: MARKET ESTIMATES & FORECAST BY PRODUCT, 2023-2032 67
      2. ZEOLITES 67
        1. ZEOLITES: MARKET ESTIMATES & FORECAST BY REGION,2023-2032 67
      3. ACTIVATED CARBON 68
        1. ACTIVATED CARBON: MARKET ESTIMATES & FORECAST BY REGION,2023-2032 68
      4. CLAY 69
        1. CLAY: MARKET ESTIMATES & FORECAST BY REGION,2023-2032 69
      5. OTHERS 70
        1. OTHERS: MARKET ESTIMATES & FORECAST BY REGION,2023-2032 70
    10. GLOBAL MOLECULAR SIEVES MARKET, BY END-USE 72
      1. OVERVIEW 72
        1. MOLECULAR SIEVES: MARKET ESTIMATES & FORECAST BY END-USE, 2023-2032 73
        2. MOLECULAR SIEVES: MARKET ESTIMATES & FORECAST BY END-USE, 2023-2032 74
      2. OIL & GAS 74
        1. OIL & GAS: MARKET ESTIMATES & FORECAST BY REGION,2023-2032 75
      3. AUTOMOTIVE 75
        1. AUTOMOTIVE: MARKET ESTIMATES & FORECAST BY REGION,2023-2032 76
      4. PACKAGING 77
        1. PACKAGING: MARKET ESTIMATES & FORECAST BY REGION,2023-2032 77
      5. COATINGS 78
        1. COATINGS: MARKET ESTIMATES & FORECAST BY REGION,2023-2032 78
      6. WASTEWATER TREATMENT 79
        1. WASTEWATER TREATMENT: MARKET ESTIMATES & FORECAST BY REGION,2023-2032 79
      7. DETERGENTS 80
        1. DETERGENTS: MARKET ESTIMATES & FORECAST BY REGION,2023-2032 80
      8. OTHERS 81
        1. OTHERS: MARKET ESTIMATES & FORECAST BY REGION,2023-2032 81
    11. GLOBAL MOLECULAR SIEVES MARKET, BY REGION 82
      1. OVERVIEW 82
      2. NORTH AMERICA 85
        1. US 89
        2. CANADA 92
      3. EUROPE 96
        1. GERMANY 100
        2. RUSSIA 103
        3. UK 106
        4. ITALY 109
        5. FRANCE 112
        6. SPAIN 115
        7. POLAND 118
        8. BELGIUM 121
        9. THE NETHERLANDS 124
        10. REST OF EUROPE 127
      4. ASIA-PACIFIC 131
        1. CHINA 135
        2. JAPAN 138
        3. INDIA 141
        4. SOUTH KOREA 144
        5. INDONESIA 147
        6. THAILAND 150
        7. AUSTRALIA & NEW ZEALAND 153
        8. MALAYSIA 156
        9. REST OF ASIA-PACIFIC 159
      5. LATIN AMERICA 163
        1. BRAZIL 167
        2. MEXICO 170
        3. ARGENTINA 173
        4. REST OF LATIN AMERICA 176
      6. THE MIDDLE EAST & AFRICA 180
        1. TURKEY 184
        2. SAUDI ARABIA 187
        3. ISRAEL 190
        4. UAE 193
        5. EGYPT 196
        6. REST OF THE MIDDLE EAST & AFRICA 199
    12. Competitive Landscape 203
      1. COMPETITIVEOVERVIEW 203
      2. MARKET STRATEGY ANALYSIS 203
      3. KEY DEVELOPMENTS 204
      4. COMPETITIVE BENCHMARKING 205
    13. COMPANY PROFILES 206
      1. BASF SE 206
        1. COMPANY OVERVIEW 206
        2. FINANCIAL OVERVIEW 207
        3. PRODUCTS OFFERED 207
        4. KEY DEVELOPMENTS 208
        5. SWOT ANALYSIS 208
        6. KEY STRATEGIES 208
      2. MERCK KGAA 209
        1. COMPANY OVERVIEW 209
        2. FINANCIAL OVERVIEW 210
        3. PRODUCTS OFFERED 210
        4. KEY DEVELOPMENTS 211
        5. SWOT ANALYSIS 212
        6. KEY STRATEGIES 212
      3. HONEYWELL INTERNATIONAL INC 213
        1. COMPANY OVERVIEW 213
        2. FINANCIAL OVERVIEW 214
        3. PRODUCTS OFFERED 214
        4. KEY DEVELOPMENTS 214
        5. SWOT ANALYSIS 215
        6. KEY STRATEGIES 215
      4. ARKEMA 216
        1. COMPANY OVERVIEW 216
        2. FINANCIAL OVERVIEW 216
        3. PRODUCTS OFFERED 217
        4. SWOT ANALYSIS 218
        5. KEY STRATEGIES 218
      5. SORBEAD INDIA 219
        1. COMPANY OVERVIEW 219
        2. FINANCIAL OVERVIEW 219
        3. PRODUCTS OFFERED 219
        4. KEY DEVELOPMENTS 219
        5. SWOT ANALYSIS 220
        6. KEY STRATEGIES 220
      6. TOSOH CORPORATION 221
        1. COMPANY OVERVIEW 221
        2. FINANCIAL OVERVIEW 222
        3. PRODUCTS OFFERED 222
        4. KEY DEVELOPMENTS 223
        5. SWOT ANALYSIS 223
        6. KEY STRATEGIES 223
      7. W. R. GRACE & CO 224
        1. COMPANY OVERVIEW 224
        2. FINANCIAL OVERVIEW 224
        3. PRODUCTS OFFERED 225
        4. KEY DEVELOPMENTS 225
        5. SWOT ANALYSIS 226
        6. KEY STRATEGIES 226
      8. KNT GROUP 227
        1. COMPANY OVERVIEW 227
        2. FINANCIAL OVERVIEW 227
        3. PRODUCTS OFFERED 227
        4. KEY DEVELOPMENTS 227
        5. SWOT ANALYSIS 228
        6. KEY STRATEGIES 228
      9. ZEOCHEM AG 229
        1. COMPANY OVERVIEW 229
        2. FINANCIAL OVERVIEW 229
        3. PRODUCTS OFFERED 229
        4. KEY DEVELOPMENT 230
        5. SWOT ANALYSIS 231
        6. KEY STRATEGIES 231
      10. MOLSIVCN 232
        1. COMPANY OVERVIEW 232
        2. FINANCIAL OVERVIEW 232
        3. PRODUCTS OFFERED 232
        4. KEY DEVELOPMENTS 233
        5. SWOT ANALYSIS 233
        6. KEY STRATEGIES 233
      11. UNION SHOWA KK. 234
        1. COMPANY OVERVIEW 234
        2. FINANCIAL OVERVIEW 234
        3. PRODUCTS OFFERED 234
        4. KEY DEVELOPMENTS 235
        5. SWOT ANALYSIS 236
        6. KEY STRATEGIES 236
      12. VAN AIR INC. 237
        1. COMPANY OVERVIEW 237
        2. FINANCIAL OVERVIEW 237
        3. PRODUCTS OFFERED 237
        4. KEY DEVELOPMENTS 237
        5. SWOT ANALYSIS 238
        6. KEY STRATEGIES 238
    14. APPENDIX 239
      1. REFERENCES 239
      2. RELATED REPORTS 239
    15. List of Tables and Figures
      1. LIST OF TABLES
      2. TABLE 1 LIST OF ASSUMPTIONS 34
      3. TABLE 2 GLOBAL MOLECULAR SIEVES MARKET, PRICING ANALYSIS (USD/TONS) IMITATI 44
      4. TABLE 3 MOLECULAR SIEVES MARKET ESTIMATES & FORECAST, BY TYPE, 2023-2032 (USD MILLION) 51
      5. TABLE 4 MOLECULAR SIEVES MARKET ESTIMATES & FORECAST, BY TYPE, 2023-2032 (KILOTONS) 52
      6. TABLE 5 4A MARKET ESTIMATES & FORECAST, BY REGION, 2023-2032 (USD MILLION) 52
      7. TABLE 6 4A MARKET ESTIMATES & FORECAST, BY REGION, 2023-2032 (KILOTONS) 53
      8. TABLE 7 3A MARKET ESTIMATES & FORECAST, BY REGION, 2023-2032 (USD MILLION) 53
      9. TABLE 8 3A MARKET ESTIMATES & FORECAST, BY REGION, 2023-2032 (KILOTONS) 54
      10. TABLE 9 5A MARKET ESTIMATES & FORECAST, BY REGION, 2023-2032 (USD MILLION) 54
      11. TABLE 10 5A MARKET ESTIMATES & FORECAST, BY REGION, 2023-2032 (KILOTONS) 55
      12. TABLE 11 13X MARKET ESTIMATES & FORECAST, BY REGION, 2023-2032 (USD MILLION) 55
      13. TABLE 12 13X MARKET ESTIMATES & FORECAST, BY REGION, 2023-2032 (KILOTONS) 56
      14. TABLE 13 ZEOLITE Y MARKET ESTIMATES & FORECAST, BY REGION, 2023-2032 (USD MILLION) 56
      15. TABLE 14 ZEOLITE Y MARKET ESTIMATES & FORECAST, BY REGION, 2023-2032 (KILOTONS) 57
      16. TABLE 15 OTHERS MARKET ESTIMATES & FORECAST, BY REGION, 2023-2032 (USD MILLION) 57
      17. TABLE 16 OTHERS MARKET ESTIMATES & FORECAST, BY REGION, 2023-2032 (KILOTONS) 58
      18. TABLE 17 MOLECULAR SIEVES MARKET ESTIMATES & FORECAST, BY SHAPE, 2023-2032 (USD MILLION) 60
      19. TABLE 18 MOLECULAR SIEVES MARKET ESTIMATES & FORECAST, BY SHAPE, 2023-2032 (KILOTONS) 61
      20. TABLE 19 BEADS MARKET ESTIMATES & FORECAST, BY REGION, 2023-2032 (USD MILLION) 61
      21. TABLE 20 BEADS MARKET ESTIMATES & FORECAST, BY REGION, 2023-2032 (KILOTONS) 62
      22. TABLE 21 PELLET MARKET ESTIMATES & FORECAST, BY REGION, 2023-2032 (USD MILLION) 62
      23. TABLE 22 PELLET MARKET ESTIMATES & FORECAST, BY REGION, 2023-2032 (KILOTONS) 63
      24. TABLE 23 POWDER MARKET ESTIMATES & FORECAST, BY REGION, 2023-2032 (USD MILLION) 63
      25. TABLE 24 POWDER MARKET ESTIMATES & FORECAST, BY REGION, 2023-2032 (KILOTONS) 64
      26. TABLE 25 MOLECULAR SIEVES MARKET ESTIMATES & FORECAST, BY PRODUCT, 2023-2032 (USD MILLION) 66
      27. TABLE 26 MOLECULAR SIEVES MARKET ESTIMATES & FORECAST, BY PRODUCT, 2023-2032 (KILOTONS) 67
      28. TABLE 27 ZEOLITES MARKET ESTIMATES & FORECAST, BY REGION, 2023-2032 (USD MILLION) 67
      29. TABLE 28 ZEOLITES MARKET ESTIMATES & FORECAST, BY REGION, 2023-2032 (KILOTONS) 68
      30. TABLE 29 ACTIVATED CARBON MARKET ESTIMATES & FORECAST, BY REGION, 2023-2032 (USD MILLION) 68
      31. TABLE 30 ACTIVATED CARBON MARKET ESTIMATES & FORECAST, BY REGION, 2023-2032 (KILOTONS) 69
      32. TABLE 31 CLAY MARKET ESTIMATES & FORECAST, BY REGION, 2023-2032 (USD MILLION) 69
      33. TABLE 32 CLAY MARKET ESTIMATES & FORECAST, BY REGION, 2023-2032 (KILOTONS) 70
      34. TABLE 33 OTHERS MARKET ESTIMATES & FORECAST, BY REGION, 2023-2032 (USD MILLION) 70
      35. TABLE 34 OTHERS MARKET ESTIMATES & FORECAST, BY REGION, 2023-2032 (KILOTONS) 71
      36. TABLE 35 MOLECULAR SIEVES MARKET ESTIMATES & FORECAST, BY END-USE, 2023-2032 (USD MILLION) 73
      37. TABLE 36 MOLECULAR SIEVES MARKET ESTIMATES & FORECAST, BY END-USE, 2023-2032 (KILOTONS) 74
      38. TABLE 37 OIL & GAS MARKET ESTIMATES & FORECAST, BY REGION, 2023-2032 (USD MILLION) 75
      39. TABLE 38 OIL & GAS MARKET ESTIMATES & FORECAST, BY REGION, 2023-2032 (KILOTONS) 75
      40. TABLE 39 AUTOMOTIVE MARKET ESTIMATES & FORECAST, BY REGION, 2023-2032 (USD MILLION) 76
      41. TABLE 40 AUTOMOTIVE MARKET ESTIMATES & FORECAST, BY REGION, 2023-2032 (KILOTONS) 76
      42. TABLE 41 PACKAGING MARKET ESTIMATES & FORECAST, BY REGION, 2023-2032 (USD MILLION) 77
      43. TABLE 42 PACKAGING MARKET ESTIMATES & FORECAST, BY REGION, 2023-2032 (KILOTONS) 77
      44. TABLE 43 COATINGS MARKET ESTIMATES & FORECAST, BY REGION, 2023-2032 (USD MILLION) 78
      45. TABLE 44 COATINGS MARKET ESTIMATES & FORECAST, BY REGION, 2023-2032 (KILOTONS) 78
      46. TABLE 45 WASTEWATER TREATMENT MARKET ESTIMATES & FORECAST, BY REGION, 2023-2032 (USD MILLION) 79
      47. TABLE 46 WASTEWATER TREATMENT MARKET ESTIMATES & FORECAST, BY REGION, 2023-2032 (KILOTONS) 79
      48. TABLE 47 DETERGENTS MARKET ESTIMATES & FORECAST, BY REGION, 2023-2032 (USD MILLION) 80
      49. TABLE 48 DETERGENTS MARKET ESTIMATES & FORECAST, BY REGION, 2023-2032 (KILOTONS) 80
      50. TABLE 49 OTHERS MARKET ESTIMATES & FORECAST, BY REGION, 2023-2032 (USD MILLION) 81
      51. TABLE 50 OTHERS MARKET ESTIMATES & FORECAST, BY REGION, 2023-2032 (KILOTONS) 81
      52. TABLE 51 GLOBAL MOLECULAR SIEVES MARKET, BY REGION, 2023-2032 (USD MILLION) 83
      53. TABLE 52 GLOBAL MOLECULAR SIEVES MARKET, BY REGION, 2023-2032 (KILOTONS) 84
      54. TABLE 53 NORTH AMERICA: MOLECULAR SIEVES MARKET, BY COUNTRY, 2023-2032 (USD MILLION) 85
      55. TABLE 54 NORTH AMERICA: MOLECULAR SIEVES MARKET, BY COUNTRY, 2023-2032 (KILOTONS) 85
      56. TABLE 55 NORTH AMERICA: MOLECULAR SIEVES MARKET, BY TYPE, 2023-2032 (USD MILLION) 86
      57. TABLE 56 NORTH AMERICA: MOLECULAR SIEVES MARKET, BY TYPE, 2023-2032 (KILOTONS) 86
      58. TABLE 57 NORTH AMERICA: MOLECULAR SIEVES MARKET, BY SHAPE, 2023-2032 (USD MILLION) 86
      59. TABLE 58 NORTH AMERICA: MOLECULAR SIEVES MARKET, BY SHAPE, 2023-2032 (KILOTONS) 87
      60. TABLE 59 NORTH AMERICA: MOLECULAR SIEVES MARKET, BY PRODUCT, 2023-2032 (USD MILLION) 87
      61. TABLE 60 NORTH AMERICA: MOLECULAR SIEVES MARKET, BY PRODUCT, 2023-2032 (KILOTONS) 87
      62. TABLE 61 NORTH AMERICA: MOLECULAR SIEVES MARKET, BY END-USE, 2023-2032 (USD MILLION) 88
      63. TABLE 62 NORTH AMERICA: MOLECULAR SIEVES MARKET, BY END-USE, 2023-2032 (KILOTONS) 88
      64. TABLE 63 US: MOLECULAR SIEVES MARKET, BY TYPE, 2023-2032 (USD MILLION) 89
      65. TABLE 64 US: MOLECULAR SIEVES MARKET, BY TYPE, 2023-2032 (KILOTONS) 89
      66. TABLE 65 US: MOLECULAR SIEVES MARKET, BY SHAPE, 2023-2032 (USD MILLION) 90
      67. TABLE 66 US: MOLECULAR SIEVES MARKET, BY SHAPE, 2023-2032 (KILOTONS) 90
      68. TABLE 67 US: MOLECULAR SIEVES MARKET, BY PRODUCT, 2023-2032 (USD MILLION) 90
      69. TABLE 68 US: MOLECULAR SIEVES MARKET, BY PRODUCT, 2023-2032 (KILOTONS) 91
      70. TABLE 69 US: MOLECULAR SIEVES MARKET, BY END-USE, 2023-2032 (USD MILLION) 91
      71. TABLE 70 US: MOLECULAR SIEVES MARKET, BY END-USE, 2023-2032 (KILOTONS) 92
      72. TABLE 71 CANADA: MOLECULAR SIEVES MARKET, BY TYPE, 2023-2032 (USD MILLION) 92
      73. TABLE 72 CANADA: MOLECULAR SIEVES MARKET, BY TYPE, 2023-2032 (KILOTONS) 93
      74. TABLE 73 CANADA: MOLECULAR SIEVES MARKET, BY SHAPE, 2023-2032 (USD MILLION) 93
      75. TABLE 74 CANADA: MOLECULAR SIEVES MARKET, BY SHAPE, 2023-2032 (KILOTONS) 93
      76. TABLE 75 CANADA: MOLECULAR SIEVES MARKET, BY PRODUCT, 2023-2032 (USD MILLION) 94
      77. TABLE 76 CANADA: MOLECULAR SIEVES MARKET, BY PRODUCT, 2023-2032 (KILOTONS) 94
      78. TABLE 77 CANADA: MOLECULAR SIEVES MARKET, BY END-USE, 2023-2032 (USD MILLION) 94
      79. TABLE 78 CANADA: MOLECULAR SIEVES MARKET, BY END-USE, 2023-2032 (KILOTONS) 95
      80. TABLE 79 EUROPE: MOLECULAR SIEVES MARKET, BY COUNTRY, 2023-2032 (USD MILLION) 96
      81. TABLE 80 EUROPE: MOLECULAR SIEVES MARKET, BY COUNTRY, 2023-2032 (KILOTONS) 97
      82. TABLE 81 EUROPE: MOLECULAR SIEVES MARKET, BY TYPE, 2023-2032 (USD MILLION) 97
      83. TABLE 82 EUROPE: MOLECULAR SIEVES MARKET, BY TYPE, 2023-2032 (KILOTONS) 98
      84. TABLE 83 EUROPE: MOLECULAR SIEVES MARKET, BY SHAPE, 2023-2032 (KILOTONS) 98
      85. TABLE 84 EUROPE: MOLECULAR SIEVES MARKET, BY SHAPE, 2023-2032 (USD MILLION) 98
      86. TABLE 85 EUROPE: MOLECULAR SIEVES MARKET, BY PRODUCT, 2023-2032 (USD MILLION) 99
      87. TABLE 86 EUROPE: MOLECULAR SIEVES MARKET, BY PRODUCT, 2023-2032 (KILOTONS) 99
      88. TABLE 87 EUROPE: MOLECULAR SIEVES MARKET, BY END-USE, 2023-2032 (USD MILLION) 99
      89. TABLE 88 EUROPE: MOLECULAR SIEVES MARKET, BY END-USE, 2023-2032 (KILOTONS) 100
      90. TABLE 89 GERMANY: MOLECULAR SIEVES MARKET, BY TYPE, 2023-2032 (USD MILLION) 100
      91. TABLE 90 GERMANY: MOLECULAR SIEVES MARKET, BY TYPE, 2023-2032 (KILOTONS) 101
      92. TABLE 91 GERMANY: MOLECULAR SIEVES MARKET, BY SHAPE, 2023-2032 (USD MILLION) 101
      93. TABLE 92 GERMANY: MOLECULAR SIEVES MARKET, BY SHAPE, 2023-2032 (KILOTONS) 101
      94. TABLE 93 GERMANY: MOLECULAR SIEVES MARKET, BY PRODUCT, 2023-2032 (USD MILLION) 102
      95. TABLE 94 GERMANY: MOLECULAR SIEVES MARKET, BY PRODUCT, 2023-2032 (KILOTONS) 102
      96. TABLE 95 GERMANY: MOLECULAR SIEVES MARKET, BY END-USE, 2023-2032 (USD MILLION) 102
      97. TABLE 96 GERMANY: MOLECULAR SIEVES MARKET, BY END-USE, 2023-2032 (KILOTONS) 103
      98. TABLE 97 RUSSIA: MOLECULAR SIEVES MARKET, BY TYPE, 2023-2032 (USD MILLION) 103
      99. TABLE 98 RUSSIA: MOLECULAR SIEVES MARKET, BY TYPE, 2023-2032 (KILOTONS) 104
      100. TABLE 99 RUSSIA: MOLECULAR SIEVES MARKET, BY SHAPE, 2023-2032 (USD MILLION) 104
      101. TABLE 100 RUSSIA: MOLECULAR SIEVES MARKET, BY SHAPE, 2023-2032 (KILOTONS) 104
      102. TABLE 101 RUSSIA: MOLECULAR SIEVES MARKET, BY PRODUCT, 2023-2032 (USD MILLION) 105
      103. TABLE 102 RUSSIA: MOLECULAR SIEVES MARKET, BY PRODUCT, 2023-2032 (KILOTONS) 105
      104. TABLE 103 RUSSIA: MOLECULAR SIEVES MARKET, BY END-USE, 2023-2032 (USD MILLION) 105
      105. TABLE 104 RUSSIA: MOLECULAR SIEVES MARKET, BY END-USE, 2023-2032 (KILOTONS) 106
      106. TABLE 105 UK: MOLECULAR SIEVES MARKET, BY TYPE, 2023-2032 (USD MILLION) 106
      107. TABLE 106 UK: MOLECULAR SIEVES MARKET, BY TYPE, 2023-2032 (KILOTONS) 107
      108. TABLE 107 UK: MOLECULAR SIEVES MARKET, BY SHAPE, 2023-2032 (USD MILLION) 107
      109. TABLE 108 UK: MOLECULAR SIEVES MARKET, BY SHAPE, 2023-2032 (KILOTONS) 107
      110. TABLE 109 UK: MOLECULAR SIEVES MARKET, BY PRODUCT, 2023-2032 (USD MILLION) 108
      111. TABLE 110 UK: MOLECULAR SIEVES MARKET, BY PRODUCT, 2023-2032 (KILOTONS) 108
      112. TABLE 111 UK: MOLECULAR SIEVES MARKET, BY END-USE, 2023-2032 (KILOTONS) 108
      113. TABLE 112 UK: MOLECULAR SIEVES MARKET, BY END-USE, 2023-2032 (KILOTONS) 109
      114. TABLE 113 ITALY: MOLECULAR SIEVES MARKET, BY TYPE, 2023-2032 (USD MILLION) 109
      115. TABLE 114 ITALY: MOLECULAR SIEVES MARKET, BY TYPE, 2023-2032 (KILOTONS) 110
      116. TABLE 115 ITALY: MOLECULAR SIEVES MARKET, BY SHAPE, 2023-2032 (USD MILLION) 110
      117. TABLE 116 ITALY: MOLECULAR SIEVES MARKET, BY SHAPE, 2023-2032 (KILOTONS) 110
      118. TABLE 117 ITALY: MOLECULAR SIEVES MARKET, BY PRODUCT, 2023-2032 (USD MILLION) 111
      119. TABLE 118 ITALY: MOLECULAR SIEVES MARKET, BY PRODUCT, 2023-2032 (KILOTONS) 111
      120. TABLE 119 ITALY: MOLECULAR SIEVES MARKET, BY END-USE, 2023-2032 (USD MILLION) 111
      121. TABLE 120 ITALY: MOLECULAR SIEVES MARKET, BY END-USE, 2023-2032 (KILOTONS) 112
      122. TABLE 121 FRANCE: MOLECULAR SIEVES MARKET, BY TYPE, 2023-2032 (USD MILLION) 112
      123. TABLE 122 FRANCE: MOLECULAR SIEVES MARKET, BY TYPE, 2023-2032 (KILOTONS) 113
      124. TABLE 123 FRANCE: MOLECULAR SIEVES MARKET, BY SHAPE, 2023-2032 (USD MILLION) 113
      125. TABLE 124 FRANCE: MOLECULAR SIEVES MARKET, BY SHAPE, 2023-2032 (KILOTONS) 113
      126. TABLE 125 FRANCE: MOLECULAR SIEVES MARKET, BY PRODUCT, 2023-2032 (USD MILLION) 114
      127. TABLE 126 FRANCE: MOLECULAR SIEVES MARKET, BY PRODUCT, 2023-2032 (KILOTONS) 114
      128. TABLE 127 FRANCE: MOLECULAR SIEVES MARKET, BY END-USE, 2023-2032 (USD MILLION) 114
      129. TABLE 128 FRANCE: MOLECULAR SIEVES MARKET, BY END-USE, 2023-2032 (KILOTONS) 115
      130. TABLE 129 SPAIN: MOLECULAR SIEVES MARKET, BY TYPE, 2023-2032 (USD MILLION) 115
      131. TABLE 130 SPAIN: MOLECULAR SIEVES MARKET, BY TYPE, 2023-2032 (KILOTONS) 116
      132. TABLE 131 SPAIN: MOLECULAR SIEVES MARKET, BY SHAPE, 2023-2032 (USD MILLION) 116
      133. TABLE 132 SPAIN: MOLECULAR SIEVES MARKET, BY SHAPE, 2023-2032 (KILOTONS) 116
      134. TABLE 133 SPAIN: MOLECULAR SIEVES MARKET, BY PRODUCT, 2023-2032 (USD MILLION) 117
      135. TABLE 134 SPAIN: MOLECULAR SIEVES MARKET, BY PRODUCT, 2023-2032 (KILOTONS) 117
      136. TABLE 135 SPAIN: MOLECULAR SIEVES MARKET, BY END-USE, 2023-2032 (USD MILLION) 117
      137. TABLE 136 SPAIN: MOLECULAR SIEVES MARKET, BY END-USE, 2023-2032 (KILOTONS) 118
      138. TABLE 137 POLAND: MOLECULAR SIEVES MARKET, BY TYPE, 2023-2032 (USD MILLION) 118
      139. TABLE 138 POLAND: MOLECULAR SIEVES MARKET, BY TYPE, 2023-2032 (KILOTONS) 119
      140. TABLE 139 POLAND: MOLECULAR SIEVES MARKET, BY SHAPE, 2023-2032 (USD MILLION) 119
      141. TABLE 140 POLAND: MOLECULAR SIEVES MARKET, BY SHAPE, 2023-2032 (KILOTONS) 119
      142. TABLE 141 POLAND: MOLECULAR SIEVES MARKET, BY PRODUCT, 2023-2032 (USD MILLION) 120
      143. TABLE 142 POLAND: MOLECULAR SIEVES MARKET, BY PRODUCT, 2023-2032 (KILOTONS) 120
      144. TABLE 143 POLAND: MOLECULAR SIEVES MARKET, BY END-USE, 2023-2032 (USD MILLION) 120
      145. TABLE 144 POLAND: MOLECULAR SIEVES MARKET, BY END-USE, 2023-2032 (KILOTONS) 121
      146. TABLE 145 BELGIUM: MOLECULAR SIEVES MARKET, BY TYPE, 2023-2032 (USD MILLION) 121
      147. TABLE 146 BELGIUM: MOLECULAR SIEVES MARKET, BY TYPE, 2023-2032 (KILOTONS) 122
      148. TABLE 147 BELGIUM: MOLECULAR SIEVES MARKET, BY SHAPE, 2023-2032 (USD MILLION) 122
      149. TABLE 148 BELGIUM: MOLECULAR SIEVES MARKET, BY SHAPE, 2023-2032 (KILOTONS) 122
      150. TABLE 149 BELGIUM: MOLECULAR SIEVES MARKET, BY PRODUCT, 2023-2032 (USD MILLION) 123
      151. TABLE 150 BELGIUM: MOLECULAR SIEVES MARKET, BY PRODUCT, 2023-2032 (KILOTONS) 123
      152. TABLE 151 BELGIUM: MOLECULAR SIEVES MARKET, BY END-USE, 2023-2032 (USD MILLION) 123
      153. TABLE 152 BELGIUM: MOLECULAR SIEVES MARKET, BY END-USE, 2023-2032 (KILOTONS) 124
      154. TABLE 153 THE NETHERLANDS: MOLECULAR SIEVES MARKET, BY TYPE, 2023-2032 (USD MILLION) 124
      155. TABLE 154 THE NETHERLANDS: MOLECULAR SIEVES MARKET, BY TYPE, 2023-2032 (KILOTONS) 125
      156. TABLE 155 THE NETHERLANDS: MOLECULAR SIEVES MARKET, BY SHAPE, 2023-2032 (USD MILLION) 125
      157. TABLE 156 THE NETHERLANDS: MOLECULAR SIEVES MARKET, BY SHAPE, 2023-2032 (KILOTONS) 125
      158. TABLE 157 THE NETHERLANDS: MOLECULAR SIEVES MARKET, BY PRODUCT, 2023-2032 (USD MILLION) 126
      159. TABLE 158 THE NETHERLANDS: MOLECULAR SIEVES MARKET, BY PRODUCT, 2023-2032 (KILOTONS) 126
      160. TABLE 159 THE NETHERLANDS: MOLECULAR SIEVES MARKET, BY END-USE, 2023-2032 (USD MILLION) 126
      161. TABLE 160 THE NETHERLANDS: MOLECULAR SIEVES MARKET, BY END-USE, 2023-2032 (KILOTONS) 127
      162. TABLE 161 REST OF EUROPE: MOLECULAR SIEVES MARKET, BY TYPE, 2023-2032 (USD MILLION) 127
      163. TABLE 162 REST OF EUROPE: MOLECULAR SIEVES MARKET, BY TYPE, 2023-2032 (KILOTONS) 128
      164. TABLE 163 REST OF EUROPE: MOLECULAR SIEVES MARKET, BY SHAPE, 2023-2032 (USD MILLION) 128
      165. TABLE 164 REST OF EUROPE: MOLECULAR SIEVES MARKET, BY SHAPE, 2023-2032 (KILOTONS) 128
      166. TABLE 165 REST OF EUROPE: MOLECULAR SIEVES MARKET, BY PRODUCT, 2023-2032 (USD MILLION) 129
      167. TABLE 166 REST OF EUROPE: MOLECULAR SIEVES MARKET, BY PRODUCT, 2023-2032 (KILOTONS) 129
      168. TABLE 167 REST OF EUROPE: MOLECULAR SIEVES MARKET, BY END-USE, 2023-2032 (USD MILLION) 129
      169. TABLE 168 REST OF EUROPE: MOLECULAR SIEVES MARKET, BY END-USE, 2023-2032 (KILOTONS) 130
      170. TABLE 169 ASIA-PACIFIC: MOLECULAR SIEVES MARKET, BY COUNTRY, 2023-2032 (USD MILLION) 131
      171. TABLE 170 ASIA-PACIFIC: MOLECULAR SIEVES MARKET, BY COUNTRY, 2023-2032 (KILOTONS) 132
      172. TABLE 171 ASIA-PACIFIC: MOLECULAR SIEVES MARKET, BY TYPE, 2023-2032 (USD MILLION) 132
      173. TABLE 172 ASIA-PACIFIC: MOLECULAR SIEVES MARKET, BY TYPE, 2023-2032 (KILOTONS) 133
      174. TABLE 173 ASIA-PACIFIC: MOLECULAR SIEVES MARKET, BY SHAPE, 2023-2032 (USD MILLION) 133
      175. TABLE 174 ASIA-PACIFIC: MOLECULAR SIEVES MARKET, BY SHAPE, 2023-2032 (KILOTONS) 133
      176. TABLE 175 ASIA-PACIFIC: MOLECULAR SIEVES MARKET, BY PRODUCT, 2023-2032 (USD MILLION) 134
      177. TABLE 176 ASIA-PACIFIC: MOLECULAR SIEVES MARKET, BY PRODUCT, 2023-2032 (KILOTONS) 134
      178. TABLE 177 ASIA-PACIFIC: MOLECULAR SIEVES MARKET, BY END-USE, 2023-2032 (USD MILLION) 134
      179. TABLE 178 ASIA-PACIFIC: MOLECULAR SIEVES MARKET, BY END-USE, 2023-2032 (KILOTONS) 135
      180. TABLE 179 CHINA: MOLECULAR SIEVES MARKET, BY TYPE, 2023-2032 (USD MILLION) 135
      181. TABLE 180 CHINA: MOLECULAR SIEVES MARKET, BY TYPE, 2023-2032 (KILOTONS) 136
      182. TABLE 181 CHINA: MOLECULAR SIEVES MARKET, BY SHAPE, 2023-2032 (USD MILLION) 136
      183. TABLE 182 CHINA: MOLECULAR SIEVES MARKET, BY SHAPE, 2023-2032 (KILOTONS) 136
      184. TABLE 183 CHINA: MOLECULAR SIEVES MARKET, BY PRODUCT, 2023-2032 (USD MILLION) 137
      185. TABLE 184 CHINA: MOLECULAR SIEVES MARKET, BY PRODUCT, 2023-2032 (KILOTONS) 137
      186. TABLE 185 CHINA: MOLECULAR SIEVES MARKET, BY END-USE, 2023-2032 (USD MILLION) 137
      187. TABLE 186 CHINA: MOLECULAR SIEVES MARKET, BY END-USE, 2023-2032 (KILOTONS) 138
      188. TABLE 187 JAPAN: MOLECULAR SIEVES MARKET, BY TYPE, 2023-2032 (USD MILLION) 138
      189. TABLE 188 JAPAN: MOLECULAR SIEVES MARKET, BY TYPE, 2023-2032 (KILOTONS) 139
      190. TABLE 189 JAPAN: MOLECULAR SIEVES MARKET, BY SHAPE, 2023-2032 (USD MILLION) 139
      191. TABLE 190 JAPAN: MOLECULAR SIEVES MARKET, BY SHAPE, 2023-2032 (KILOTONS) 139
      192. TABLE 191 JAPAN: MOLECULAR SIEVES MARKET, BY PRODUCT, 2023-2032 (USD MILLION) 140
      193. TABLE 192 JAPAN: MOLECULAR SIEVES MARKET, BY PRODUCT, 2023-2032 (KILOTONS) 140
      194. TABLE 193 JAPAN: MOLECULAR SIEVES MARKET, BY END-USE, 2023-2032 (USD MILLION) 140
      195. TABLE 194 JAPAN: MOLECULAR SIEVES MARKET, BY END-USE, 2023-2032 (KILOTONS) 141
      196. TABLE 195 INDIA: MOLECULAR SIEVES MARKET, BY TYPE, 2023-2032 (USD MILLION) 141
      197. TABLE 196 INDIA: MOLECULAR SIEVES MARKET, BY TYPE, 2023-2032 (KILOTONS) 142
      198. TABLE 197 INDIA: MOLECULAR SIEVES MARKET, BY SHAPE, 2023-2032 (USD MILLION) 142
      199. TABLE 198 INDIA: MOLECULAR SIEVES MARKET, BY SHAPE, 2023-2032 (KILOTONS) 142
      200. TABLE 199 INDIA: MOLECULAR SIEVES MARKET, BY PRODUCT, 2023-2032 (USD MILLION) 143
      201. TABLE 200 INDIA: MOLECULAR SIEVES MARKET, BY PRODUCT, 2023-2032 (KILOTONS) 143
      202. TABLE 201 INDIA: MOLECULAR SIEVES MARKET, BY END-USE, 2023-2032 (USD MILLION) 143
      203. TABLE 202 INDIA: MOLECULAR SIEVES MARKET, BY END-USE, 2023-2032 (KILOTONS) 144
      204. TABLE 203 SOUTH KOREA: MOLECULAR SIEVES MARKET, BY TYPE, 2023-2032 (USD MILLION) 144
      205. TABLE 204 SOUTH KOREA: MOLECULAR SIEVES MARKET, BY TYPE, 2023-2032 (KILOTONS) 145
      206. TABLE 205 SOUTH KOREA: MOLECULAR SIEVES MARKET, BY SHAPE, 2023-2032 (USD MILLION) 145
      207. TABLE 206 SOUTH KOREA: MOLECULAR SIEVES MARKET, BY SHAPE, 2023-2032 (KILOTONS) 145
      208. TABLE 207 SOUTH KOREA: MOLECULAR SIEVES MARKET, BY PRODUCT, 2023-2032 (USD MILLION) 146
      209. TABLE 208 SOUTH KOREA: MOLECULAR SIEVES MARKET, BY PRODUCT, 2023-2032 (KILOTONS) 146
      210. TABLE 209 SOUTH KOREA: MOLECULAR SIEVES MARKET, BY END-USE, 2023-2032 (USD MILLION) 146
      211. TABLE 210 SOUTH KOREA: MOLECULAR SIEVES MARKET, BY END-USE, 2023-2032 (KILOTONS) 147
      212. TABLE 211 INDONESIA: MOLECULAR SIEVES MARKET, BY TYPE, 2023-2032 (USD MILLION) 147
      213. TABLE 212 INDONESIA: MOLECULAR SIEVES MARKET, BY TYPE, 2023-2032 (KILOTONS) 148
      214. TABLE 213 INDONESIA: MOLECULAR SIEVES MARKET, BY SHAPE, 2023-2032 (USD MILLION) 148
      215. TABLE 214 INDONESIA: MOLECULAR SIEVES MARKET, BY SHAPE, 2023-2032 (KILOTONS) 148
      216. TABLE 215 INDONESIA: MOLECULAR SIEVES MARKET, BY PRODUCT, 2023-2032 (USD MILLION) 149
      217. TABLE 216 INDONESIA: MOLECULAR SIEVES MARKET, BY PRODUCT, 2023-2032 (KILOTONS) 149
      218. TABLE 217 INDONESIA: MOLECULAR SIEVES MARKET, BY END-USE, 2023-2032 (USD MILLION) 149
      219. TABLE 218 INDONESIA: MOLECULAR SIEVES MARKET, BY END-USE, 2023-2032 (KILOTONS) 150
      220. TABLE 219 THAILAND: MOLECULAR SIEVES MARKET, BY TYPE, 2023-2032 (USD MILLION) 150
      221. TABLE 220 THAILAND: MOLECULAR SIEVES MARKET, BY TYPE, 2023-2032 (KILOTONS) 151
      222. TABLE 221 THAILAND: MOLECULAR SIEVES MARKET, BY SHAPE, 2023-2032 (USD MILLION) 151
      223. TABLE 222 THAILAND: MOLECULAR SIEVES MARKET, BY SHAPE, 2023-2032 (KILOTONS) 151
      224. TABLE 223 THAILAND: MOLECULAR SIEVES MARKET, BY PRODUCT, 2023-2032 (USD MILLION) 152
      225. TABLE 224 THAILAND: MOLECULAR SIEVES MARKET, BY PRODUCT, 2023-2032 (KILOTONS) 152
      226. TABLE 225 THAILAND: MOLECULAR SIEVES MARKET, BY END-USE, 2023-2032 (USD MILLION) 152
      227. TABLE 226 THAILAND: MOLECULAR SIEVES MARKET, BY END-USE, 2023-2032 (KILOTONS) 153
      228. TABLE 227 AUSTRALIA & NEW ZEALAND: MOLECULAR SIEVES MARKET, BY TYPE, 2023-2032 (USD MILLION) 153
      229. TABLE 228 AUSTRALIA & NEW ZEALAND: MOLECULAR SIEVES MARKET, BY TYPE, 2023-2032 (KILOTONS) 154
      230. TABLE 229 AUSTRALIA & NEW ZEALAND: MOLECULAR SIEVES MARKET, BY SHAPE, 2023-2032 (USD MILLION) 154
      231. TABLE 230 AUSTRALIA & NEW ZEALAND: MOLECULAR SIEVES MARKET, BY SHAPE, 2023-2032 (KILOTONS) 154
      232. TABLE 231 AUSTRALIA & NEW ZEALAND: MOLECULAR SIEVES MARKET, BY PRODUCT, 2023-2032 (USD MILLION) 155
      233. TABLE 232 AUSTRALIA & NEW ZEALAND: MOLECULAR SIEVES MARKET, BY PRODUCT, 2023-2032 (KILOTONS) 155
      234. TABLE 233 AUSTRALIA & NEW ZEALAND: MOLECULAR SIEVES MARKET, BY END-USE, 2023-2032 (USD MILLION) 155
      235. TABLE 234 AUSTRALIA & NEW ZEALAND: MOLECULAR SIEVES MARKET, BY END-USE, 2023-2032 (KILOTONS) 156
      236. TABLE 235 MALAYSIA: MOLECULAR SIEVES MARKET, BY TYPE, 2023-2032 (USD MILLION) 156
      237. TABLE 236 MALAYSIA: MOLECULAR SIEVES MARKET, BY TYPE, 2023-2032 (KILOTONS) 157
      238. TABLE 237 MALAYSIA: MOLECULAR SIEVES MARKET, BY SHAPE, 2023-2032 (USD MILLION) 157
      239. TABLE 238 MALAYSIA: MOLECULAR SIEVES MARKET, BY SHAPE, 2023-2032 (KILOTONS) 157
      240. TABLE 239 MALAYSIA: MOLECULAR SIEVES MARKET, BY PRODUCT, 2023-2032 (USD MILLION) 158
      241. TABLE 240 MALAYSIA: MOLECULAR SIEVES MARKET, BY PRODUCT, 2023-2032 (KILOTONS) 158
      242. TABLE 241 MALAYSIA: MOLECULAR SIEVES MARKET, BY END-USE, 2023-2032 (USD MILLION) 158
      243. TABLE 242 MALAYSIA: MOLECULAR SIEVES MARKET, BY END-USE, 2023-2032 (KILOTONS) 159
      244. TABLE 243 REST OF ASIA-PACIFIC: MOLECULAR SIEVES MARKET, BY TYPE, 2023-2032 (USD MILLION) 159
      245. TABLE 244 REST OF ASIA-PACIFIC: MOLECULAR SIEVES MARKET, BY TYPE, 2023-2032 (KILOTONS) 160
      246. TABLE 245 REST OF ASIA-PACIFIC: MOLECULAR SIEVES MARKET, BY SHAPE, 2023-2032 (USD MILLION) 160
      247. TABLE 246 REST OF ASIA-PACIFIC: MOLECULAR SIEVES MARKET, BY SHAPE, 2023-2032 (KILOTONS) 160
      248. TABLE 247 REST OF ASIA-PACIFIC: MOLECULAR SIEVES MARKET, BY PRODUCT, 2023-2032 (USD MILLION) 161
      249. TABLE 248 REST OF ASIA-PACIFIC: MOLECULAR SIEVES MARKET, BY PRODUCT, 2023-2032 (KILOTONS) 161
      250. TABLE 249 REST OF ASIA-PACIFIC: MOLECULAR SIEVES MARKET, BY END-USE, 2023-2032 (USD MILLION) 161
      251. TABLE 250 REST OF ASIA-PACIFIC: MOLECULAR SIEVES MARKET, BY END-USE, 2023-2032 (KILOTONS) 162
      252. TABLE 251 LATIN AMERICA: MOLECULAR SIEVES MARKET, BY COUNTRY, 2023-2032 (USD MILLION) 163
      253. TABLE 252 LATIN AMERICA: MOLECULAR SIEVES MARKET, BY COUNTRY, 2023-2032 (KILOTONS) 163
      254. TABLE 253 LATIN AMERICA: MOLECULAR SIEVES MARKET, BY TYPE, 2023-2032 (USD MILLION) 164
      255. TABLE 254 LATIN AMERICA: MOLECULAR SIEVES MARKET, BY TYPE, 2023-2032 (KILOTONS) 164
      256. TABLE 255 LATIN AMERICA: MOLECULAR SIEVES MARKET, BY SHPAE, 2023-2032 (USD MILLION) 165
      257. TABLE 256 LATIN AMERICA: MOLECULAR SIEVES MARKET, BY SHAPE, 2023-2032 (KILOTONS) 165
      258. TABLE 257 LATIN AMERICA: MOLECULAR SIEVES MARKET, BY PRODUCT, 2023-2032 (USD MILLION) 165
      259. TABLE 258 LATIN AMERICA: MOLECULAR SIEVES MARKET, BY PRODUCT, 2023-2032 (KILOTONS) 166
      260. TABLE 259 LATIN AMERICA: MOLECULAR SIEVES MARKET, BY END-USE, 2023-2032 (USD MILLION) 166
      261. TABLE 260 LATIN AMERICA: MOLECULAR SIEVES MARKET, BY END-USE, 2023-2032 (KILOTONS) 167
      262. TABLE 261 BRAZIL: MOLECULAR SIEVES MARKET, BY TYPE, 2023-2032 (USD MILLION) 167
      263. TABLE 262 BRAZIL: MOLECULAR SIEVES MARKET, BY TYPE, 2023-2032 (KILOTONS) 168
      264. TABLE 263 BRAZIL: MOLECULAR SIEVES MARKET, BY SHPAE, 2023-2032 (USD MILLION) 168
      265. TABLE 264 BRAZIL: MOLECULAR SIEVES MARKET, BY SHAPE, 2023-2032 (KILOTONS) 168
      266. TABLE 265 BRAZIL: MOLECULAR SIEVES MARKET, BY PRODUCT, 2023-2032 (USD MILLION) 169
      267. TABLE 266 BRAZIL: MOLECULAR SIEVES MARKET, BY PRODUCT, 2023-2032 (KILOTONS) 169
      268. TABLE 267 BRAZIL: MOLECULAR SIEVES MARKET, BY END-USE, 2023-2032 (USD MILLION) 169
      269. TABLE 268 BRAZIL: MOLECULAR SIEVES MARKET, BY END-USE, 2023-2032 (KILOTONS) 170
      270. TABLE 269 MEXICO: MOLECULAR SIEVES

    Molecular Sieves Component Outlook (USD Billion, 2018-2032)

    4A

    3A

    5A

    13X

    Zeolite Y

    Others

    Molecular Sieves Shape Outlook (USD Billion, 2018-2032)

    Beads

    Pellets

    Powder

    Molecular Sieves Product Outlook (USD Billion, 2018-2032)

    Zeolites

    Activated Carbon

    Clay

    Others

    Molecular Sieves End-User Outlook (USD Billion, 2018-2032)

    Oil & Gas

    Automotive

    Packaging

    Coatings

    Wastewater Treatment

    Detergents

    Others

    Molecular Sieves Regional Outlook (USD Billion, 2018-2032)

    North America Outlook (USD Billion, 2018-2032)

    North America Molecular Sieves by Component

    4A

    3A

    5A

    13X

    Zeolite Y

    Others

    North America Molecular Sieves by Shape

    Beads

    Pellets

    Powder

    North America Molecular Sieves by Product

    Zeolites

    Activated Carbon

    Clay

    Others

    North America Molecular Sieves by End-User

    Oil & Gas

    Automotive

    Packaging

    Coatings

    Wastewater Treatment

    Detergents

    Others

    US Outlook (USD Billion, 2018-2032)

    US Molecular Sieves by Component

    4A

    3A

    5A

    13X

    Zeolite Y

    Others

    US Molecular Sieves by Shape

    Beads

    Pellets

    Powder

    US Molecular Sieves by Product

    Zeolites

    Activated Carbon

    Clay

    Others

    US Molecular Sieves by End-User

    Oil & Gas

    Automotive

    Packaging

    Coatings

    Wastewater Treatment

    Detergents

    Others

    Canada Outlook (USD Billion, 2018-2032)

    Canada Molecular Sieves by Component

    4A

    3A

    5A

    13X

    Zeolite Y

    Others

    Canada Molecular Sieves by Shape

    Beads

    Pellets

    Powder

    Canada Molecular Sieves by Product

    Zeolites

    Activated Carbon

    Clay

    Others

    Canada Molecular Sieves by End-User

    Oil & Gas

    Automotive

    Packaging

    Coatings

    Wastewater Treatment

    Detergents

    Others

    Europe Outlook (USD Billion, 2018-2032)

    Europe Molecular Sieves by Component

    4A

    3A

    5A

    13X

    Zeolite Y

    Others

    Europe Molecular Sieves by Shape

    Beads

    Pellets

    Powder

    Europe Molecular Sieves by Product

    Zeolites

    Activated Carbon

    Clay

    Others

    Europe Molecular Sieves by End-User

    Oil & Gas

    Automotive

    Packaging

    Coatings

    Wastewater Treatment

    Detergents

    Others

    Germany Outlook (USD Billion, 2018-2032)

    Germany Molecular Sieves by Component

    4A

    3A

    5A

    13X

    Zeolite Y

    Others

    Germany Molecular Sieves by Shape

    Beads

    Pellets

    Powder

    Beads

    Pellets

    Powder

    Germany Molecular Sieves by Product

    Zeolites

    Activated Carbon

    Clay

    Others

    Germany Molecular Sieves by End-User

    Oil & Gas

    Automotive

    Packaging

    Coatings

    Wastewater Treatment

    Detergents

    Others

    France Outlook (USD Billion, 2018-2032)

    France Molecular Sieves by Component

    4A

    3A

    5A

    13X

    Zeolite Y

    Others

    France Molecular Sieves by Shape

    Beads

    Pellets

    Powder

    France Molecular Sieves by Product

    Zeolites

    Activated Carbon

    Clay

    Others

    France Molecular Sieves by End-User

    Oil & Gas

    Automotive

    Packaging

    Coatings

    Wastewater Treatment

    Detergents

    Others

    UK Outlook (USD Billion, 2018-2032)

    UK Molecular Sieves by Component

    4A

    3A

    5A

    13X

    Zeolite Y

    Others

    UK Molecular Sieves by Shape

    Beads

    Pellets

    Powder

    UK Molecular Sieves by Product

    Zeolites

    Activated Carbon

    Clay

    Others

    UK Molecular Sieves by End-User

    Oil & Gas

    Automotive

    Packaging

    Coatings

    Wastewater Treatment

    Detergents

    Others

    Italy Outlook (USD Billion, 2018-2032)

    Italy Molecular Sieves by Component

    4A

    3A

    5A

    13X

    Zeolite Y

    Others

    Italy Molecular Sieves by Shape

    Beads

    Pellets

    Powder

    Italy Molecular Sieves by Product

    Zeolites

    Activated Carbon

    Clay

    Others

    Italy Molecular Sieves by End-User

    Oil & Gas

    Automotive

    Packaging

    Coatings

    Wastewater Treatment

    Detergents

    Others

    Spain Outlook (USD Billion, 2018-2032)

    Spain Molecular Sieves by Component

    4A

    3A

    5A

    13X

    Zeolite Y

    Others

    Spain Molecular Sieves by Shape

    Beads

    Pellets

    Powder

    Spain Molecular Sieves by Product

    Zeolites

    Activated Carbon

    Clay

    Others

    Spain Molecular Sieves by End-User

    Oil & Gas

    Automotive

    Packaging

    Coatings

    Wastewater Treatment

    Detergents

    Others

    Rest Of Europe Outlook (USD Billion, 2018-2032)

    Rest Of Europe Molecular Sieves by Component

    4A

    3A

    5A

    13X

    Zeolite Y

    Others

    Rest Of Europe Molecular Sieves by Shape

    Beads

    Pellets

    Powder

    Rest Of Europe Molecular Sieves by Product

    Zeolites

    Activated Carbon

    Clay

    Others

    Rest Of Europe Molecular Sieves by End-User

    Oil & Gas

    Automotive

    Packaging

    Coatings

    Wastewater Treatment

    Detergents

    Others

    Asia-Pacific Outlook (USD Billion, 2018-2032)

    Asia-Pacific Molecular Sieves by Component

    4A

    3A

    5A

    13X

    Zeolite Y

    Others

    Asia-Pacific Molecular Sieves by Shape

    Beads

    Pellets

    Powder

    Asia-Pacific Molecular Sieves by Product

    Zeolites

    Activated Carbon

    Clay

    Others

    Asia-Pacific Molecular Sieves by End-User

    Oil & Gas

    Automotive

    Packaging

    Coatings

    Wastewater Treatment

    Detergents

    Others

    China Outlook (USD Billion, 2018-2032)

    China Molecular Sieves by Component

    4A

    3A

    5A

    13X

    Zeolite Y

    Others

    China Molecular Sieves by Shape

    Beads

    Pellets

    Powder

    China Molecular Sieves by Product

    Zeolites

    Activated Carbon

    Clay

    Others

    China Molecular Sieves by End-User

    Oil & Gas

    Automotive

    Packaging

    Coatings

    Wastewater Treatment

    Detergents

    Others

    Japan Outlook (USD Billion, 2018-2032)

    Japan Molecular Sieves by Component

    4A

    3A

    5A

    13X

    Zeolite Y

    Others

    Japan Molecular Sieves by Shape

    Beads

    Pellets

    Powder

    Japan Molecular Sieves by Product

    Zeolites

    Activated Carbon

    Clay

    Others

    Japan Molecular Sieves by End-User

    Oil & Gas

    Automotive

    Packaging

    Coatings

    Wastewater Treatment

    Detergents

    Others

    India Outlook (USD Billion, 2018-2032)

    India Molecular Sieves by Component

    4A

    3A

    5A

    13X

    Zeolite Y

    Others

    India Molecular Sieves by Shape

    Beads

    Pellets

    Powder

    India Molecular Sieves by Product

    Zeolites

    Activated Carbon

    Clay

    Others

    India Molecular Sieves by End-User

    Oil & Gas

    Automotive

    Packaging

    Coatings

    Wastewater Treatment

    Detergents

    Others

    Australia Outlook (USD Billion, 2018-2032)

    Australia Molecular Sieves by Component

    4A

    3A

    5A

    13X

    Zeolite Y

    Others

    Australia Molecular Sieves by Shape

    Beads

    Pellets

    Powder

    Australia Molecular Sieves by Product

    Zeolites

    Activated Carbon

    Clay

    Others

    Australia Molecular Sieves by End-User

    Oil & Gas

    Automotive

    Packaging

    Coatings

    Wastewater Treatment

    Detergents

    Others

    Rest of Asia-Pacific Outlook (USD Billion, 2018-2032)

    Rest of Asia-Pacific Molecular Sieves by Component

    4A

    3A

    5A

    13X

    Zeolite Y

    Others

    Rest of Asia-Pacific Molecular Sieves by Shape

    Beads

    Pellets

    Powder

    Rest of Asia-Pacific Molecular Sieves by Product

    Zeolites

    Activated Carbon

    Clay

    Others

    Rest of Asia-Pacific Molecular Sieves by End-User

    Oil & Gas

    Automotive

    Packaging

    Coatings

    Wastewater Treatment

    Detergents

    Others

    Rest of the World Outlook (USD Billion, 2018-2032)

    Rest of the World Molecular Sieves by Component

    4A

    3A

    5A

    13X

    Zeolite Y

    Others

    Rest of the World Molecular Sieves by Shape

    Beads

    Pellets

    Powder

    Rest of the World Molecular Sieves by Product

    Zeolites

    Activated Carbon

    Clay

    Others

    Rest of the World Molecular Sieves by End-User

    Oil & Gas

    Automotive

    Packaging

    Coatings

    Wastewater Treatment

    Detergents

    Others

    Middle East Outlook (USD Billion, 2018-2032)

    Middle East Molecular Sieves by Component

    4A

    3A

    5A

    13X

    Zeolite Y

    Others

    Middle East Molecular Sieves by Shape

    Beads

    Pellets

    Powder

    Middle East Molecular Sieves by Product

    Zeolites

    Activated Carbon

    Clay

    Others

    Middle East Molecular Sieves by End-User

    Oil & Gas

    Automotive

    Packaging

    Coatings

    Wastewater Treatment

    Detergents

    Others

    Africa Outlook (USD Billion, 2018-2032)

    Africa Molecular Sieves by Component

    4A

    3A

    5A

    13X

    Zeolite Y

    Others

    Africa Molecular Sieves by Shape

    Beads

    Pellets

    Powder

    Africa Molecular Sieves by Product

    Zeolites

    Activated Carbon

    Clay

    Others

    Africa Molecular Sieves by End-User

    Oil & Gas

    Automotive

    Packaging

    Coatings

    Wastewater Treatment

    Detergents

    Others

    Latin America Outlook (USD Billion, 2018-2032)

    Latin America Molecular Sieves by Component

    4A

    3A

    5A

    13X

    Zeolite Y

    Others

    Latin America Molecular Sieves by Shape

    Beads

    Pellets

    Powder

    Latin America Molecular Sieves by Product

    Zeolites

    Activated Carbon

    Clay

    Others

    Latin America Molecular Sieves by End-User

    Oil & Gas

    Automotive

    Packaging

    Coatings

    Wastewater Treatment

    Detergents

    Others

    Infographic

    Free Sample Request

    Kindly complete the form below to receive a free sample of this Report

    Get Free Sample

    Customer Strories

    “I am very pleased with how market segments have been defined in a relevant way for my purposes (such as "Portable Freezers & refrigerators" and "last-mile"). In general the report is well structured. Thanks very much for your efforts.”

    Victoria Milne

    Founder
    Case Study
    Chemicals and Materials