Segmentation Quick Reference
| Dimension | Sub-Segments | Dominant Segment | Fastest Growing Segment |
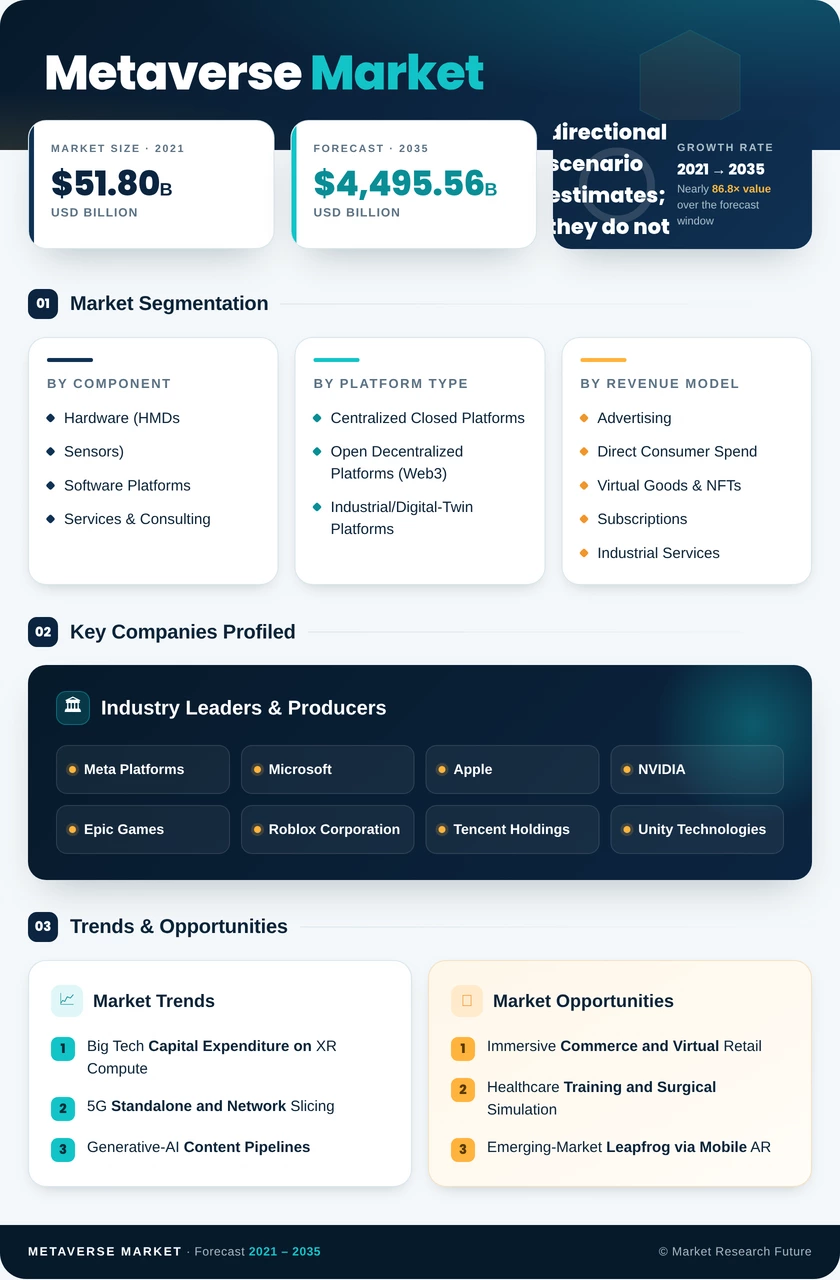
| By Component | Hardware (HMDs, Sensors); Software Platforms; Services & Consulting | Hardware (HMDs, Sensors) | Services & Consulting |
| By Platform Type | Centralized Closed Platforms; Open Decentralized Platforms (Web3); Industrial/Digital-Twin Platforms | Centralized Closed Platforms | Industrial/Digital-Twin Platforms |
| By Revenue Model | Advertising; Direct Consumer Spend; Virtual Goods & NFTs; Subscriptions; Industrial Services | Advertising | Virtual Goods & NFTs |
| By End-User Industry | Gaming & Esports; Media & Live Entertainment; Corporate/Industrial; Education & Training; Healthcare; Retail & E-Commerce | Gaming & Esports | Corporate/Industrial |
Market Segmentation Overview
By Component
| Sub-Segment | Key Trend |
| Hardware (HMDs, Sensors) | Falling BOM costs and pancake-lens adoption are driving consumer upgrade cycles. |
| Software Platforms | Enterprise licensing expanding as spatial-computing SDKs mature. |
| Services & Consulting | System integrators building dedicated metaverse practices for complex deployments |
Hardware currently leads the Metaverse Market by share, supported by competitive headset pricing from Meta, Apple, and Sony. Services and consulting are the fastest-growing sub-segment as enterprise customers require end-to-end integration with legacy IT infrastructure.
By Platform Type
| Sub-Segment | Key Trend |
| Centralized Closed Platforms | Dominant for consumer audiences; brand-safety tools attract advertising budgets |
| Open Decentralized Platforms (Web3) | Community governance and token-based economies are gaining developer traction. |
| Industrial/Digital-Twin Platforms | Highest growth driven by measurable ROI in manufacturing and logistics |
Centralized platforms maintain revenue leadership through content control and ad monetization maturity. Industrial and digital-twin platforms are accelerating as predictive-maintenance and virtual-commissioning use cases deliver quantifiable cost savings.
By Revenue Model
| Sub-Segment | Key Trend |
| Advertising | Largest share; in-world brand placements and programmatic spatial ads |
| Direct Consumer Spend | Premium avatar skins, virtual real estate, and event tickets |
| Virtual Goods & NFTs | Creator-economy monetisation is driving the fastest CAGR. |
| Subscriptions | Recurring-revenue stability for platform operators |
| Industrial Services | High-margin B2B simulation and SaaS contracts |
Advertising dominates the current Metaverse Market revenue, but virtual goods and industrial services offer higher growth trajectories and superior margin profiles over the forecast period.
By End-User Industry
| Sub-Segment | Key Trend |
| Gaming & Esports | Persistent social worlds with 400M+ MAU anchoring consumer adoption |
| Media & Live Entertainment | Virtual concerts and immersive broadcasting are expanding audience reach |
| Corporate/Industrial | Training, prototyping, and remote operations are driving the fastest adoption. |
| Education & Training | Government-backed upskilling programmes fuelling institutional demand |
| Healthcare | Surgical simulation and therapeutic VR are reducing procedural errors. |
| Retail & E-Commerce | Virtual try-on and showroom experiences are lifting conversion rates. |
Gaming and esports remain the largest Metaverse Market end-user segment by revenue. At the same time, corporate and industrial users represent the fastest-growing vertical as procurement shifts from pilot to production deployments.