Lysine Market Summary
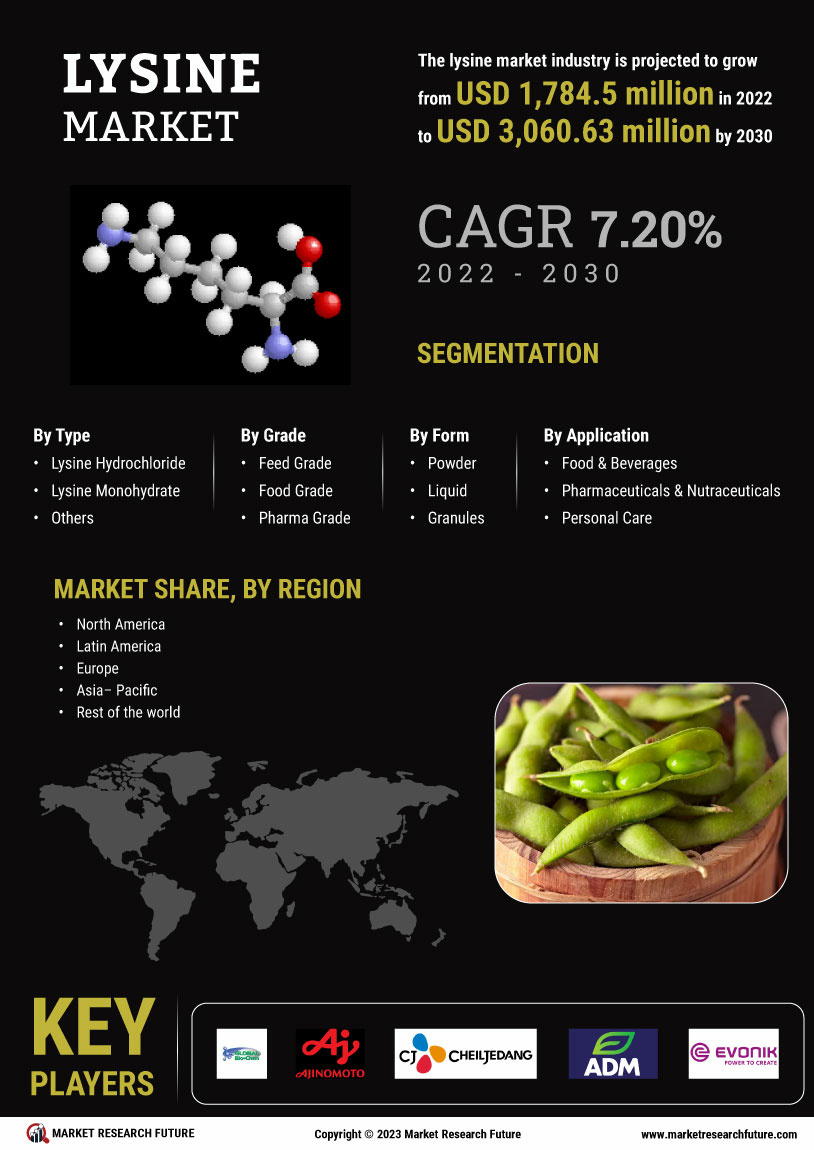
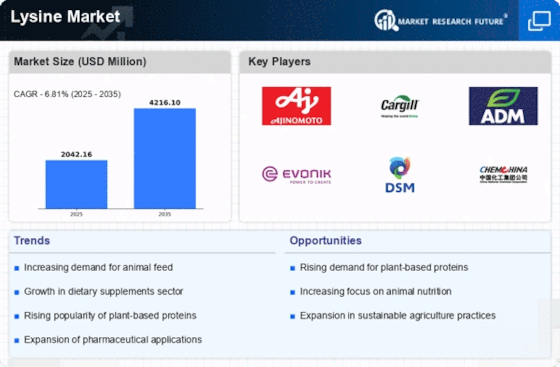
As per MRFR Analysis, the global lysine market was valued at USD 1,908.99 million in 2023 and is projected to reach USD 3,459.81 million by 2032, growing at a CAGR of 6.81% from 2024 to 2032. The market is driven by health benefits associated with lysine consumption and its increasing use in animal feeds. The rise in protein deficiency awareness and the growing demand for meat products are also significant contributors to market growth. The Asia-Pacific region accounted for USD 787.95 million in 2021, with China being the largest market share holder. Major players are focusing on R&D and strategic initiatives to expand their market presence.
Key Market Trends & Highlights
Key trends driving the lysine market include rising health awareness and increased meat consumption.
- Lysine market size in 2023: USD 1,908.99 million.
- Projected market size by 2032: USD 3,459.81 million.
- CAGR from 2024 to 2032: 6.81%.
- Asia-Pacific market share in 2021: USD 787.95 million.
Market Size & Forecast
2023 Market Size: USD 1,908.99 million
2024 Market Size: USD 2,042.16 million
2032 Market Size: USD 3,459.81 million
CAGR (2024-2032): 6.81%
Largest Regional Market in 2021: Asia-Pacific.
Major Players
Key players include Evonik Industries, Ajinomoto Co. Ltd., Cheil Jedang Corp, Archer Daniel Midland (ADM), and others.

Source: Secondary Research, Primary Research, MRFR Database and Analyst Review
Lysine Market Trends
Rise in risk factors associated with protein deficiency boosts the market growth
The growing prevalence of various health issues associated with protein deficiency is a key factor driving market revenue growth. Additionally, consumers around the world are becoming more aware of the healthy eating habits. A deficiency of protein, for example, can lead to Kwashiorkor and Marasmus. There is a significant risk of extreme emaciation and a prolonged negative energy balance, which can lead to fat exhaustion and muscle wasting, affecting many people's health. The World Health Organization estimates that 149.2 million children under the age of 5 are stunted and 45.4 million are wasted ly in 2020. A lack of protein synthesis and increased tissue breakdown also compromise the functionality of organs such as the heart, lungs, kidneys, etc. According to the World Economic Forum, the 26% of the population get the insufficient nutrients.
Figure 1: Nutritional divides of the  population
Further, a decrease in the supply and synthesis of protein compromises the immune system, causing a reduced immune response and a greater risk of infection. A defect in cellular proliferation leads to the malabsorption of other important nutrients, particularly in the intestinal mucosa.
Additionally, all developed and developing countries are experiencing an increase in meat consumption, contributing to the growth in market share. It is used in cattle breeding to increase protein content in beef, chicken, and eggs. It is also used as a protein synthesizer in animal feed. Using nitrous dioxide excreted in the process does not harm the environment because it is a cost-effective and efficient substitute for costly feed for farmers and animals. Moreover, in the past, it has driven the market as an herbal supplement, which will enhance the market CAGR across the globe in the recent years
With the hectic lifestyle and growing consumer knowledge, protein supplements are becoming more popular. Calcium absorption, muscle growth, and injury healing are all improved by taking these supplements. Over the past few years, its consumption has grown to improve body enzymes. These factors are driving the growth of the lysine market revenue.
Lysine Market Segment Insights
Lysine Type Insights
The lysine market segmentation, based on lysine type, includes lysine hydrochloride, lysine monohydrate, and others. The lysine hydrochloride segment held the majority share in 2021 with respect to the  lysine market revenue. A revolutionary white-colored powder, it is used to heal the human body and provide it with essential nutrition. As part of many metabolic processes, it is crucial in animal nutrition. ly, the market is expected to grow in tandem with a growing population and an increase in meat consumption. It is estimated that by the year 2050, the  population will increase by about 35% to 9.74 billion.
Lysine Grade Insights
The lysine market segmentation, based on grade, includes feed grade, food grade, and pharma grade. The feed segment dominated the market in 2021 and is projected to be the faster-growing segment in 2030. This segment contributed 92.5% to the total volume from 2022 to 2030. Because it is a cheaper and more efficient alternative to expensive crude proteins like soybeans and corn, makes a good choice. Hence, rising applications of metal material implants positively impact the market growth.
Lysine Form Insights
The lysine market data has been segmented by form into powder, liquid, and granules. The powder segment dominated the market in 2021. As a treatment for herpes simplex virus-induced mouth and genital lesions, powder is commonly used. Recovery from herpes infection can be speeded up with. Moreover, it is also used in curing shingles caused by herpes zoster viruses. The human body can't produce, so dietary or oral supplements are needed.
Figure 2: Â Lysine Market, by Form, 2021 & 2030 (USD Million)
Source: Secondary Research, Primary Research, MRFR Database and Analyst Review
Lysine Application Insights
Based on application, the lysine industry has been segmented into food & beverages, pharmaceuticals & nutraceuticals, personal care, and animal feed. Food & beverages held the largest segment share in 2021; owing to the increased health awareness and aging population, demand for food and nutritional supplements is expected to increase, boosting lysine market growth. It's expected that athletes will continue to demand sports nutrition supplements as a major driving force for this market segment.
The second fastest-growing segment in the lysine industry is pharmaceuticals & nutraceuticals. Strategic alliances, mergers, and acquisitions drive the market revenue growth in this segment.
November 2021:Â It was announced on 8 November 2021 that CJ Cheiljedang, the leading Korean food culture company, would acquire Batavia Biosciences, a science-based Contract Development and Manufacturing Organization (CDMO) offering personalized services and fully supporting all stages of biopharmaceutical development.
Lysine Regional Insights
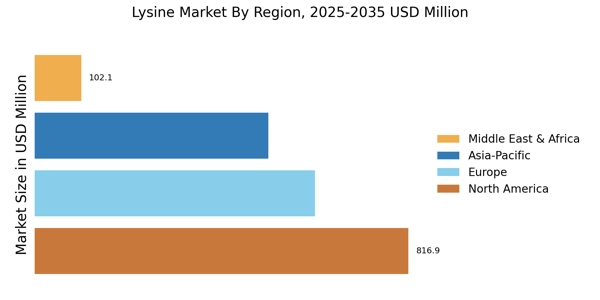
By region, the study provides market insights into North America, Europe, Asia-Pacific and the Rest of the World. Asia Pacific lysine market share accounted for USD 787.95 million in 2021 and is expected to exhibit a significant CAGR growth during the study period. Market revenue growth in this region is primarily driven by rapid urban lifestyle change and growing demand for ready-to-eat meals. With the growing promotion of the health benefits of animal proteins and the rapid development of new products in the region, the Chinese market accounted for the largest regional share.
Further, the major countries studied in the market report are: The U.S, Canada, Germany, France, UK, Italy, Spain, China, Japan, India, Australia, South Korea, and Brazil.
Figure 3: Â LYSINE MARKET SHARE BY REGION 2021 (%)
Source: Secondary Research, Primary Research, MRFR Database and Analyst Review
North American lysine market accounts for the second-largest market share due to growing demand for online product availability, and delivery is a major factor driving market revenue growth. The online shopping experience among the population has been significantly streamlined thanks to e-commerce platforms. Further, the U.S. lysine market held the largest market share, and the Canada lysine industry was the fastest growing market in the North American region.
Europe lysine market accounts for the third-largest market share due to Increased consumer demand for animal-derived products, significant investments to improve living standards. Further, the Germany lysine market held the largest market share, and the U.K. lysine was the fastest growing market in the North American region.
Lysine Key Market Players & Competitive Insights
Major market players are spending a lot on R&D to increase their product lines, which will help the lysine industry grow even more. Market participants are also taking various strategic initiatives to grow their worldwide footprint, with key market developments such as new product launches, contractual agreements, mergers and acquisitions, increased investments, and collaboration with other organizations. Competitors in the lysine industry must offer cost-effective items to expand and survive in an increasingly competitive and rising market environment.
One of the primary business strategies manufacturers adopt in the  lysine industry to benefit clients and expand the market sector is manufacturing locally to reduce operating costs. The lysine industry has provided medicine with some of the most significant benefits in recent years. The lysine market major player such as Evonik Industries, Ajinomoto Co. Ltd., Cheil Jedang Corp, Archer Daniel Midland (ADM) and others are working on expanding the market demand by investing in research and development activities.
Evonik Industries (Germany) is a specialty chemical manufacturer, Evonik Industries AG produces a variety of chemicals. In addition to consumer goods, animal nutrition, and pharmaceutical products, the company also offers medical supplies. For instance, in January 2020, with its AvailOm omega-3 product, Evonik demonstrated superior bioavailability compared with a commercially available oil-based ethyl-ester formulation. As a result of Evonik's novel technology, omega-3 fatty acids are significantly better absorbed in the body when combined with the amino acid.
Also, Archer Daniel Midland (ADM) (US) here agricultural commodities and products are procured, transported, stored, and merchandised by Archer-Daniels-Midland Company. The company processes oilseeds, corn, milo, oats, barley, peanuts, and wheat as part of its operations. Additionally, Archer-Daniels-Midland produces food or feed ingredients and products with two end uses. For instance, in July 2020, NutriPass L, an encapsulated lysine supplement, is rumen-stable and intestinally accessible to cows, according to ADM, a  leader in animal nutrition. NutriPass allows producers to provide a balanced, cost-effective diet by reducing higher-cost protein ingredients in the ration. Nutritionists can limit nutrient waste in rations with the new supplement, which supports optimal milk production and animal growth.
Key Companies in the Lysine market include
Lysine Industry Developments
July 2020:Â NutriPass L, a rumen-stable and intestinally available lysine supplement developed by ADM, are available to cows now. NutriPass L allows producers to provide a balanced, cost-effective diet by reducing higher-cost protein ingredients in the ration. Nutritionists can limit nutrient waste in rations with the new supplement, which supports optimal milk production and animal growth.
May 2020:Â As part of a series of financing led by renowned life science investors OrbiMed and Third Rock Ventures, Terramoto Biosciences, a San Francisco, California-based biotechnology company, has raised USD 75 million to develop optimized medicines for its consumers. With this funding, Terremoto can develop a lysine-targeted covalency platform, which allows them to target various proteins, including validated receptors.
Lysine Market Segmentation
Lysine Type Outlook
Lysine Grade Outlook
Lysine Form Outlook
Lysine Application Outlook
Lysine Regional Outlook
Report Attribute/Metric |
Details |
Market Size 2023 |
USD 1,908.90 million |
Market Size 2024 |
USD 2,042.16 million |
Market Size 2032 |
USD 3,459.81 million |
Compound Annual Growth Rate (CAGR) |
6.81% (2024-2032) |
Base Year |
2023 |
Market Forecast Period |
2024-2032 |
Historical Data |
2022 & 2024 |
Market Forecast Units |
Value (USD Billion) |
Report Coverage |
Revenue Forecast, Market Competitive Landscape, Growth Factors, and Trends |
Segments Covered |
Product Type, Grade, Form, Application, and Region |
Geographies Covered |
North America, Europe, Asia Pacific, and the Rest of the World |
Countries Covered |
The U.S, Canada, Germany, France, the UK, Italy, Spain, China, Japan, India, Australia, South Korea, and Brazil |
Key Companies Profiled |
Global Bio-Chem Technology Group Company Limited, Ajinomoto Co. Ltd., Cheil Jedang Corp, Archer Daniel Midland (ADM), Evonik Industries and COFCO Biochemical (Anhui) Co. Ltd. |
Key Market Opportunities |
As the demand for functional foods increases, the livestock sector develops, and animal-based protein consumption surges, new opportunities are set to emerge. |
Key Market Dynamics |
Consumption of meat is rising, the cattle industry is expanding, and functional food ingredients are in high demand. A rise in agricultural production, a rise in consumer awareness of protein's benefits, and a shift toward healthy diets among consumers. |
Lysine Market Highlights:
Frequently Asked Questions (FAQ):
The lysine market size was valued at USD 1,908.99 million in 2023.
The market is projected to grow at a CAGR of 6.81% during the forecast period, 2024-2032.
Asia Pacific had the largest share of the market
The key players in the market are Bio-Chem Technology Group Company Limited, Ajinomoto Co. Ltd., Cheil Jedang Corp, Archer Daniel Midland (ADM), Evonik Industries, COFCO Biochemical (Anhui) Co. Ltd and Changchun Dacheng Group.
The lysine hydrochloride category dominated the market in 2022.
The feed grade had the largest share in the market.
Table of Contents
1. EXECUTIVE SUMMARY
2. INDUSTRY INTRODUCTION
2.1. Industry Definition
2.2. Scope of the Study
2.2.1. Research Objectives
2.2.2. Assumptions & Limitations
2.3. Industry Structure
3. INDUSTRY RESEARCH METHODOLOGY
3.1. Research Process
3.2. Secondary Research
3.3. Primary Research
3.4. Forecast Model
4. INDUSTRY LANDSCAPE
4.1. Supply Chain Analysis
4.1.1. Raw Material Suppliers
4.1.2. Manufacturers/Producers
4.1.3. Distributors/Retailers/Wholesalers/E-Commerce
4.1.4. End Users
4.2. Porter’s Five Forces Analysis
4.2.1. Threat of New Entrants
4.2.2. Bargaining Power of Buyers
4.2.3. Bargaining Power of Suppliers
4.2.4. Threat of Substitutes
4.2.5. Internal Rivalry
5. INDUSTRY DYNAMICS OF THE GLOBAL LYSINE INDUSTRY
5.1. Introduction
5.2. Drivers
5.3. Restraints
5.4. Opportunities
5.5. Challenges
6. GLOBAL LYSINE INDUSTRY , BY TYPE
6.1. Introduction
6.2. Lysine Hydrochloride
6.2.1. Industry Estimates & Forecast, 2024-2032
6.2.2. Industry Estimates & Forecast, by Region, 2024-2032
6.3. Lysine Monohydrate
6.3.1. Industry Estimates & Forecast, 2024-2032
6.3.2. Industry Estimates & Forecast, by Region, 2024-2032
6.4. Others
6.4.1. Industry Estimates & Forecast, 2024-2032
6.4.2. Industry Estimates & Forecast, by Region, 2024-2032
7. GLOBAL LYSINE INDUSTRY , BY GRADE
7.1. Introduction
7.2. Feed Grade
7.2.1. Industry Estimates & Forecast, 2024-2032
7.2.2. Industry Estimates & Forecast, by Region, 2024-2032
7.3. Food Grade
7.3.1. Industry Estimates & Forecast, 2024-2032
7.3.2. Industry Estimates & Forecast, by Region, 2024-2032
7.4. Pharma Grade
7.4.1. Industry Estimates & Forecast, 2024-2032
7.4.2. Industry Estimates & Forecast, by Region, 2024-2032
8. GLOBAL LYSINE INDUSTRY , BY FORM
8.1. Introduction
8.2. Powder
8.2.1. Industry Estimates & Forecast, 2024-2032
8.2.2. Industry Estimates & Forecast, by Region, 2024-2032
8.3. Liquid
8.3.1. Industry Estimates & Forecast, 2024-2032
8.3.2. Industry Estimates & Forecast, by Region, 2024-2032
8.4. Granules
8.4.1. Industry Estimates & Forecast, 2024-2032
8.4.2. Industry Estimates & Forecast, by Region, 2024-2032
9. GLOBAL LYSINE INDUSTRY , BY APPLICATION
9.1. Introduction
9.2. Food & Beverages
9.2.1. Industry Estimates & Forecast, 2024-2032
9.2.2. Industry Estimates & Forecast, by Region, 2024-2032
9.3. Pharmaceuticals & Nutraceuticals
9.3.1. Industry Estimates & Forecast, 2024-2032
9.3.2. Industry Estimates & Forecast, by Region, 2024-2032
9.4. Personal Care
9.4.1. Industry Estimates & Forecast, 2024-2032
9.4.2. Industry Estimates & Forecast, by Region, 2024-2032
9.5. Animal Feed
9.5.1. Industry Estimates & Forecast, 2024-2032
9.5.2. Industry Estimates & Forecast, by Region, 2024-2032
9.5.3. Poultry
9.5.3.1. Industry Estimates & Forecast, 2024-2032
9.5.3.2. Industry Estimates & Forecast, by Region, 2024-2032
9.5.4. Swine
9.5.4.1. Industry Estimates & Forecast, 2024-2032
9.5.4.2. Industry Estimates & Forecast, by Region, 2024-2032
9.5.5. Ruminants
9.5.5.1. Industry Estimates & Forecast, 2024-2032
9.5.5.2. Industry Estimates & Forecast, by Region, 2024-2032
9.5.6. Aquafeed
9.5.6.1. Industry Estimates & Forecast, 2024-2032
9.5.6.2. Industry Estimates & Forecast, by Region, 2024-2032
9.5.7. Others
9.5.7.1. Industry Estimates & Forecast, 2024-2032
9.5.7.2. Industry Estimates & Forecast, by Region, 2024-2032
10. GLOBAL LYSINE INDUSTRY , BY REGION
10.1. Introduction
10.2. North America
10.2.1. Industry Estimates & Forecast, 2024-2032
10.2.2. Industry Estimates & Forecast, by Type, 2024-2032
10.2.3. Industry Estimates & Forecast, by Grade, 2024-2032
10.2.4. Industry Estimates & Forecast, by Form, 2024-2032
10.2.5. Industry Estimates & Forecast, by Application, 2024-2032
10.2.6. Industry Estimates & Forecast, by Country, 2024-2032
10.2.7. US
10.2.7.1. Industry Estimates & Forecast, by Type, 2024-2032
10.2.7.2. Industry Estimates & Forecast, by Grade, 2024-2032
10.2.7.3. Industry Estimates & Forecast, by Form, 2024-2032
10.2.7.4. Industry Estimates & Forecast, by Application, 2024-2032
10.2.8. Canada
10.2.8.1. Industry Estimates & Forecast, by Type, 2024-2032
10.2.8.2. Industry Estimates & Forecast, by Grade, 2024-2032
10.2.8.3. Industry Estimates & Forecast, by Form, 2024-2032
10.2.8.4. Industry Estimates & Forecast, by Application, 2024-2032
10.2.9. Mexico
10.2.9.1. Industry Estimates & Forecast, by Type, 2024-2032
10.2.9.2. Industry Estimates & Forecast, by Grade, 2024-2032
10.2.9.3. Industry Estimates & Forecast, by Form, 2024-2032
10.2.9.4. Industry Estimates & Forecast, by Application, 2024-2032
10.3. Europe
10.3.1. Industry Estimates & Forecast, 2024-2032
10.3.2. Industry Estimates & Forecast, by Type, 2024-2032
10.3.3. Industry Estimates & Forecast, by Grade, 2024-2032
10.3.4. Industry Estimates & Forecast, by Form, 2024-2032
10.3.5. Industry Estimates & Forecast, by Application, 2024-2032
10.3.6. Industry Estimates & Forecast, by Country, 2024-2032
10.3.7. Germany
10.3.7.1. Industry Estimates & Forecast, by Type, 2024-2032
10.3.7.2. Industry Estimates & Forecast, by Grade, 2024-2032
10.3.7.3. Industry Estimates & Forecast, by Form, 2024-2032
10.3.7.4. Industry Estimates & Forecast, by Application, 2024-2032
10.3.8. UK
10.3.8.1. Industry Estimates & Forecast, by Type, 2024-2032
10.3.8.2. Industry Estimates & Forecast, by Grade, 2024-2032
10.3.8.3. Industry Estimates & Forecast, by Form, 2024-2032
10.3.8.4. Industry Estimates & Forecast, by Application, 2024-2032
10.3.9. France
10.3.9.1. Industry Estimates & Forecast, by Type, 2024-2032
10.3.9.2. Industry Estimates & Forecast, by Grade, 2024-2032
10.3.9.3. Industry Estimates & Forecast, by Form, 2024-2032
10.3.9.4. Industry Estimates & Forecast, by Application, 2024-2032
10.3.10. Spain
10.3.10.1. Industry Estimates & Forecast, by Type, 2024-2032
10.3.10.2. Industry Estimates & Forecast, by Grade, 2024-2032
10.3.10.3. Industry Estimates & Forecast, by Form, 2024-2032
10.3.10.4. Industry Estimates & Forecast, by Application, 2024-2032
10.3.11. Italy
10.3.11.1. Industry Estimates & Forecast, by Type, 2024-2032
10.3.11.2. Industry Estimates & Forecast, by Grade, 2024-2032
10.3.11.3. Industry Estimates & Forecast, by Form, 2024-2032
10.3.11.4. Industry Estimates & Forecast, by Application, 2024-2032
10.3.12. Rest of Europe
10.3.12.1. Industry Estimates & Forecast, by Type, 2024-2032
10.3.12.2. Industry Estimates & Forecast, by Grade, 2024-2032
10.3.12.3. Industry Estimates & Forecast, by Form, 2024-2032
10.3.12.4. Industry Estimates & Forecast, by Application, 2024-2032
10.4. Asia-Pacific
10.4.1. Industry Estimates & Forecast, 2024-2032
10.4.2. Industry Estimates & Forecast, by Type, 2024-2032
10.4.3. Industry Estimates & Forecast, by Grade, 2024-2032
10.4.4. Industry Estimates & Forecast, by Form, 2024-2032
10.4.5. Industry Estimates & Forecast, by Application, 2024-2032
10.4.6. Industry Estimates & Forecast, by Country, 2024-2032
10.4.7. China
10.4.7.1. Industry Estimates & Forecast, by Type, 2024-2032
10.4.7.2. Industry Estimates & Forecast, by Grade, 2024-2032
10.4.7.3. Industry Estimates & Forecast, by Form, 2024-2032
10.4.7.4. Industry Estimates & Forecast, by Application, 2024-2032
10.4.8. Japan
10.4.8.1. Industry Estimates & Forecast, by Type, 2024-2032
10.4.8.2. Industry Estimates & Forecast, by Grade, 2024-2032
10.4.8.3. Industry Estimates & Forecast, by Form, 2024-2032
10.4.8.4. Industry Estimates & Forecast, by Application, 2024-2032
10.4.9. India
10.4.9.1. Industry Estimates & Forecast, by Type, 2024-2032
10.4.9.2. Industry Estimates & Forecast, by Grade, 2024-2032
10.4.9.3. Industry Estimates & Forecast, by Form, 2024-2032
10.4.9.4. Industry Estimates & Forecast, by Application, 2024-2032
10.4.10. Australia & New Zealand
10.4.10.1. Industry Estimates & Forecast, by Type, 2024-2032
10.4.10.2. Industry Estimates & Forecast, by Grade, 2024-2032
10.4.10.3. Industry Estimates & Forecast, by Form, 2024-2032
10.4.10.4. Industry Estimates & Forecast, by Application, 2024-2032
10.4.11. Rest of Asia-Pacific
10.4.11.1. Industry Estimates & Forecast, by Type, 2024-2032
10.4.11.2. Industry Estimates & Forecast, by Grade, 2024-2032
10.4.11.3. Industry Estimates & Forecast, by Form, 2024-2032
10.4.11.4. Industry Estimates & Forecast, by Application, 2024-2032
10.5. Rest of the World
10.5.1. Industry Estimates & Forecast, 2024-2032
10.5.2. Industry Estimates & Forecast, by Type, 2024-2032
10.5.3. Industry Estimates & Forecast, by Grade, 2024-2032
10.5.4. Industry Estimates & Forecast, by Form, 2024-2032
10.5.5. Industry Estimates & Forecast, by Application, 2024-2032
10.5.6. Industry Estimates & Forecast, by Region, 2024-2032
10.5.7. South America
10.5.7.1. Industry Estimates & Forecast, by Type, 2024-2032
10.5.7.2. Industry Estimates & Forecast, by Grade, 2024-2032
10.5.7.3. Industry Estimates & Forecast, by Form, 2024-2032
10.5.7.4. Industry Estimates & Forecast, by Application, 2024-2032
10.5.8. Middle East
10.5.8.1. Industry Estimates & Forecast, by Type, 2024-2032
10.5.8.2. Industry Estimates & Forecast, by Grade, 2024-2032
10.5.8.3. Industry Estimates & Forecast, by Form, 2024-2032
10.5.8.4. Industry Estimates & Forecast, by Application, 2024-2032
10.5.9. Africa
10.5.9.1. Industry Estimates & Forecast, by Type, 2024-2032
10.5.9.2. Industry Estimates & Forecast, by Grade, 2024-2032
10.5.9.3. Industry Estimates & Forecast, by Form, 2024-2032
10.5.9.4. Industry Estimates & Forecast, by Application, 2024-2032
11. COMPETITIVE LANDSCAPE
11.1. Introduction
11.2. Industry Strategy
11.3. Key Development Analysis
(Expansions/Mergers & Acquisitions/Joint Ventures/New Product Developments/Agreements/Investments)
12. COMPANY PROFILES
12.1. Global Bio-chem Technology Group Company Limited
12.1.1. Company Overview
12.1.2. Financial Updates
12.1.3. Product/Business Segment Overview
12.1.4. Strategies
12.1.5. Key Developments
12.1.6. SWOT Analysis
12.2. Ajinomoto Co., Ltd.
12.2.1. Company Overview
12.2.2. Financial Updates
12.2.3. Product/Business Segment Overview
12.2.4. Strategies
12.2.5. Key Developments
12.2.6. SWOT Analysis
12.3. Cheil Jedang Corp
12.3.1. Company Overview
12.3.2. Financial Updates
12.3.3. Product/Business Segment Overview
12.3.4. Strategies
12.3.5. Key Developments
12.3.6. SWOT Analysis
12.4. Archer Daniel Midland (ADM)
12.4.1. Company Overview
12.4.2. Financial Updates
12.4.3. Product/Business Segment Overview
12.4.4. Strategies
12.4.5. Key Developments
12.4.6. SWOT Analysis
12.5. Evonik Industries
12.5.1. Company Overview
12.5.2. Financial Updates
12.5.3. Product/Business Segment Overview
12.5.4. Strategies
12.5.5. Key Developments
12.5.6. SWOT Analysis
12.6. COFCO Biochemical (Anhui) Co. Ltd.
12.6.1. Company Overview
12.6.2. Financial Updates
12.6.3. Product/Business Segment Overview
12.6.4. Strategies
12.6.5. Key Developments
12.6.6. SWOT Analysis
12.7. Shandong Shaouguang Juneng Golden Corn Co. Ltd.
12.7.1. Company Overview
12.7.2. Financial Updates
12.7.3. Product/Business Segment Overview
12.7.4. Strategies
12.7.5. Key Developments
12.7.6. SWOT Analysis
12.8. Changchun Dacheng Group
12.8.1. Company Overview
12.8.2. Financial Updates
12.8.3. Product/Business Segment Overview
12.8.4. Strategies
12.8.5. Key Developments
12.8.6. SWOT Analysis
12.9. Sunrise Nutrachem Group
12.9.1. Company Overview
12.9.2. Financial Updates
12.9.3. Product/Business Segment Overview
12.9.4. Strategies
12.9.5. Key Developments
12.9.6. SWOT Analysis
12.10. KYOWA HAKKO BIO CO., LTD.
12.10.1. Company Overview
12.10.2. Financial Updates
12.10.3. Product/Business Segment Overview
12.10.4. Strategies
12.10.5. Key Developments
12.10.6. SWOT Analysis
13. CONCLUSION
LIST OF TABLES
TABLE 1 Global Lysine Industry , by Region, 2024-2032 (USD Million)
TABLE 3 Global Lysine Industry , by Type, 2024-2032 (USD Million)
TABLE 4 Global Lysine Industry , by Grade, 2024-2032 (USD Million)
TABLE 5 Global Lysine Industry , by Form, 2024-2032 (USD Million)
TABLE 6 Global Lysine Industry , by Application, 2024-2032 (USD Million)
TABLE 7 North America: Lysine Industry , by Country, 2024-2032 (USD Million)
TABLE 8 North America: Lysine Industry , by Type, 2024-2032 (USD Million)
TABLE 9 North America: Lysine Industry , by Grade, 2024-2032 (USD Million)
TABLE 10 North America: Lysine Industry , by Form, 2024-2032 (USD Million)
TABLE 11 North America: Lysine Industry , by Application, 2024-2032 (USD Million)
TABLE 9 US: Lysine Industry , by Type, 2024-2032 (USD Million)
TABLE 10 US: Lysine Industry , by Grade, 2024-2032 (USD Million)
TABLE 11 US: Lysine Industry , by Form, 2024-2032 (USD Million)
TABLE 12 US: Lysine Industry , by Application, 2024-2032 (USD Million)
TABLE 13 Canada: Lysine Industry , by Type, 2024-2032 (USD Million)
TABLE 14 Canada: Lysine Industry , by Grade, 2024-2032 (USD Million)
TABLE 15 Canada: Lysine Industry , by Form, 2024-2032 (USD Million)
TABLE 16 Canada: Lysine Industry , by Application, 2024-2032 (USD Million)
TABLE 17 Mexico: Lysine Industry , by Type, 2024-2032 (USD Million)
TABLE 18 Mexico: Lysine Industry , by Grade, 2024-2032 (USD Million)
TABLE 19 Mexico: Lysine Industry , by Form, 2024-2032 (USD Million)
TABLE 20 Mexico: Lysine Industry , by Application, 2024-2032 (USD Million)
TABLE 21 Europe: Lysine Industry , by Country, 2024-2032 (USD Million)
TABLE 22 Europe: Lysine Industry , by Type, 2024-2032 (USD Million)
TABLE 23 Europe: Lysine Industry , by Grade, 2024-2032 (USD Million)
TABLE 24 Europe: Lysine Industry , by Form, 2024-2032 (USD Million)
TABLE 25 Europe: Lysine Industry , by Application, 2024-2032 (USD Million)
TABLE 26 Germany: Lysine Industry , by Type, 2024-2032 (USD Million)
TABLE 27 Germany: Lysine Industry , by Grade, 2024-2032 (USD Million)
TABLE 28 Germany: Lysine Industry , by Form, 2024-2032 (USD Million)
TABLE 29 Germany: Lysine Industry , by Application, 2024-2032 (USD Million)
TABLE 30 France: Lysine Industry , by Type, 2024-2032 (USD Million)
TABLE 31 France: Lysine Industry , by Grade, 2024-2032 (USD Million)
TABLE 32 France: Lysine Industry , by Form, 2024-2032 (USD Million)
TABLE 33 France: Lysine Industry , by Application, 2024-2032 (USD Million)
TABLE 34 Italy: Lysine Industry , by Type, 2024-2032 (USD Million)
TABLE 35 Italy: Lysine Industry , by Grade, 2024-2032 (USD Million)
TABLE 36 Italy: Lysine Industry , by Form, 2024-2032 (USD Million)
TABLE 37 Italy: Lysine Industry , by Application, 2024-2032 (USD Million)
TABLE 38 Spain: Lysine Industry , by Type, 2024-2032 (USD Million)
TABLE 39 Spain: Lysine Industry , by Grade, 2024-2032 (USD Million)
TABLE 40 Spain: Lysine Industry , by Form, 2024-2032 (USD Million)
TABLE 41 Spain: Lysine Industry , by Application, 2024-2032 (USD Million)
TABLE 42 UK: Lysine Industry , by Type, 2024-2032 (USD Million)
TABLE 43 UK: Lysine Industry , by Grade, 2024-2032 (USD Million)
TABLE 44 UK: Lysine Industry , by Form, 2024-2032 (USD Million)
TABLE 45 UK: Lysine Industry , by Application, 2024-2032 (USD Million)
TABLE 46 Rest of Europe: Lysine Industry , by Type, 2024-2032 (USD Million)
TABLE 47 Rest of Europe: Lysine Industry , by Grade, 2024-2032 (USD Million)
TABLE 48 Rest of Europe: Lysine Industry , by Form, 2024-2032 (USD Million)
TABLE 49 Rest of Europe: Lysine Industry , by Application, 2024-2032 (USD Million)
TABLE 50 Asia-Pacific: Lysine Industry , by Country, 2024-2032 (USD Million)
TABLE 51 Asia-Pacific: Lysine Industry , by Type, 2024-2032 (USD Million)
TABLE 52 Asia-Pacific: Lysine Industry , by Grade, 2024-2032 (USD Million)
TABLE 53 Asia-Pacific: Lysine Industry , by Form, 2024-2032 (USD Million)
TABLE 54 Asia-Pacific: Lysine Industry , by Application, 2024-2032 (USD Million)
TABLE 55 China: Lysine Industry , by Type, 2024-2032 (USD Million)
TABLE 56 China: Lysine Industry , by Grade, 2024-2032 (USD Million)
TABLE 57 China: Lysine Industry , by Form, 2024-2032 (USD Million)
TABLE 58 China: Lysine Industry , by Application, 2024-2032 (USD Million)
TABLE 59 India: Lysine Industry , by Type, 2024-2032 (USD Million)
TABLE 60 India: Lysine Industry , by Grade, 2024-2032 (USD Million)
TABLE 61 India: Lysine Industry , by Form, 2024-2032 (USD Million)
TABLE 62 India: Lysine Industry , by Application, 2024-2032 (USD Million)
TABLE 63 Japan: Lysine Industry , by Type, 2024-2032 (USD Million)
TABLE 64 Japan: Lysine Industry , by Grade, 2024-2032 (USD Million)
TABLE 65 Japan: Lysine Industry , by Form, 2024-2032 (USD Million)
TABLE 66 Japan: Lysine Industry , by Application, 2024-2032 (USD Million)
TABLE 67 Rest of Asia-Pacific: Lysine Industry , by Type, 2024-2032 (USD Million)
TABLE 68 Rest of Asia-Pacific: Lysine Industry , by Grade, 2024-2032 (USD Million)
TABLE 69 Rest of Asia-Pacific: Lysine Industry , by Form, 2024-2032 (USD Million)
TABLE 70 Rest of Asia-Pacific: Lysine Industry , by Application, 2024-2032 (USD Million)
TABLE 71 Rest of the World (RoW): Lysine Industry , by Region, 2024-2032 (USD Million)
TABLE 72 Rest of the World (RoW): Lysine Industry , by Type, 2024-2032 (USD Million)
TABLE 73 Rest of the World (RoW): Lysine Industry , by Grade, 2024-2032 (USD Million)
TABLE 74 Rest of the World (RoW): Lysine Industry , by Form, 2024-2032 (USD Million)
TABLE 75 Rest of the World (RoW): Lysine Industry , by Application, 2024-2032 (USD Million)
TABLE 76 South America: Lysine Industry , by Type, 2024-2032 (USD Million)
TABLE 77 South America: Lysine Industry , by Grade, 2024-2032 (USD Million)
TABLE 78 South America: Lysine Industry , by Form, 2024-2032 (USD Million)
TABLE 79 South America: Lysine Industry , by Application, 2024-2032 (USD Million)
TABLE 80 Middle East: Lysine Industry , by Type, 2024-2032 (USD Million)
TABLE 81 Middle East: Lysine Industry , by Grade, 2024-2032 (USD Million)
TABLE 82 Middle East: Lysine Industry , by Form, 2024-2032 (USD Million)
TABLE 83 Middle East: Lysine Industry , by Application, 2024-2032 (USD Million)
TABLE 84 Africa: Lysine Industry , by Type, 2024-2032 (USD Million)
TABLE 85 Africa: Lysine Industry , by Grade, 2024-2032 (USD Million)
TABLE 86 Africa: Lysine Industry , by Form, 2024-2032 (USD Million)
TABLE 87 Africa: Lysine Industry , by Application, 2024-2032 (USD Million)
LIST OF FIGURES
FIGURE 1 Global Lysine Industry Segmentation
FIGURE 2 Forecast Research Methodology
FIGURE 3 Five Forces Analysis of the Global Lysine Industry
FIGURE 4 Value Chain of the Global Lysine Industry
FIGURE 5 Share of the Global Lysine Industry in 2022, by Country (%)
FIGURE 6 Global Lysine Industry , by Region, 2024-2032,
FIGURE 7 Global Lysine Industry Size, by Type, 2022
FIGURE 8 Share of the Global Lysine Industry , by Type, 2024-2032 (%)
FIGURE 9 Global Lysine Industry Size, by Grade, 2022
FIGURE 10 Share of the Global Lysine Industry , by Grade, 2024-2032 (%)
FIGURE 9 Global Lysine Industry Size, by Form, 2022
FIGURE 10 Share of the Global Lysine Industry , by Form, 2024-2032 (%)
FIGURE 9 Global Lysine Industry Size, by Application, 2022
FIGURE 10 Share of the Global Lysine Industry , by Application, 2024-2032 (%)