ID: MRFR/HC/0552-CR | July 2019 | Region: Global | 100 Pages
1 Report Prologue
2 Market Introduction
2.1 Definition 15
2.2 Scope Of Study 15
2.3 Research Objective 15
2.4 Assumptions & Limitations 16
2.4.1 Assumptions 16
2.4.2 Limitations 16
2.5 Market Structure 16
3 Research Methodology
3.1 Primary Research 18
3.2 Secondary Research 18
4 Market Dynamics
4.1 Drivers 20
4.1.1 Technological Advancements In Instrumentation 20
4.1.2 Government Investments In Academics And Life Sciences 20
4.1.3 Growth In Generics And CROs 20
4.1.4 Therapeutic Conversion To New Biological Entities 20
4.1.5 Increase Application In Life Science And Biotechnological Industry 21
4.2 Restraints 21
4.2.1 High Cost Of Instruments 21
4.2.2 Limited Availability Of These Products In Some Regions 21
4.2.3 Governments Policies And Regulations 21
4.3 Opportunities 22
4.3.1 Expansion In Developing Countries 22
4.3.2 Increasing Use Of Chromatography Technique 22
5 Market Factor Analysis
5.1 Porter’s Five Forces Model 23
5.1.1 Bargaining Power Of Suppliers 24
5.1.2 Bargaining Power Of Buyers 24
5.1.3 Threat Of New Entrants 24
5.1.4 Threat Of Substitutes 24
5.1.5 Intensity Of Rivalry 24
5.2 Value Chain Analysis 25
5.2.1 R&D 25
5.2.2 Parts Manufacturing 25
5.2.3 Assembly 25
5.2.4 Distribution 26
5.2.5 Marketing & Sales 26
5.2.6 Post-Sales Services 26
6 Liquid Chromatography Instruments Market, By Technique
6.1 Introduction 27
7 Liquid Chromatography Instrument Market, By Type
7.1 Introduction 31
8 Liquid Chromatography Instrument Market, By End Users
8.1 Introduction 35
9 Global Liquid Chromatography Instrument Market, By Region
9.1 Introduction 39
9.2 North America 41
Liquid Chromatography Instruments Market, By Technique
Liquid Chromatography Instrument Market, By Type
Liquid Chromatography Instrument Market, By End Users
9.3 Europe 46
Liquid Chromatography Instruments Market, By Technique
Liquid Chromatography Instrument Market, By Type
Liquid Chromatography Instrument Market, By End Users
9.4 Asia-Pacific 59
Liquid Chromatography Instruments Market, By Technique
Liquid Chromatography Instrument Market, By Type
Liquid Chromatography Instrument Market, By End Users
9.5 Middle East & Africa 70
Liquid Chromatography Instruments Market, By Technique
Liquid Chromatography Instrument Market, By Type
Liquid Chromatography Instrument Market, By End Users
10 Competitive Landscape
10.1 Introduction 75
11 Company Profiles
11.1 Agilent Technology 77
11.1.1 Company Overview 77
11.1.2 Product/Business Segment Overview 77
11.1.3 Financials 77
11.1.4 Key Developments 78
11.1.5 SWOT Analysis 79
11.2 Bruker 80
11.2.1 Company Overview 80
11.2.2 Product/Business Segment Overview 80
11.2.3 Financials 81
11.2.4 Key Developments 82
11.2.5 SWOT Analysis 83
11.3 PerkinElmer 84
11.3.1 Company Overview 84
11.3.2 Product/Business Segment Overview 84
11.3.3 Financials 84
11.3.4 Key Developments 85
11.3.5 SWOT Analysis 86
11.4 Phenomenex 87
11.4.1 Company Overview 87
11.4.2 Product/Business Segment Overview 87
11.4.3 Financials 87
11.4.4 Key Developments 87
11.4.5 SWOT Analysis 88
11.5 Shimadzu Corp. 89
11.5.1 Company Overview 89
11.5.2 Product/Business Segment Overview 89
11.5.3 Financials 90
11.5.4 Key Developments 91
11.5.5 SWOT Analysis 92
11.6 Thermo Fisher Scientific Inc. 93
11.6.1 Company Overview 93
11.6.2 Product/Business Segment Overview 93
11.6.3 Financials 93
11.6.4 Key Developments 95
11.6.5 SWOT Analysis 96
11.7 Waters Corporation 97
11.7.1 Company Overview 97
11.7.2 Product/Business Segment Overview 97
11.7.3 Financials 97
11.7.4 Key Developments 98
11.7.5 SWOT Analysis 99
12 List Of Tables
TABLE 1 GLOBAL LIQUID CHROMATOGRAPHY INSTRUMENTS MARKET, BY TYPE FROM 2020 TO 2027, (USD MILLION) 28
TABLE 2 GLOBAL LIQUID CHROMATOGRAPHY INSTRUMENTS MARKET FOR HPLC, BY REGION FROM 2020 TO 2027, (USD MILLION) 29
TABLE 3 GLOBAL LIQUID CHROMATOGRAPHY INSTRUMENTS MARKET FOR UHPLC, BY REGION FROM 2020 TO 2027, (USD MILLION) 29
TABLE 4 GLOBAL LIQUID CHROMATOGRAPHY INSTRUMENTS MARKET FOR LPLC, BY REGION FROM 2020 TO 2027, (USD MILLION) 30
TABLE 5 GLOBAL LIQUID CHROMATOGRAPHY INSTRUMENTS MARKET FOR FPLC, BY REGION FROM 2020 TO 2027, (USD MILLION) 30
TABLE 6 GLOBAL LIQUID CHROMATOGRAPHY INSTRUMENT MARKET, BY TYPE FROM 2020 TO 2027, (USD MILLION) 32
TABLE 7 GLOBAL LIQUID CHROMATOGRAPHY INSTRUMENTS MARKET FOR INSTRUMENTS, BY REGION FROM 2020 TO 2027, (USD MILLION) 33
TABLE 8 GLOBAL LIQUID CHROMATOGRAPHY INSTRUMENTS MARKET FOR CONSUMABLE, BY REGION FROM 2020 TO 2027, (USD MILLION) 33
TABLE 9 GLOBAL LIQUID CHROMATOGRAPHY INSTRUMENTS MARKET FOR SERVICES, BY REGION FROM 2020 TO 2027, (USD MILLION) 34
TABLE 10 GLOBAL LIQUID CHROMATOGRAPHY INSTRUMENT MARKET, BY END USERS FROM 2020 TO 2027, (USD MILLION) 36
TABLE 11 GLOBAL LIQUID CHROMATOGRAPHY INSTRUMENTS MARKET FOR PHARMACEUTICAL AND BIOTECHNOLOGY COMPANY, BY REGION FROM 2020 TO 2027, (USD MILLION) 37
TABLE 12 GLOBAL LIQUID CHROMATOGRAPHY INSTRUMENTS MARKET FOR ACADEMIC AND RESEARCH INSTITUTES, BY REGION FROM 2020 TO 2027, (USD MILLION) 37
TABLE 13 GLOBAL LIQUID CHROMATOGRAPHY INSTRUMENTS MARKET FOR HOSPITALS, BY REGION FROM 2020 TO 2027, (USD MILLION) 38
TABLE 14 GLOBAL LIQUID CHROMATOGRAPHY INSTRUMENTS MARKET FOR AGRICULTURE INDUSTRY, BY REGION FROM 2020 TO 2027, (USD MILLION) 38
TABLE 15 GLOBAL LIQUID CHROMATOGRAPHY INSTRUMENT MARKET, BY REGIONS FROM 2020 TO 2027, (USD MILLION) 40
TABLE 16 NORTH AMERICA LIQUID CHROMATOGRAPHY INSTRUMENTS MARKET, BY COUNTRY FROM 2020 TO 2027, (USD MILLION) 41
TABLE 17 NORTH AMERICA LIQUID CHROMATOGRAPHY INSTRUMENTS MARKET, BY TECHNIQUE FROM 2020 TO 2027, (USD MILLION) 41
TABLE 18 NORTH AMERICA LIQUID CHROMATOGRAPHY INSTRUMENTS MARKET, BY TYPE FROM 2020 TO 2027, (USD MILLION) 41
TABLE 19 NORTH AMERICA LIQUID CHROMATOGRAPHY INSTRUMENTS MARKET, BY END USERS FROM 2020 TO 2027, (USD MILLION) 42
TABLE 20 US LIQUID CHROMATOGRAPHY INSTRUMENT MARKET, BY TECHNIQUE FROM 2020 TO 2027, (USD MILLION) 43
TABLE 21 US LIQUID CHROMATOGRAPHY INSTRUMENT MARKET, BY TYPE FROM 2020 TO 2027, (USD MILLION) 43
TABLE 22 US LIQUID CHROMATOGRAPHY INSTRUMENT MARKET, BY END USERS FROM 2020 TO 2027, (USD MILLION) 44
TABLE 23 CANADA LIQUID CHROMATOGRAPHY INSTRUMENT MARKET, BY TECHNIQUE FROM 2020 TO 2027, (USD MILLION) 44
TABLE 24 CANADA LIQUID CHROMATOGRAPHY INSTRUMENT MARKET, BY TYPE FROM 2020 TO 2027, (USD MILLION) 45
TABLE 25 CANADA LIQUID CHROMATOGRAPHY INSTRUMENT MARKET, BY END USERS FROM 2020 TO 2027, (USD MILLION) 45
TABLE 26 EUROPE LIQUID CHROMATOGRAPHY INSTRUMENTS MARKET, BY REGION FROM 2020 TO 2027, (USD MILLION) 46
TABLE 27 EUROPE LIQUID CHROMATOGRAPHY INSTRUMENTS MARKET, BY TECHNIQUE FROM 2020 TO 2027, (USD MILLION) 47
TABLE 28 EUROPE LIQUID CHROMATOGRAPHY INSTRUMENTS MARKET, BY TYPE FROM 2020 TO 2027, (USD MILLION) 47
TABLE 29 EUROPE LIQUID CHROMATOGRAPHY INSTRUMENTS MARKET, BY END USERS FROM 2020 TO 2027, (USD MILLION) 48
TABLE 30 UK LIQUID CHROMATOGRAPHY INSTRUMENTS MARKET, BY TECHNIQUE FROM 2020 TO 2027, (USD MILLION) 48
TABLE 31 UK LIQUID CHROMATOGRAPHY INSTRUMENTS MARKET, BY TYPE FROM 2020 TO 2027, (USD MILLION) 49
TABLE 32 UK LIQUID CHROMATOGRAPHY INSTRUMENTS MARKET, BY END USERS FROM 2020 TO 2027, (USD MILLION) 49
TABLE 33 GERMANY LIQUID CHROMATOGRAPHY INSTRUMENTS MARKET, BY TECHNIQUE FROM 2020 TO 2027, (USD MILLION) 50
TABLE 34 GERMANY LIQUID CHROMATOGRAPHY INSTRUMENTS MARKET, BY TYPE FROM 2020 TO 2027, (USD MILLION) 50
TABLE 35 GERMANY LIQUID CHROMATOGRAPHY INSTRUMENTS MARKET, BY END USERS FROM 2020 TO 2027, (USD MILLION) 51
TABLE 36 FRANCE LIQUID CHROMATOGRAPHY INSTRUMENTS MARKET, BY TECHNIQUE FROM 2020 TO 2027, (USD MILLION) 51
TABLE 37 FRANCE LIQUID CHROMATOGRAPHY INSTRUMENTS MARKET, BY TYPE FROM 2020 TO 2027, (USD MILLION) 52
TABLE 38 FRANCE LIQUID CHROMATOGRAPHY INSTRUMENTS MARKET, BY END USER FROM 2020 TO 2027, (USD MILLION) 52
TABLE 39 ITALY LIQUID CHROMATOGRAPHY INSTRUMENTS MARKET, BY TECHNIQUE FROM 2020 TO 2027, (USD MILLION) 53
TABLE 40 ITALY LIQUID CHROMATOGRAPHY INSTRUMENTS MARKET, BY TYPE FROM 2020 TO 2027, (USD MILLION) 53
TABLE 41 ITALY LIQUID CHROMATOGRAPHY INSTRUMENTS MARKET, BY END USERS FROM 2020 TO 2027, (USD MILLION) 54
TABLE 42 SPAIN LIQUID CHROMATOGRAPHY INSTRUMENTS MARKET, BY TECHNIQUE FROM 2020 TO 2027, (USD MILLION) 54
TABLE 43 SPAIN LIQUID CHROMATOGRAPHY INSTRUMENTS MARKET, BY TYPE FROM 2020 TO 2027, (USD MILLION) 55
TABLE 44 SPAIN LIQUID CHROMATOGRAPHY INSTRUMENTS MARKET, BY END USER FROM 2020 TO 2027, (USD MILLION) 55
TABLE 45 REST OF EUROPE LIQUID CHROMATOGRAPHY INSTRUMENTS MARKET, BY TECHNIQUE FROM 2020 TO 2027, (USD MILLION) 56
TABLE 46 REST OF EUROPE LIQUID CHROMATOGRAPHY INSTRUMENTS MARKET, BY TYPE FROM 2020 TO 2027, (USD MILLION) 56
TABLE 47 REST OF EUROPE LIQUID CHROMATOGRAPHY INSTRUMENTS MARKET, BY END USER FROM 2020 TO 2027, (USD MILLION) 57
TABLE 48 EASTERN EUROPE LIQUID CHROMATOGRAPHY INSTRUMENTS MARKET, BY TECHNIQUE FROM 2020 TO 2027, (USD MILLION) 57
TABLE 49 EASTERN EUROPE LIQUID CHROMATOGRAPHY INSTRUMENTS MARKET, BY TYPE FROM 2020 TO 2027, (USD MILLION) 58
TABLE 50 EASTERN EUROPE LIQUID CHROMATOGRAPHY INSTRUMENTS MARKET, BY END USER FROM 2020 TO 2027, (USD MILLION) 58
TABLE 51 ASIA-PACIFIC LIQUID CHROMATOGRAPHY INSTRUMENT MARKET, BY COUNTRY FROM 2020 TO 2027, (USD MILLION) 59
TABLE 52 ASIA-PACIFIC LIQUID CHROMATOGRAPHY INSTRUMENT MARKET, BY TECHNIQUE FROM 2020 TO 2027, (USD MILLION) 59
TABLE 53 ASIA-PACIFIC LIQUID CHROMATOGRAPHY INSTRUMENT MARKET, BY TYPE FROM 2020 TO 2027, (USD MILLION) 60
TABLE 54 ASIA-PACIFIC LIQUID CHROMATOGRAPHY INSTRUMENT MARKET, BY END USER FROM 2020 TO 2027, (USD MILLION) 60
TABLE 55 JAPAN LIQUID CHROMATOGRAPHY INSTRUMENTS MARKET, BY TECHNIQUE FROM 2020 TO 2027, (USD MILLION) 61
TABLE 56 JAPAN LIQUID CHROMATOGRAPHY INSTRUMENTS MARKET, BY TYPE FROM 2020 TO 2027, (USD MILLION) 61
TABLE 57 JAPAN LIQUID CHROMATOGRAPHY INSTRUMENTS MARKET, BY END USER FROM 2020 TO 2027, (USD MILLION) 62
TABLE 58 CHINA LIQUID CHROMATOGRAPHY INSTRUMENTS MARKET, BY TECHNIQUE FROM 2020 TO 2027, (USD MILLION) 62
TABLE 59 CHINA LIQUID CHROMATOGRAPHY INSTRUMENTS MARKET, BY TYPE FROM 2020 TO 2027, (USD MILLION) 63
TABLE 60 CHINA LIQUID CHROMATOGRAPHY INSTRUMENTS MARKET, BY END USER FROM 2020 TO 2027, (USD MILLION) 63
TABLE 61 INDIA LIQUID CHROMATOGRAPHY INSTRUMENTS MARKET, BY TECHNIQUE FROM 2020 TO 2027, (USD MILLION) 64
TABLE 62 INDIA LIQUID CHROMATOGRAPHY INSTRUMENTS MARKET, BY TYPE FROM 2020 TO 2027, (USD MILLION) 64
TABLE 63 INDIA LIQUID CHROMATOGRAPHY INSTRUMENTS MARKET, BY END USER FROM 2020 TO 2027, (USD MILLION) 65
TABLE 64 SOUTH KOREA LIQUID CHROMATOGRAPHY INSTRUMENTS MARKET, BY TECHNIQUE FROM 2020 TO 2027, (USD MILLION) 65
TABLE 65 SOUTH KOREA LIQUID CHROMATOGRAPHY INSTRUMENTS MARKET, BY TYPE FROM 2020 TO 2027, (USD MILLION) 66
TABLE 66 SOUTH KOREA LIQUID CHROMATOGRAPHY INSTRUMENTS MARKET, BY END USER FROM 2020 TO 2027, (USD MILLION) 66
TABLE 67 AUSTRALIA LIQUID CHROMATOGRAPHY INSTRUMENTS MARKET, BY TECHNIQUE FROM 2020 TO 2027, (USD MILLION) 67
TABLE 68 AUSTRALIA LIQUID CHROMATOGRAPHY INSTRUMENTS MARKET, BY TYPE FROM 2020 TO 2027, (USD MILLION) 67
TABLE 69 AUSTRALIA LIQUID CHROMATOGRAPHY INSTRUMENTS MARKET, BY END USER FROM 2020 TO 2027, (USD MILLION) 68
TABLE 70 REST OF ASIA-PACIFIC LIQUID CHROMATOGRAPHY INSTRUMENTS MARKET, BY TECHNIQUE FROM 2020 TO 2027, (USD MILLION) 68
TABLE 71 REST OF ASIA-PACIFIC LIQUID CHROMATOGRAPHY INSTRUMENTS MARKET, BY TYPE FROM 2020 TO 2027, (USD MILLION) 69
TABLE 72 REST OF ASIA-PACIFIC LIQUID CHROMATOGRAPHY INSTRUMENTS MARKET, BY END USER FROM 2020 TO 2027, (USD MILLION) 69
TABLE 73 MIDDLE EAST AND AFRICA LIQUID CHROMATOGRAPGY INSTRUMENTS MARKET, BY COUNTRY FROM 2020 TO 2027, (USD MILLION) 70
TABLE 74 MIDDLE EAST AND AFRICA LIQUID CHROMATOGRAPGY INSTRUMENTS MARKET, BY TECHNIQUE FROM 2020 TO 2027, (USD MILLION) 70
TABLE 75 MIDDLE EAST AND AFRICA LIQUID CHROMATOGRAPGY INSTRUMENTS MARKET, BY TYPE FROM 2020 TO 2027, (USD MILLION) 71
TABLE 76 MIDDLE EAST AND AFRICA LIQUID CHROMATOGRAPGY INSTRUMENTS MARKET, BY END USER FROM 2020 TO 2027, (USD MILLION) 71
TABLE 77 MIDDLE EAST LIQUID CHROMATOGRAPGY INSTRUMENTS MARKET, BY TECHNIQUE FROM 2020 TO 2027, (USD MILLION) 72
TABLE 78 MIDDLE EAST LIQUID CHROMATOGRAPGY INSTRUMENTS MARKET, BY TYPE FROM 2020 TO 2027, (USD MILLION) 72
TABLE 79 MIDDLE EAST LIQUID CHROMATOGRAPGY INSTRUMENTS MARKET, BY END USER FROM 2020 TO 2027, (USD MILLION) 73
TABLE 80 AFRICA LIQUID CHROMATOGRAPGY INSTRUMENTS MARKET, BY TECHNIQUE FROM 2020 TO 2027, (USD MILLION) 73
TABLE 81 AFRICA LIQUID CHROMATOGRAPGY INSTRUMENTS MARKET, BY TYPE FROM 2020 TO 2027, (USD MILLION) 74
TABLE 82 AFRICA LIQUID CHROMATOGRAPGY INSTRUMENTS MARKET, BY END USER FROM 2020 TO 2027, (USD MILLION) 74
TABLE 83 AGILENT TECHNOLOGY: KEY DEVELOPMENTS 78
TABLE 84 BRUKER: KEY DEVELOPMENTS 82
TABLE 85 PERKINELMER: KEY DEVELOPMENTS 85
TABLE 86 PHENOMENEX: KEY DEVELOPMENTS 87
TABLE 87 PHENOMENEX: KEY DEVELOPMENTS 91
TABLE 88 THERMO FISHER SCIENTIFIC INC.: KEY DEVELOPMENTS 95
TABLE 89 WATERS CORPORATION: KEY DEVELOPMENTS 98
13 List Of Figures
FIGURE 1 GLOBAL LIQUID CHROMATOGRAPHY INSTRUMENTS MARKET BY TECHNIQUE, 2020 (%) 12
FIGURE 4 GLOBAL LIQUID CHROMATOGRAPHY INSTRUMENTS MARKET BY REGION, 2020 (%) 14
FIGURE 5 MARKET STRUCTURE OF GLOBAL LIQUID CHROMATOGRAPHY INSTRUMENTS MARKET 16
FIGURE 7 DRIVERS, RESTRAINTS, AND OPPORTUNITIES OF LIQUID CHROMATOGRAPHY MARKET 19
FIGURE 8 PORTERS FIVE FORCES MODEL 23
FIGURE 9 VALUE CHAIN: LIQUID CHROMATOGRAPHY INSTRUMENT 25
FIGURE 10 GLOBAL LIQUID CHROMATOGRAPHY INSTRUMENTS MARKET, BY TECHNIQUE, 2020 & 2027, (USD MILLION) 28
FIGURE 11 GLOBAL LIQUID CHROMATOGRAPHY INSTRUMENT MARKET, BY TYPE, 2020 & 2027, (USD MILLION) 32
FIGURE 12 GLOBAL LIQUID CHROMATOGRAPHY INSTRUMENT MARKET, BY END USER, 2020 & 2027, (USD MILLION) 36
FIGURE 13 GLOBAL LIQUID CHROMATOGRAPHY INSTRUMENT MARKET, BY REGION, 2020 & 2027, (USD MILLION) 40
FIGURE 14 AGILENT TECHNOLOGY: RECENT FINANCIALS 77
FIGURE 15 AGILENT TECHNOLOGY: OPERATING SEGMENTS 78
FIGURE 16 AGILENT TECHNOLOGIES: SWOT ANALYSIS 79
FIGURE 17 BRUKER: RECENT FINANCIALS 81
FIGURE 18 BRUKER: OPERATING SEGMENTS 81
FIGURE 19 BRUKER: GEOGRAPHICAL SEGMENTS 82
FIGURE 20 BRUKER: SWOT ANALYSIS 83
FIGURE 21 PERKINELMER: RECENT FINANCIALS 84
FIGURE 22 PERKINELMER: OPERATING SEGMENTS 85
FIGURE 23 PERKINELMER: GEOGRAPHIC SEGMENTS 85
FIGURE 24 PERKINELMER: SWOT ANALYSIS 86
FIGURE 25 PHENOMENEX: SWOT ANALYSIS 88
FIGURE 26 SHIMADZU: RECENT FINANCIALS 90
FIGURE 27 SHIMADZU: OPERATING SEGMENTS 90
FIGURE 28 SHIMADZU CORP: SWOT ANALYSIS 92
FIGURE 29 THERMO FISHER SCIENTIFIC INC.: RECENT FINANCIALS 93
FIGURE 30 THERMO FISHER SCIENTIFIC INC.: BUSINESS REVENUE 94
FIGURE 31 THERMO FISHER SCIENTIFIC INC.: GEOGRAPHICAL REVENUE 94
FIGURE 32 THERMO FISHER SCIENTIFIC INC.: SWOT ANALYSIS 96
FIGURE 33 WATERS CORPORATION: RECENT FINANCIALS 97
FIGURE 34 WATERS CORPORATION: OPERATING SEGMENTS 98
FIGURE 35 WATERS CORPORATION: GEOGRAPHIC SEGMENTS 98
FIGURE 36 WATERS CORPORATION: SWOT ANALYSIS 99
$11,194.4 Million
7.5%
North America
2020-2027
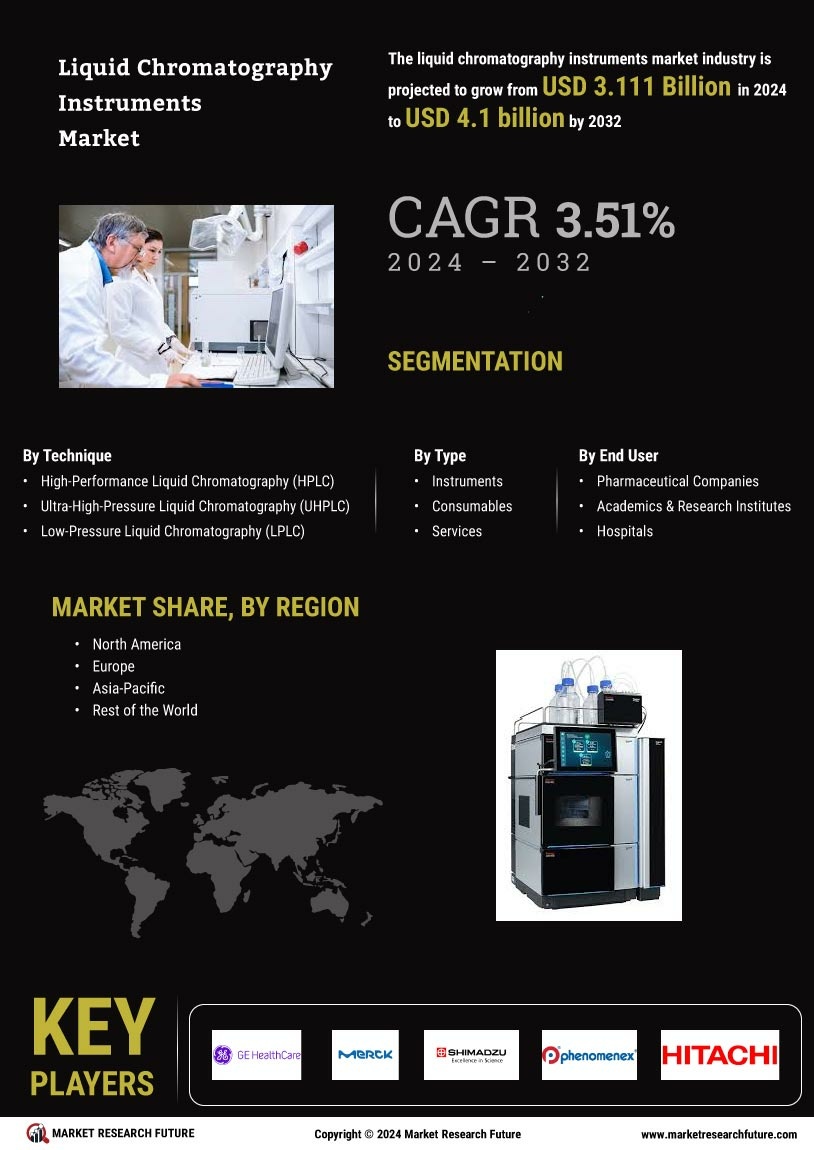
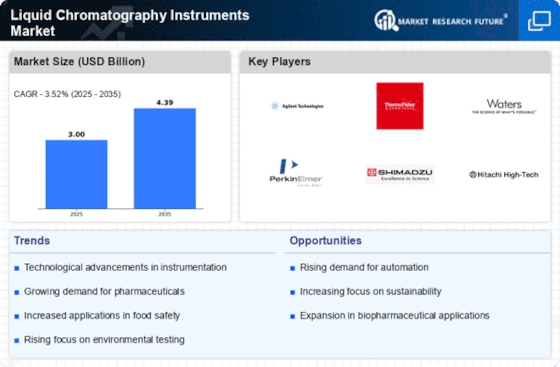
According to Liquid Chromatography Instruments Market Research Report - Global Forecast till 2027, it is expected that the market of Liquid Chromatography Instruments will have a CAGR (Comprehensive Annual Growth Rate) of 7.5%. It will gain a profit of around USD 11 34.4 million by the year 2027.
Liquid Chromatography is a technique used to separate molecules dissolved into a solvent into individual parts. The HPLC tests have become popular for approval of drugs and hyphenated techniques.
The demand for food safety is one of the main reasons for running the Liquid Chromatography Instruments Market. However, the HPLC system's expensive rates will possibly restrict the market growth to a certain length.
The continuous development in technology, investments from the government in education, generic growth, increase in the application of life science and biotechnological industries are the main forces responsible for the Market's growth.
COVID-19 Impact
The Coronavirus or COVID-19 pandemic has tilted many businesses upside down. The Liquid Chromatography Instruments Market is one of them that faced severe impact. The sector of analytical instrumentation is still facing problems in the supply and manufacturing chain.
The Market would not be affected by the Coronavirus for an extended period. Different pharmaceutical and biopharmaceutical companies are concentrating on new developments of drugs and vaccines to fight against the pandemic.
The demand for generics, drug development, and other new methods will improve the market growth. However, government regulations, costly instruments, and limited availability in the market will compel market growth.
Market Dynamics
Market Drivers
The increasing demand for hyphenated chromatography techniques is one of the key market drivers. The hyphenated techniques are a chromatic separation process with detectors like UV and another identification process with IR (Infrared), NMR (nuclear magnetic resonance) spectrometers. Few commonly used hyphenated chromatography techniques are- LC-NMR, LC-MS, LC-FTIR, and GC-MS.
They require very little time for a proper analysis comparing to other various methods. Also, it can provide good automation, fewer risks of contamination, and high selectivity with increased productivity, for clinical screening, forensic investigations, food testing, and even pesticide residue analysis.
These various advancements in the Liquid Chromatography Instruments Market have also led the industry to manufacture automated, comparatively small devices and easy operation for the biotechnology companies.
Opportunity
The demand for Market will lead to the production and advancement in gas chromatography in the petrochemical industry. Due to the high sensitivity for volatile compounds, gas chromatography is highly preferred for the petroleum industry.
Also, there is a demand for specialized gas chromatography in the petroleum industry. The advanced developments will reduce the downtime and the costs needed for maintenance. These columns' production and growth will prove to have potential growth for companies trying to gain momentum in the market.
Restraints
The chromatography instruments comprise advanced technological features, which makes them an expensive product. The costs and applications of new instruments differ from each other. The new instruments use capillary columns to separate compounds such as hydrogen, methane and oxygen. The other costs, such as maintenance and other steps, will hamper Liquid Chromatography Instruments Markets growth.
Challenges
Alternative techniques are crystallization, high-resolution ultra-filtration, protein crystallization, membrane chromatography, three-phased partitioning monoliths, capillary electrophoresis, high-pressure folding, precipitation, etc.
The techniques mentioned above are for manufacturing protein therapeutics. Alternative methods reduce the manufacturing costs, and antibodies are separated in just one step. These benefits will have a significant impact on the growth of the Liquid Chromatography Instruments Market.
Cumulative Growth Analysis
It is expected that the growth of the Market will increase during the forecast period. (2020-2027). the manufacturing companies are focusing on technological advancements to get quality analysis in less time. There are significant chances for increasing demand for HPLC techniques that will help the market overgrow.
Value Chain analysis
The increasing demand for HPLC techniques in the Liquid Chromatography Instruments Market has been gaining significant investments from pharmaceuticals and biotechnological companies in Research and Development activities. The column segments will grow at a significant rate during the predicted period. Industry of Life science comprises the largest share in the market in the year 2019. It owned various chromatography application techniques for drug development.
Liquid Chromatography Instruments Market Size, by End User, 2016 (USD Million)
Source: MRFR Analysis
Segment Overview
The Liquid Chromatography Instruments Market are classified in to below segments-
By Region
By Type
By Accessories and Consumables
Columns Consumables and Accessories
Columns
Chromatography Tubing and Fittings
By User-end Industry
Mobile Phase Accessories
Detectors
Flow Management consumables and Accessories
Asia-Pacific Liquid Chromatography Instruments Market Share, by Country, 2016 (%)
Source: MRFR Analysis
Regional Analysis
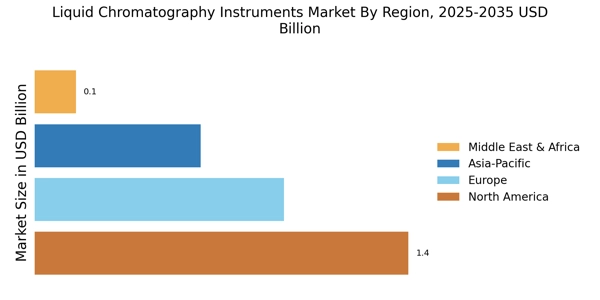
Geographically, there are three regions into which the Market of Liquid Chromatography Instruments is divided: the American, Asia-Pacific, Europe, and Middle East regions. The reports say that American region has dominated Liquid Chromatography instruments' global market during the forecast period. The increase of utilization in several companies such as biotechnological industries, pharmaceutical industries, agriculture, etc.
The second-largest geographical region is Europe, observe growth in the upcoming years of the forecast period. The technological advancements in the future will boost the growth of the Market.
The Asia-Pacific region market will grow rapidly for its developing technologies in healthcare and other vital areas. It has observed an increase in investment and progress in economic conditions, etc.
The Liquid Chromatography Instruments Market in the Middle East and African region will have a steady and gradual growth due to lack of essential technologies and awareness.
Competitive Landscape
Several pharmaceutical and biotechnological companies are trying to push the Liquid Chromatography Instruments Market and boost their economy. Various factors like environmental protection activities, rapid expansions, and increasing awareness of chromatography in countries like Japan and India are emerging as great support for the Chromatography Instruments Market. Key factors such as column, production, future trends, price trends, export, import analysis, raw materials cost, etc., are used by different companies.
Agilent Technologies in 2017 launched Research-Grade Triple Quadrupole System for the expansion of its business in the Liquid Chromatography Instruments Market. The Quadruple system comprises HPLC (High-Performance Liquid Chromatography) and triple quadrupole mass spectrometry, giving highly accurate data.
Here is the list of key market players -
Recent Developments
In January 2017, Bruker acquired a company called Hyston to manufacture, develop, and sell the testing instruments.
In 2020, the Waters Corporation acquired Switzerland-based software company- Andrew Alliance to expand its technological fields, such as robotics and software development, to enable the researchers to perform complex tasks.
Report Overview
The North American countries have primarily contributed to generate revenue for the Liquid Chromatography Instruments Market. The Asia- Pacific has seen the fastest growth, and in the upcoming years, it is expected to dominate the market. The European region has invested a significant stake in Research and Development, whereas the Middle East and African region has been slow and expected to steady.
By Type
By Technique
By End-User
By Geographical Region
Report Attribute/Metric | Details |
---|---|
Market Size | USD 11 34.4 million |
CAGR | 7.5% |
Base Year | 2020 |
Forecast Period | 2020-2027 |
Historical Data | 2019 |
Forecast Units | Value (USD Million) |
Report Coverage | Revenue Forecast, Competitive Landscape, Growth Factors, and Trends |
Segments Covered | By Technique, Type, End User, Region |
Geographies Covered | North America, Europe, Asia-Pacific, and Rest of the World (RoW) |
Key Vendors | GE Healthcare (US),, Merck Millipore (Germany),, Shimadzu (Japan),, Phenomenex (US),, Hitachi (Japan), Hamilton Company (US), Thermo Fisher (US), Gilson (US), YMC Co. Ltd. (Japan), Trajan Scientific (Australia), SIELC (US), JASCO (US), Tosoh Bioscience LLC (Japan), Orochem (US), Showa Denko (Japan) |
Key Market Opportunities | Demand for specialized gas chromatography in the petroleum industry. The advanced developments will reduce the downtime and the costs for maintenance |
Key Market Drivers |
|
Frequently Asked Questions (FAQ) :
The market CAGR would be 7.5% for the forecast period.
The valuation would be USD 11,194.4 million by 2027.
High instrument costs, government policies, and lack of technical support can restrain the market.
The valuation was USD 2072 million in 2016.
The Asia Pacific region would dominate the market in the coming years.