ID: MRFR/HC/9240-HCR | November 2021 | Region: Global | 120 Pages
TABLE OF CONTENTS
1. EXECUTIVE SUMMARY
2. MARKET INTRODUCTION
2.1. Definition
2.2. Scope of the Study
2.2.1. Research Objective
2.2.2. Assumptions
2.2.3. Limitations
3. RESEARCH METHODOLOGY
3.1. Overview
3.2. Data Mining
3.3. Secondary Research
3.4. Primary Research
3.4.1. Primary Interviews and Information Gathering Process
3.4.2. Breakdown of Primary Respondents
3.5. Forecasting Cellulite Type
3.6. Market Size Estimation
3.6.1. Bottom-Up Approach
3.6.2. Top-Down Approach
3.7. Data Triangulation
3.8. Validation
4. MARKET DYNAMICS
4.1. Overview
4.2. Drivers
4.3. Restraints
4.4. Opportunities
5. MARKET FACTOR ANALYSIS
5.1. Porter’s Five Forces Analysis
5.1.1. Bargaining Power of Suppliers
5.1.2. Bargaining Power of Buyers
5.1.3. Threat of New Entrants
5.1.4. Threat of Substitutes
5.1.5. Intensity of Rivalry
5.2. Value Chain Analysis
5.3. COVID-19 Impact Analysis
5.3.1. Market Impact Analysis
5.3.2. Impact on Supply Chain
5.3.3. Regional Impact
5.3.4. Opportunity and Threat Analysis
6. GLOBAL LOW-PRESSURE LIQUID CHROMATOGRAPHY MARKET, BY COMPONENT
6.1. Overview
6.2. Instruments
Market Estimates & Forecast, by Region, 2018–2027
Market Estimates & Forecast, by Country, 2018–2027
6.3. Consumables
Market Estimates & Forecast, by Region, 2018–2027
Market Estimates & Forecast, by Country, 2018–2027
6.4. Services
Market Estimates & Forecast, by Region, 2018–2027
Market Estimates & Forecast, by Country, 2018–2027
7. GLOBAL LOW-PRESSURE LIQUID CHROMATOGRAPHY MARKET, BY END USER
7.1. Overview
7.2. Pharmaceutical Companies
Market Estimates & Forecast, by Region, 2018–2027
Market Estimates & Forecast, by Country, 2018–2027
7.3. Biotechnology Companies
Market Estimates & Forecast, by Region, 2018–2027
Market Estimates & Forecast, by Country, 2018–2027
7.4. Research Laboratories
Market Estimates & Forecast, by Region, 2018–2027
Market Estimates & Forecast, by Country, 2018–2027
7.5. Academic Institution
Market Estimates & Forecast, by Region, 2018–2027
Market Estimates & Forecast, by Country, 2018–2027
8. GLOBAL LOW-PRESSURE LIQUID CHROMATOGRAPHY MARKET, BY REGION
8.1. Overview
8.2. North America
8.2.1. US
8.2.2. Canada
8.3. Europe
8.3.1. Germany
8.3.2. France
8.3.3. UK
8.3.4. Italy
8.3.5. Spain
8.3.6. Rest of Europe
8.4. Asia-Pacific
8.4.1. China
8.4.2. India
8.4.3. Japan
8.4.4. South Korea
8.4.5. Australia
8.4.6. Rest of Asia-Pacific
8.5. Rest of the World
8.5.1. Middle East
8.5.2. Africa
8.5.3. Latin America
9. COMPANY LANDSCAPE
9.1. Overview
9.2. Competitive Analysis
9.3. Market Share Analysis
9.4. Major Growth Strategy in the Global Low Pressure Liquid Chromatography Market
9.5. Competitive Benchmarking
9.6. Leading Players in terms of number of developments in the Global Low Pressure Liquid Chromatography Market
9.7. Key Developments and Growth Strategies
9.7.1. New Product Launch/Service Deployment
9.7.2. Merger & Acquisitions
9.7.3. Joint Ventures
9.8. Major Players Financial Matrix
9.8.1. Sales & Operating Income, 2020
9.8.2. Major Players R&D Expenditure, 2020
10. COMPANY PROFILES
10.1. Novasep
10.1.1. Company Overview
10.1.2. Products Offered
10.1.3. Financial Overview
10.1.4. Key Developments
10.1.5. SWOT Analysis
10.1.6. Key Strategies
10.2. LEWA GmbH
10.2.1. Company Overview
10.2.2. Products Offered
10.2.3. Financial Overview
10.2.4. Key Developments
10.2.5. SWOT Analysis
10.2.6. Key Strategies
10.3. GALAK Chromatography Technology Co., Ltd
10.3.1. Company Overview
10.3.2. Products Offered
10.3.3. Financial Overview
10.3.4. Key Developments
10.3.5. SWOT Analysis
10.3.6. Key Strategies
10.4. Biolinx Labsystems
10.4.1. Company Overview
10.4.2. Products Offered
10.4.3. Financial Overview
10.4.4. Key Developments
10.4.5. SWOT Analysis
10.4.6. Key Strategies
10.5. Bio-Rad Laboratories, Inc.
10.5.1. Company Overview
10.5.2. Products Offered
10.5.3. Financial Overview
10.5.4. Key Developments
10.5.5. SWOT Analysis
10.5.6. Key Strategies
10.6. Danaher Corporation
10.6.1. Company Overview
10.6.2. Products Offered
10.6.3. Financial Overview
10.6.4. Key Developments
10.6.5. SWOT Analysis
10.6.6. Key Strategies
10.7. Nilsan Nishotech Systems Pvt. Ltd
10.7.1. Company Overview
10.7.2. Products Offered
10.7.3. Financial Overview
10.7.4. Key Developments
10.7.5. SWOT Analysis
10.7.6. Key Strategies
11. APPENDIX
11.1. References
11.2. Related Reports
LIST OF TABLES
TABLE 1 GLOBAL LOW-PRESSURE LIQUID CHROMATOGRAPHY MARKET SYNOPSIS, 2018–2027
TABLE 2 GLOBAL LOW-PRESSURE LIQUID CHROMATOGRAPHY MARKET ESTIMATES & FORECAST, 2018–2027 (USD BILLION)
TABLE 3 GLOBAL LOW-PRESSURE LIQUID CHROMATOGRAPHY MARKET, BY COMPONENT, 2018–2027 (USD BILLION)
TABLE 4 GLOBAL LOW-PRESSURE LIQUID CHROMATOGRAPHY MARKET, BY END USER, 2018–2027 (USD BILLION)
TABLE 5 NORTH AMERICA OF LOW-PRESSURE LIQUID CHROMATOGRAPHY MARKET, BY COMPONENT, 2018–2027 (USD BILLION)
TABLE 6 NORTH AMERICA LOW-PRESSURE LIQUID CHROMATOGRAPHY MARKET, BY END USER, 2018–2027 (USD BILLION)
TABLE 7 US: LOW-PRESSURE LIQUID CHROMATOGRAPHY MARKET, BY COMPONENT, 2018–2027 (USD BILLION)
TABLE 8 US LOW-PRESSURE LIQUID CHROMATOGRAPHY MARKET, BY END USER, 2018–2027 (USD BILLION)
TABLE 9 CANADA: LOW-PRESSURE LIQUID CHROMATOGRAPHY MARKET, BY COMPONENT, 2018–2027 (USD BILLION)
TABLE 10 CANADA LOW-PRESSURE LIQUID CHROMATOGRAPHY MARKET, BY END USER, 2018–2027 (USD BILLION)
TABLE 11 EUROPE: LOW-PRESSURE LIQUID CHROMATOGRAPHY MARKET, BY COMPONENT, 2018–2027 (USD BILLION)
TABLE 12 EUROPE: LOW-PRESSURE LIQUID CHROMATOGRAPHY MARKET, BY END USER, 2018–2027 (USD BILLION)
TABLE 13 GERMANY: LOW-PRESSURE LIQUID CHROMATOGRAPHY MARKET, BY COMPONENT, 2018–2027 (USD BILLION)
TABLE 14 GERMANY: LOW-PRESSURE LIQUID CHROMATOGRAPHY MARKET, BY END USER, 2018–2027 (USD BILLION)
TABLE 15 FRANCE: LOW-PRESSURE LIQUID CHROMATOGRAPHY MARKET, BY COMPONENT, 2018–2027 (USD BILLION)
TABLE 16 FRANCE: LOW-PRESSURE LIQUID CHROMATOGRAPHY MARKET, BY END USER, 2018–2027 (USD BILLION)
TABLE 17 UK: LOW-PRESSURE LIQUID CHROMATOGRAPHY MARKET, BY COMPONENT, 2018–2027 (USD BILLION)
TABLE 18 UK: LOW-PRESSURE LIQUID CHROMATOGRAPHY MARKET, BY END USER, 2018–2027 (USD BILLION)
TABLE 19 ITALY: LOW-PRESSURE LIQUID CHROMATOGRAPHY MARKET, BY COMPONENT, 2018–2027 (USD BILLION)
TABLE 20 ITALY: LOW-PRESSURE LIQUID CHROMATOGRAPHY MARKET, BY END USER 2018–2027 (USD BILLION)
TABLE 21 SPAIN: LOW-PRESSURE LIQUID CHROMATOGRAPHY MARKET, BY COMPONENT, 2018–2027 (USD BILLION)
TABLE 22 SPAIN: LOW-PRESSURE LIQUID CHROMATOGRAPHY MARKET, BY END USER, 2018–2027 (USD BILLION)
TABLE 23 REST OF EUROPE: LOW-PRESSURE LIQUID CHROMATOGRAPHY MARKET, BY COMPONENT, 2018–2027 (USD BILLION)
TABLE 24 REST OF EUROPE: LOW-PRESSURE LIQUID CHROMATOGRAPHY MARKET, BY END USER, 2018–2027 (USD BILLION)
TABLE 25 ASIA-PACIFIC: LOW-PRESSURE LIQUID CHROMATOGRAPHY MARKET, BY COMPONENT, 2018–2027 (USD BILLION)
TABLE 26 ASIA-PACIFIC: LOW-PRESSURE LIQUID CHROMATOGRAPHY MARKET, BY END USER, 2018–2027 (USD BILLION)
TABLE 27 CHINA: LOW-PRESSURE LIQUID CHROMATOGRAPHY MARKET, BY COMPONENT, 2018–2027 (USD BILLION)
TABLE 28 CHINA: LOW-PRESSURE LIQUID CHROMATOGRAPHY MARKET, BY END USER, 2018–2027 (USD BILLION)
TABLE 29 INDIA: LOW-PRESSURE LIQUID CHROMATOGRAPHY MARKET, BY COMPONENT, 2018–2027 (USD BILLION)
TABLE 30 INDIA: LOW-PRESSURE LIQUID CHROMATOGRAPHY MARKET, BY END USER, 2018–2027 (USD BILLION)
TABLE 31 JAPAN: LOW-PRESSURE LIQUID CHROMATOGRAPHY MARKET, BY COMPONENT, 2018–2027 (USD BILLION)
TABLE 32 JAPAN: LOW-PRESSURE LIQUID CHROMATOGRAPHY MARKET, BY END USER, 2018–2027 (USD BILLION)
TABLE 33 SOUTH KOREA: LOW-PRESSURE LIQUID CHROMATOGRAPHY MARKET, BY COMPONENT, 2018–2027 (USD BILLION)
TABLE 34 SOUTH KOREA: LOW-PRESSURE LIQUID CHROMATOGRAPHY MARKET, BY END USER, 2018–2027 (USD BILLION)
TABLE 35 AUSTRALIA: LOW-PRESSURE LIQUID CHROMATOGRAPHY MARKET, BY COMPONENT, 2018–2027 (USD BILLION)
TABLE 36 AUSTRALIA: LOW-PRESSURE LIQUID CHROMATOGRAPHY MARKET, BY END USER, 2018–2027 (USD BILLION)
TABLE 37 REST OF ASIA-PACIFIC: LOW-PRESSURE LIQUID CHROMATOGRAPHY MARKET, BY COMPONENT, 2018–2027 (USD BILLION)
TABLE 38 REST OF ASIA-PACIFIC: LOW-PRESSURE LIQUID CHROMATOGRAPHY MARKET, BY END USER, 2018–2027 (USD BILLION)
TABLE 39 REST OF THE WORLD: LOW-PRESSURE LIQUID CHROMATOGRAPHY MARKET, BY COMPONENT, 2018–2027 (USD BILLION)
TABLE 40 REST OF THE WORLD: LOW-PRESSURE LIQUID CHROMATOGRAPHY MARKET, BY END USER, 2018–2027 (USD BILLION)
TABLE 41 MIDDLE EAST: LOW-PRESSURE LIQUID CHROMATOGRAPHY MARKET, BY COMPONENT, 2018–2027 (USD BILLION)
TABLE 42 MIDDLE EAST: LOW-PRESSURE LIQUID CHROMATOGRAPHY MARKET, BY END USER, 2018–2027 (USD BILLION)
TABLE 43 AFRICA: LOW-PRESSURE LIQUID CHROMATOGRAPHY MARKET, BY COMPONENT, 2018–2027 (USD BILLION)
TABLE 44 AFRICA: LOW-PRESSURE LIQUID CHROMATOGRAPHY MARKET, BY END USER, 2018–2027 (USD BILLION)
TABLE 45 LATIN AMERICA: LOW-PRESSURE LIQUID CHROMATOGRAPHY MARKET, BY COMPONENT, 2018–2027 (USD BILLION)
TABLE 46 LATIN AMERICA: LOW-PRESSURE LIQUID CHROMATOGRAPHY MARKET, BY END USER, 2018–2027 (USD BILLION)
LIST OF FIGURES
FIGURE 1 RESEARCH PROCESS
FIGURE 2 MARKET STRUCTURE FOR THE GLOBAL LOW-PRESSURE LIQUID CHROMATOGRAPHY MARKET
FIGURE 3 MARKET DYNAMICS FOR THE GLOBAL LOW-PRESSURE LIQUID CHROMATOGRAPHY MARKET
FIGURE 4 GLOBAL LOW-PRESSURE LIQUID CHROMATOGRAPHY MARKET SHARE, BY COMPONENT, 2020 (%)
FIGURE 5 GLOBAL LOW-PRESSURE LIQUID CHROMATOGRAPHY MARKET SHARE, BY END USER, 2020 (%)
FIGURE 6 GLOBAL LOW-PRESSURE LIQUID CHROMATOGRAPHY MARKET SHARE, BY REGION, 2020 (%)
FIGURE 7 NORTH AMERICA LOW-PRESSURE LIQUID CHROMATOGRAPHY MARKET SHARE, BY COMPONENT, 2020 (%)
FIGURE 8 NORTH AMERICA LOW-PRESSURE LIQUID CHROMATOGRAPHY MARKET SHARE, BY END USER, 2020 (%)
FIGURE 9 EUROPE LOW-PRESSURE LIQUID CHROMATOGRAPHY MARKET SHARE, BY COMPONENT, 2020 (%)
FIGURE 10 EUROPE LOW-PRESSURE LIQUID CHROMATOGRAPHY MARKET SHARE, BY END USER, 2020 (%)
FIGURE 11 ASIA-PACIFIC LOW-PRESSURE LIQUID CHROMATOGRAPHY MARKET SHARE, BY COMPONENT, 2020 (%)
FIGURE 12 ASIA-PACIFIC LOW-PRESSURE LIQUID CHROMATOGRAPHY MARKET SHARE, BY END USER, 2020 (%)
FIGURE 13 REST OF THE WORLD LOW-PRESSURE LIQUID CHROMATOGRAPHY MARKET SHARE, BY COMPONENT, 2020 (%)
FIGURE 14 REST OF THE WORLD LOW-PRESSURE LIQUID CHROMATOGRAPHY MARKET SHARE, BY END USER, 2020 (%)
FIGURE 15 NOVASEP: FINANCIAL OVERVIEW
FIGURE 16 NOVASEP: SWOT ANALYSIS
FIGURE 17 LEWA GMBH: FINANCIAL OVERVIEW
FIGURE 18 LEWA GMBH: SWOT ANALYSIS
FIGURE 19 GALAK CHROMATOGRAPHY TECHNOLOGY CO., LTD: FINANCIAL OVERVIEW
FIGURE 20 GALAK CHROMATOGRAPHY TECHNOLOGY CO., LTD: SWOT ANALYSIS
FIGURE 21 BIOLINX LABSYSTEMS.: FINANCIAL OVERVIEW
FIGURE 22 BIOLINX LABSYSTEMS.: SWOT ANALYSIS
FIGURE 23 BIO-RAD LABORATORIES, INC.: FINANCIAL OVERVIEW
FIGURE 24 BIO-RAD LABORATORIES, INC.: SWOT ANALYSIS
FIGURE 25 DANAHER CORPORATION: FINANCIAL OVERVIEW
FIGURE 26 DANAHER CORPORATION: SWOT ANALYSIS
FIGURE 27 NILSAN NISHOTECH SYSTEMS PVT. LTD: FINANCIAL OVERVIEW
FIGURE 28 NILSAN NISHOTECH SYSTEMS PVT. LTD: SWOT ANALYSIS
$8.6 billion
7.3%
North America
2020-2027
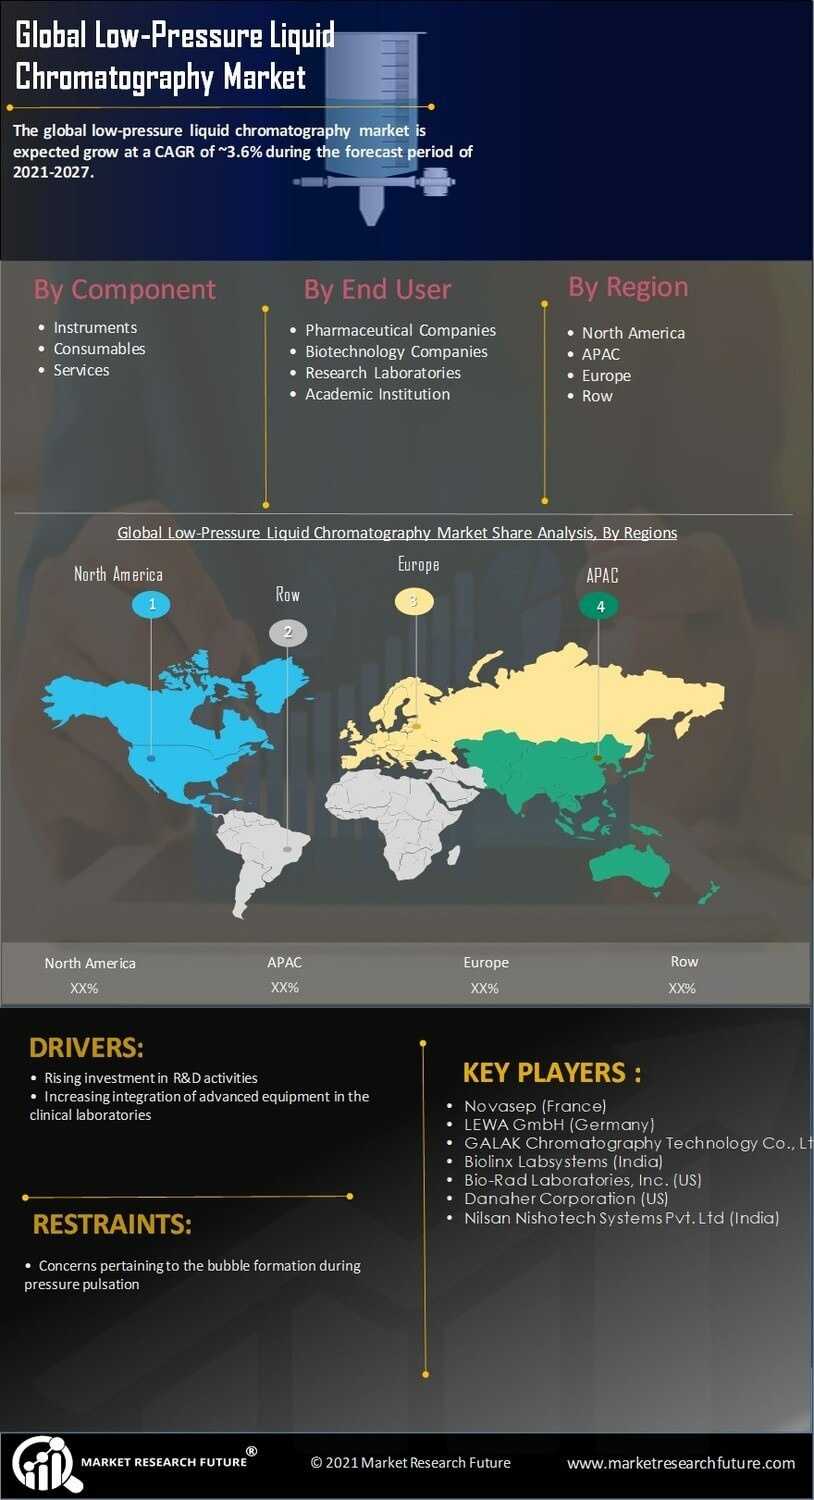
The global low-pressure liquid chromatography market is expected grow at a CAGR of ~3.6% during the forecast period of 2021-2027.
Market Overview:
Low-pressure liquid chromatography (LPLC) is a system that coerces mobile phase through the column at low pressure. The low-pressure liquid chromatography is used to study the characteristics of biomolecules such as peptides, proteins, and monoclonal antibodies. The low-pressure liquid chromatography technique is one of the ideal biomolecule separation techniques for the segregation of recombinant-tagged proteins. In addition, the process is also used to purify active pharmaceutical ingredients, cleanse small & complex samples and eliminate pesticides from test samples. Moreover, the low-pressure liquid chromatography systems are easy to use and are designed to provide desired results. Furthermore, scientists are innovating the low-pressure liquid chromatography process for paclitaxel recovery and purification from plant tissue culture fluid. The market players are deploying an experienced workforce to innovate new technologies for upgrading low-pressure liquid chromatography products.
Increasing investment in drug development, a growing number of R&D facilities, modernization of lab facilities, and supportive government regulatory guidelines are driving the low-pressure liquid chromatography market. Moreover, the market players are involved in business strategies such as partnerships, product launches, service contracts, and association with public and private research institutions. The low-pressure liquid chromatography market is estimated to grow over time owing to the increasing funding in the research infrastructure by the government authorities. The government authorities in the countries such as the US, India, China, and Japan are focusing on modernization and technological advancement of clinical research and drug development infrastructure. These factors are driving the low-pressure liquid chromatography market and are assessed to grow in the projected timeline.
COVID-19 Analysis
The COVID-19 outbreak reduced the development and production of products across different sectors. The pharmaceutical sector and R&D facilities faced a backlash in market demand during the pandemic outbreak. The market players faced a downfall in low-pressure liquid chromatography demand during the first quarter of COVID-19. However, the increasing demand for vaccines and supportive drugs has augmented the market demand. The growing urgency of coronavirus vaccines and life-saving drugs propelled the demand for low-pressure liquid chromatography products. In addition, increasing R&D activities to develop diagnostic and treatment products is driving the low-pressure liquid chromatography market. Moreover, an increasing number of government and drug manufacturers invested in installing equipment that specializes in protein and peptide separation, creating opportunities for the industry players.
Low-pressure liquid chromatography has shown pioneering results in therapeutic research. Vaccine development through protein extraction methodology is one of the major and efficient techniques for SARS-CoV-2 drug development. In addition, the private and public authorities have collaborated to accelerate drug development, creating possibilities for the low-pressure liquid chromatography manufacturers. Moreover, the market players manufactured a large number of low-pressure liquid chromatography to meet the growing needs of R&D activities during a pandemic outbreak. The production and transport of the equipment were done under controlled conditions to prevent the spread of the deadly virus. Furthermore, the pandemic outbreak created financial imbalance among the healthcare research units owing to high investment in drug development activities. The companies under financial stress borrowed the equipment or signed an agreement with the low-pressure liquid chromatography service provider to strengthen and accelerate the research activities.
Market Dynamics
Report Attribute/Metric | Details |
---|---|
Market Size | 2027: USD Million |
CAGR | ~3.6% |
Base Year | 2020 |
Forecast Period | 2021-2027 |
Historical Data | 2018-2019 |
Forecast Units | Value (USD Million) |
Report Coverage | Revenue Forecast, Competitive Landscape, Growth Factors, and Trends |
Segments Covered | Product, End-User |
Geographies Covered | North America, Europe, Asia-Pacific, and Rest of the World |
Key Vendors | Novasep, LEWA GmbH, GALAK Chromatography Technology Co., Ltd, Biolinx Labsystems, Bio-Rad Laboratories, Inc., Danaher Corporation, Nilsan Nishotech Systems Pvt. Ltd |
Key Market Opportunities | • Increasing government investment in R&D activities |
Key Market Drivers | • Rising investment in R&D activities • Increasing integration of advanced equipment in the clinical laboratories |