Request Free Sample ×

Kindly complete the form below to receive a free sample of this Report

* Please use a valid business email

Leading companies partner with us for data-driven Insights

clients tt-cursor
Hero Background

Italy Mobile Radiography Systems Market

ID: MRFR/HC/49035-HCR
200 Pages
Vikita Thakur
Last Updated: April 06, 2026

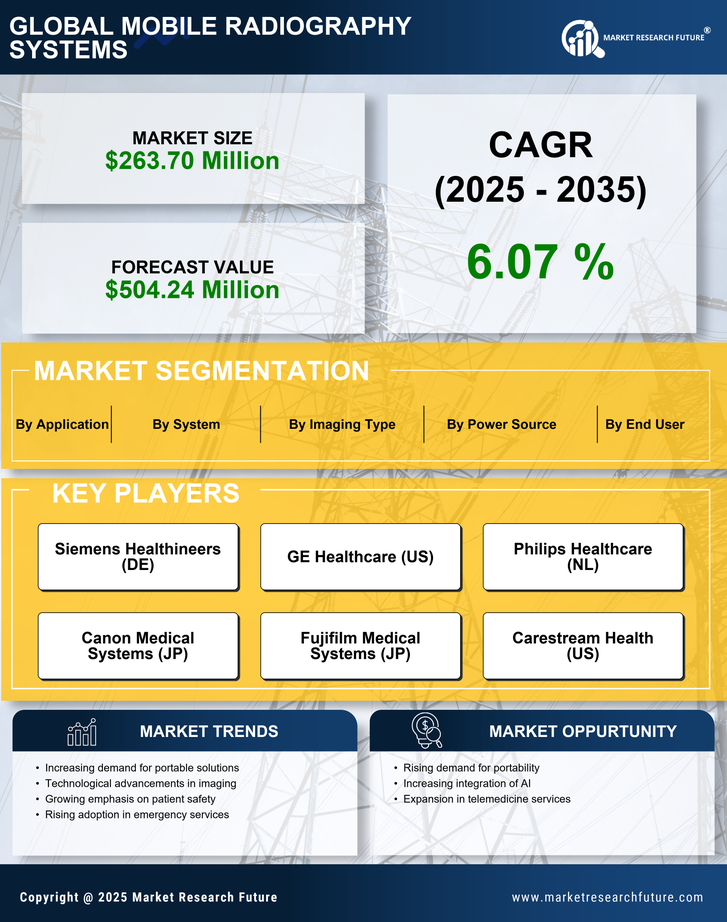
Italy Mobile Radiography Systems Market Research Report: Size, Share, Trend Analysis By Product Type (General radiography system, Computed radiography (CT) system, Fluoroscopy system, The magnetic resonance imaging system, Others), By Power Source (In-line mobile radiography systems, Battery-powered mobile radiography systems), By Imaging Type (Film, Digital), By Applications (Imaging, Orthopedic imaging, Chest imaging, Dental imaging, Others, Image-guided procedures & biopsies) and By End Users (Hospitals & Clinics, Academic & Medical Research Institutes, Diagnostic Centers, Intended Audience, Medical imaging companies, Government and private laboratories, Research and development (R&D) companies, Medical research laboratories, Market research, and consulting service providers) - Growth Outlook & Industry Forecast 2025 To 2035

Share:
Download PDF ×

We do not share your information with anyone. However, we may send you emails based on your report interest from time to time. You may contact us at any time to opt-out.

  1. 1 SECTION I: EXECUTIVE SUMMARY AND KEY HIGHLIGHTS
    1. 1.1 EXECUTIVE SUMMARY
      1. 1.1.1 Market Overview
      2. 1.1.2 Key Findings
      3. 1.1.3 Market Segmentation
      4. 1.1.4 Competitive Landscape
      5. 1.1.5 Challenges and Opportunities
      6. 1.1.6 Future Outlook
  2. 2 SECTION II: SCOPING, METHODOLOGY AND MARKET STRUCTURE
    1. 2.1 MARKET INTRODUCTION
      1. 2.1.1 Definition
      2. 2.1.2 Scope of the study
        1. 2.1.2.1 Research Objective
        2. 2.1.2.2 Assumption
        3. 2.1.2.3 Limitations
    2. 2.2 RESEARCH METHODOLOGY
      1. 2.2.1 Overview
      2. 2.2.2 Data Mining
      3. 2.2.3 Secondary Research
      4. 2.2.4 Primary Research
        1. 2.2.4.1 Primary Interviews and Information Gathering Process
        2. 2.2.4.2 Breakdown of Primary Respondents
      5. 2.2.5 Forecasting Model
      6. 2.2.6 Market Size Estimation
        1. 2.2.6.1 Bottom-Up Approach
        2. 2.2.6.2 Top-Down Approach
      7. 2.2.7 Data Triangulation
      8. 2.2.8 Validation
  3. 3 SECTION III: QUALITATIVE ANALYSIS
    1. 3.1 MARKET DYNAMICS
      1. 3.1.1 Overview
      2. 3.1.2 Drivers
      3. 3.1.3 Restraints
      4. 3.1.4 Opportunities
    2. 3.2 MARKET FACTOR ANALYSIS
      1. 3.2.1 Value chain Analysis
      2. 3.2.2 Porter's Five Forces Analysis
        1. 3.2.2.1 Bargaining Power of Suppliers
        2. 3.2.2.2 Bargaining Power of Buyers
        3. 3.2.2.3 Threat of New Entrants
        4. 3.2.2.4 Threat of Substitutes
        5. 3.2.2.5 Intensity of Rivalry
      3. 3.2.3 COVID-19 Impact Analysis
        1. 3.2.3.1 Market Impact Analysis
        2. 3.2.3.2 Regional Impact
        3. 3.2.3.3 Opportunity and Threat Analysis
  4. 4 SECTION IV: QUANTITATIVE ANALYSIS
    1. 4.1 Life Sciences, BY System (USD Million)
      1. 4.1.1 General radiography system
      2. 4.1.2 Computed radiography (CT) system
      3. 4.1.3 Fluoroscopy system
      4. 4.1.4 Magnetic resonance imaging system
      5. 4.1.5 Others
    2. 4.2 Life Sciences, BY Power Source (USD Million)
      1. 4.2.1 In-line mobile radiography systems
      2. 4.2.2 Battery-powered mobile radiography systems
    3. 4.3 Life Sciences, BY Imaging Type (USD Million)
      1. 4.3.1 Film
      2. 4.3.2 Digital
    4. 4.4 Life Sciences, BY Application (USD Million)
      1. 4.4.1 Imaging
      2. 4.4.2 Image-guided procedures & biopsies
      3. 4.4.3 Orthopedic imaging
      4. 4.4.4 Chest imaging
      5. 4.4.5 Dental imaging
      6. 4.4.6 Others
    5. 4.5 Life Sciences, BY End User (USD Million)
      1. 4.5.1 Hospitals & Clinics
      2. 4.5.2 Academic & Medical Research Institutes
      3. 4.5.3 Diagnostic Centers
  5. 5 SECTION V: COMPETITIVE ANALYSIS
    1. 5.1 Competitive Landscape
      1. 5.1.1 Overview
      2. 5.1.2 Competitive Analysis
      3. 5.1.3 Market share Analysis
      4. 5.1.4 Major Growth Strategy in the Life Sciences
      5. 5.1.5 Competitive Benchmarking
      6. 5.1.6 Leading Players in Terms of Number of Developments in the Life Sciences
      7. 5.1.7 Key developments and growth strategies
        1. 5.1.7.1 New Product Launch/Service Deployment
        2. 5.1.7.2 Merger & Acquisitions
        3. 5.1.7.3 Joint Ventures
      8. 5.1.8 Major Players Financial Matrix
        1. 5.1.8.1 Sales and Operating Income
        2. 5.1.8.2 Major Players R&D Expenditure. 2023
    2. 5.2 Company Profiles
      1. 5.2.1 Siemens Healthineers (DE)
        1. 5.2.1.1 Financial Overview
        2. 5.2.1.2 Products Offered
        3. 5.2.1.3 Key Developments
        4. 5.2.1.4 SWOT Analysis
        5. 5.2.1.5 Key Strategies
      2. 5.2.2 GE Healthcare (US)
        1. 5.2.2.1 Financial Overview
        2. 5.2.2.2 Products Offered
        3. 5.2.2.3 Key Developments
        4. 5.2.2.4 SWOT Analysis
        5. 5.2.2.5 Key Strategies
      3. 5.2.3 Philips Healthcare (NL)
        1. 5.2.3.1 Financial Overview
        2. 5.2.3.2 Products Offered
        3. 5.2.3.3 Key Developments
        4. 5.2.3.4 SWOT Analysis
        5. 5.2.3.5 Key Strategies
      4. 5.2.4 Canon Medical Systems (JP)
        1. 5.2.4.1 Financial Overview
        2. 5.2.4.2 Products Offered
        3. 5.2.4.3 Key Developments
        4. 5.2.4.4 SWOT Analysis
        5. 5.2.4.5 Key Strategies
      5. 5.2.5 Fujifilm Medical Systems (JP)
        1. 5.2.5.1 Financial Overview
        2. 5.2.5.2 Products Offered
        3. 5.2.5.3 Key Developments
        4. 5.2.5.4 SWOT Analysis
        5. 5.2.5.5 Key Strategies
      6. 5.2.6 Carestream Health (US)
        1. 5.2.6.1 Financial Overview
        2. 5.2.6.2 Products Offered
        3. 5.2.6.3 Key Developments
        4. 5.2.6.4 SWOT Analysis
        5. 5.2.6.5 Key Strategies
      7. 5.2.7 Agfa HealthCare (BE)
        1. 5.2.7.1 Financial Overview
        2. 5.2.7.2 Products Offered
        3. 5.2.7.3 Key Developments
        4. 5.2.7.4 SWOT Analysis
        5. 5.2.7.5 Key Strategies
      8. 5.2.8 Hitachi Medical Systems (JP)
        1. 5.2.8.1 Financial Overview
        2. 5.2.8.2 Products Offered
        3. 5.2.8.3 Key Developments
        4. 5.2.8.4 SWOT Analysis
        5. 5.2.8.5 Key Strategies
      9. 5.2.9 Konica Minolta Healthcare (JP)
        1. 5.2.9.1 Financial Overview
        2. 5.2.9.2 Products Offered
        3. 5.2.9.3 Key Developments
        4. 5.2.9.4 SWOT Analysis
        5. 5.2.9.5 Key Strategies
    3. 5.3 Appendix
      1. 5.3.1 References
      2. 5.3.2 Related Reports
  6. 6 LIST OF FIGURES
    1. 6.1 MARKET SYNOPSIS
    2. 6.2 ITALY MARKET ANALYSIS BY SYSTEM
    3. 6.3 ITALY MARKET ANALYSIS BY POWER SOURCE
    4. 6.4 ITALY MARKET ANALYSIS BY IMAGING TYPE
    5. 6.5 ITALY MARKET ANALYSIS BY APPLICATION
    6. 6.6 ITALY MARKET ANALYSIS BY END USER
    7. 6.7 KEY BUYING CRITERIA OF LIFE SCIENCES
    8. 6.8 RESEARCH PROCESS OF MRFR
    9. 6.9 DRO ANALYSIS OF LIFE SCIENCES
    10. 6.10 DRIVERS IMPACT ANALYSIS: LIFE SCIENCES
    11. 6.11 RESTRAINTS IMPACT ANALYSIS: LIFE SCIENCES
    12. 6.12 SUPPLY / VALUE CHAIN: LIFE SCIENCES
    13. 6.13 LIFE SCIENCES, BY SYSTEM, 2024 (% SHARE)
    14. 6.14 LIFE SCIENCES, BY SYSTEM, 2024 TO 2035 (USD Million)
    15. 6.15 LIFE SCIENCES, BY POWER SOURCE, 2024 (% SHARE)
    16. 6.16 LIFE SCIENCES, BY POWER SOURCE, 2024 TO 2035 (USD Million)
    17. 6.17 LIFE SCIENCES, BY IMAGING TYPE, 2024 (% SHARE)
    18. 6.18 LIFE SCIENCES, BY IMAGING TYPE, 2024 TO 2035 (USD Million)
    19. 6.19 LIFE SCIENCES, BY APPLICATION, 2024 (% SHARE)
    20. 6.20 LIFE SCIENCES, BY APPLICATION, 2024 TO 2035 (USD Million)
    21. 6.21 LIFE SCIENCES, BY END USER, 2024 (% SHARE)
    22. 6.22 LIFE SCIENCES, BY END USER, 2024 TO 2035 (USD Million)
    23. 6.23 BENCHMARKING OF MAJOR COMPETITORS
  7. 7 LIST OF TABLES
    1. 7.1 LIST OF ASSUMPTIONS
  8. 7.1.1
    1. 7.2 Italy MARKET SIZE ESTIMATES; FORECAST
      1. 7.2.1 BY SYSTEM, 2025-2035 (USD Million)
      2. 7.2.2 BY POWER SOURCE, 2025-2035 (USD Million)
      3. 7.2.3 BY IMAGING TYPE, 2025-2035 (USD Million)
      4. 7.2.4 BY APPLICATION, 2025-2035 (USD Million)
      5. 7.2.5 BY END USER, 2025-2035 (USD Million)
    2. 7.3 PRODUCT LAUNCH/PRODUCT DEVELOPMENT/APPROVAL
  9. 7.3.1
    1. 7.4 ACQUISITION/PARTNERSHIP
  10. 7.4.1

Italy Life Sciences Market Segmentation

Life Sciences By System (USD Million, 2025-2035)

  • General radiography system
  • Computed radiography (CT) system
  • Fluoroscopy system
  • Magnetic resonance imaging system
  • Others

Life Sciences By Power Source (USD Million, 2025-2035)

  • In-line mobile radiography systems
  • Battery-powered mobile radiography systems

Life Sciences By Imaging Type (USD Million, 2025-2035)

  • Film
  • Digital

Life Sciences By Application (USD Million, 2025-2035)

  • Imaging
  • Image-guided procedures & biopsies
  • Orthopedic imaging
  • Chest imaging
  • Dental imaging
  • Others

Life Sciences By End User (USD Million, 2025-2035)

  • Hospitals & Clinics
  • Academic & Medical Research Institutes
  • Diagnostic Centers

Compare Licence

×
Features License Type
Single User Multiuser License Enterprise User
Price $4,950 $5,950 $7,250
Maximum User Access Limit 1 User Upto 10 Users Unrestricted Access Throughout the Organization
Free Customization
Direct Access to Analyst
Deliverable Format
Platform Access
Discount on Next Purchase 10% 15% 15%
Printable Versions