Industrial Wastewater Treatment Market (2026 - 2035)

Industrial Wastewater Treatment Market Research Report Information By Treatment Technology (MBR (Membrane Bioreactor), Activated Sludge / Biological Treatment, ZLD (Zero Liquid Discharge) Systems, Chemical Treatment, Physical / Mechanical Treatment), By End-Use Industry (Chemical & Petrochemical, Power Generation, Food & Beverage, Metal & Mining, Pharmaceutical, Textiles), By Treatment Stage (Primary Treatment, Secondary Treatment, Tertiary / Advanced Treatment) and By Regional (North America, Europe, South America, Asia Pacific, Middle East and Africa) - Industry Forecast to 2035
ID: MRFR/EnP/24009-HCR
100 Pages
Priya Nagrale
Last Updated: June 05, 2026
Industrial Wastewater Treatment Market

Market Size

Forecast Period2026-2035
CAGR (2026-2035)6.35%
2025 Market SizeUSD 15.80 Billion
2035 Market SizeUSD 27.45 Billion

Key Players

Veolia Environnement
SUEZ
Evoqua Water Technologies
Kurita Water Industries
Thermax Limited
Aquatech International
Opportunities
  • Digital Twins and AI-Optimized Treatment
  • Decentralized Treatment for Emerging-Market Industrial Parks
  • Resource Recovery and Circular-Economy Revenue
 

Industrial Wastewater Treatment Market Summary

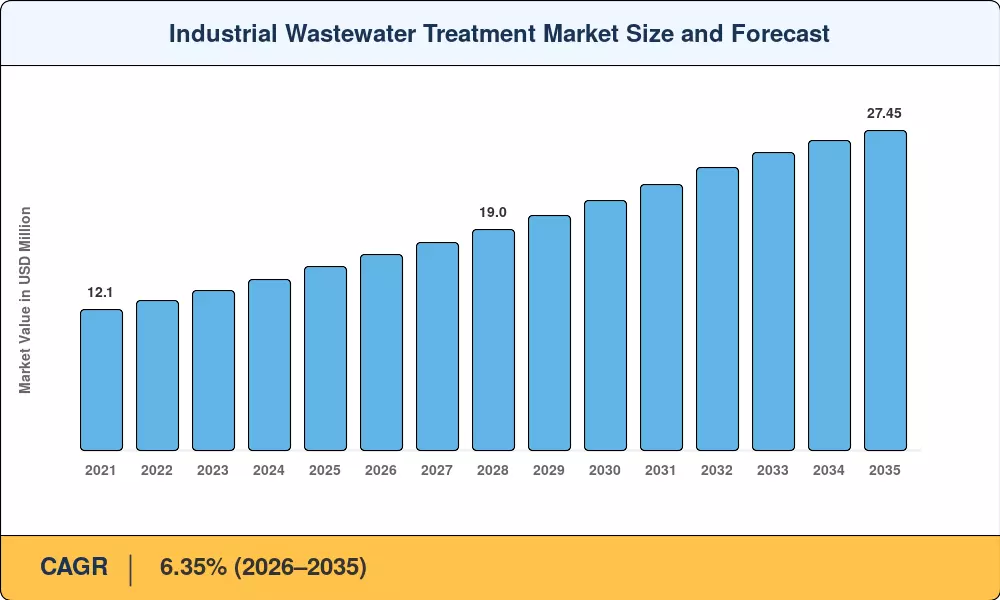
The Industrial Wastewater Treatment Market was valued at approximately USD 15.80 billion in 2025 and is projected to reach USD 16.80 billion in 2026 before climbing to USD 27.45 billion by 2035, registering a CAGR of 6.35% during the 2026–2035 forecast period. Tightening discharge regulations — including the U.S. EPA's updated Effluent Limitation Guidelines and the EU's revised Industrial Emissions Directive (IED) — are forcing manufacturers to upgrade aging effluent treatment plant ETP industrial systems. China's 14th Five-Year Plan alone earmarks over USD 45 billion in water infrastructure spending through 2027, a sizable portion of which targets heavy metal removal industrial wastewater facilities across steel, textile, and electroplating clusters [2][3].

A technical change is transforming how factories manage process water. Advanced MBR membrane bioreactor industrial wastewater configurations, ZLD zero liquid discharge industrial systems and hybrid biological treatment aerobic anaerobic industrial reactors that reduce sludge quantities by 30-40% are replacing conventional clarifying and chemical dosing setups. Since 2022, GE Water (now SUEZ), Veolia and Evoqua have invested more than USD 1.2 billion in membrane and digital-monitoring R&D [4][5]. With these platforms, wastewater plants can monitor COD/BOD in real-time, undertake predictive maintenance and remote dosing, changing wastewater facilities from cost centers into resource recovery hubs.

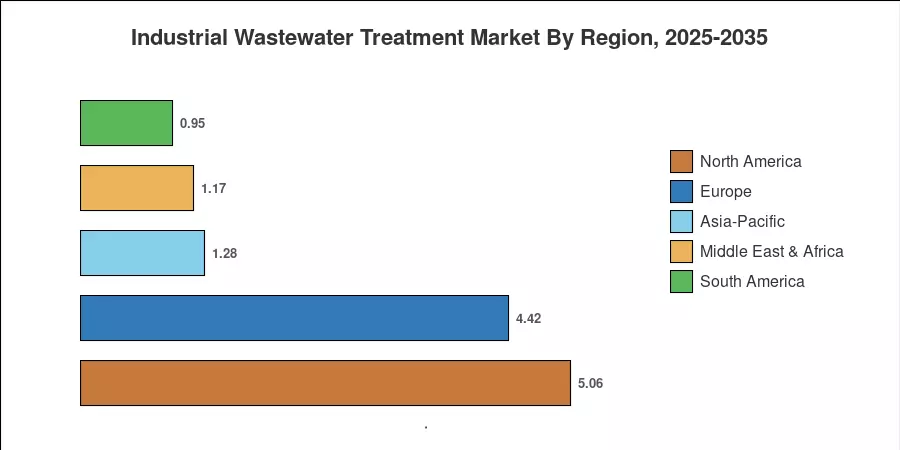
North America holds the highest share of the Industrial Wastewater Treatment Market at over 32%, driven by stringent NPDES licenses and shale-gas produced-water regulations. Asia-Pacific is the fastest expanding market at 8.1% CAGR, driven by rising development in India and Southeast Asia and strong industrial wastewater reuse recycling laws. The second greatest position is Europe with a share of about 28%, which is mainly supported by the EU Water Framework Directive and circular-economy ambitions, which need near-total industrial wastewater reuse recycling by 2030 [6][7].


Key Report Takeaways

• By Technology

  • MBR membrane bioreactor industrial wastewater systems hold the largest technology share at approximately 24% of the Industrial Wastewater Treatment Market, reflecting superior effluent quality and compact footprint
  • ZLD zero liquid discharge industrial solutions are the fastest-growing technology segment at a 9.2% CAGR, driven by water-scarce regions mandating near-complete recovery
  • Biological treatment, aerobic anaerobic industrial processes account for an estimated USD 3.65 billion in 2025, supported by food & beverage and pulp & paper sectors

• By Sector

  • Chemical & petrochemical end users represent the dominant sector in the Industrial Wastewater Treatment Market, contributing roughly 22% of total demand
  • Power generation facilities are expanding effluent treatment plant ETP industrial capacity at an 7.8% CAGR to meet ash-pond closure deadlines

• By Region

  • North America leads the Industrial Wastewater Treatment Market in absolute value, exceeding USD 5.05 billion in 2025
  • India is the fastest-growing country-level market with a projected CAGR of 9.4%, reflecting both regulatory tightening and greenfield capacity expansion


Market Size and Forecast (2021–2035)

MRFR's sizing model triangulates bottom-up plant-level capex/opex data, top-down industry output correlations, and company-reported revenue allocations. Historical figures (2021–2024) draw on audited financials and government statistical yearbooks; forecast values (2026–2035) integrate regulatory scenario modeling and technology adoption curves for the Industrial Wastewater Treatment Market.

Industrial Wastewater Treatment Market Size and Forecast
Our Impact
Enabled $4.3B Revenue Impact for Fortune 500 and Leading Multinationals
Partnering with 2000+ Global Organizations Each Year
30K+ Citations by Top-Tier Firms in the Industry
 

Driver Impact Analysis

Driver ~% Impact on CAGR Geographic Relevance Impact Timeline
Stricter discharge & PFAS regulations +1.8% North America, Europe Short-term (≤2 yr)
ZLD zero liquid discharge industrial mandates +1.4% Asia-Pacific, MEA Medium-term (2–4 yr)
Heavy metal removal in industrial wastewater tech upgrades +0.9% Global Medium-term (2–4 yr)
Industrial wastewater reuse recycling economics +1.1% Asia-Pacific, Europe Long-term (≥4 yr)
MBR membrane bioreactor industrial wastewater cost declines +0.8% Global Medium-term (2–4 yr)
Digital monitoring & AI-driven process control +0.6% North America, Europe Long-term (≥4 yr)
Emerging-market industrialization +0.7% South Asia, Africa Long-term (≥4 yr)


Regulatory Tightening on PFAS and Persistent Pollutants

The U.S. EPA finalized the National Primary Drinking Water Regulation, setting legally enforceable maximum contaminant levels at 4.0 parts per trillion for PFOA and PFOS. Capital strategies center on granular activated carbon, ion exchange, and reverse osmosis. To facilitate nationwide infrastructure compliance, the EPA allocates billions in federal grant funding specifically toward managing emerging contaminants across public drinking water systems.


ZLD Mandates in Water-Stressed Geographies

India's National Green Tribunal vigorously enforces mandatory zero liquid discharge setups across heavily polluting industrial sectors, specifically targeting massive textile dyeing clusters operating within Tamil Nadu and Gujarat. To eliminate untreated effluent runoff, regional compliance frameworks demand that industrial facilities operate unified common effluent treatment plants. These infrastructure guidelines force manufacturers to substitute traditional freshwater intake with intensive thermal evaporation and crystallizer setups.


MBR Membrane Cost Deflation

Between 2018 and 2024, the per-unit cost of hollow-fiber MBR membrane bioreactor industrial wastewater modules declined by 35%, according to BlueTech Research, dropping below USD 40/m² for PVDF configurations [7]. This cost curve has unlocked mid-sized industrial adopters — food processors, breweries, and pharmaceutical plants — who previously relied on conventional activated sludge. The Industrial Wastewater Treatment Market is seeing MBR penetration rise from 15% to a projected 28% of new installations by 2030.

Industrial Water Reuse as an Economic Imperative

Rising regional tariffs drive industrial water reuse as an essential corporate cost-containment strategy. In Singapore, the national water agency, PUB, prices standard domestic potable water up to 4.39 Singapore dollars per cubic meter for heavy consumption, whereas recycled NEWater remains highly subsidized for commercial wafer fabrication and industrial processing plants. Globally, the United Nations prioritizes safe wastewater circularity to reduce escalating freshwater withdrawal strains.


Restraints Impact Analysis

The restraints below slow adoption or compress margins within the Industrial Wastewater Treatment Market. Impact figures are directional and not linearly subtracted from the headline CAGR.

Restraint ~% Impact on CAGR Geographic Relevance Impact Timeline
High capex for advanced systems (ZLD, MBR) –1.2% Emerging markets Short-term (≤2 yr)
Energy-intensive treatment processes –0.7% Global Medium-term (2–4 yr)
Skilled operator shortage –0.5% Asia-Pacific, Africa Long-term (≥4 yr)
Inconsistent enforcement in developing nations –0.6% South Asia, Africa Medium-term (2–4 yr)
Brine/sludge disposal challenges –0.4% Global Long-term (≥4 yr)


Capital Intensity of Advanced Treatment Platforms

Advanced zero liquid discharge technologies demand large amounts of capital upfront, providing serious challenges to adoption for small and medium firms. The UN says smaller factories in developing regions are significantly hampered in updating their wastewater treatment plants by a lack of access to cheap project finance. The large capital expenses thereby lengthen the payback times in the corporate sector, leaving the smaller industrial operators dependent on substantially subsidized municipal water supply.


Energy Consumption and Carbon Footprint Trade-Offs

Thermal evaporation platforms require intensive electrical power, consuming significantly more energy per cubic meter than standard biological or anaerobic alternatives. This heavy power demand directly increases indirect emissions, complicating a facility's ability to achieve strict corporate Scope 2 decarbonization targets. Furthermore, the European Union's Carbon Border Adjustment Mechanism enforces strict monitoring of industrial emissions, penalizing carbon-intensive manufacturing methods globally.


Workforce Gaps and Operational Complexity

Advanced membrane bioreactor installations and specialized heavy metal removal systems require highly skilled technical personnel. However, the United States Environmental Protection Agency highlights critical water sector workforce vulnerabilities, noting that a significant percentage of certified operators will soon reach retirement eligibility. This emerging global labor gap leaves facilities lacking trained technicians, leading to operational underperformance and inflated technology lifecycle costs.


Industrial Wastewater Treatment Market Opportunities

Digital Twins and AI-Optimized Treatment

Real-time digital twins of effluent treatment plants leverage advanced predictive algorithms to optimize facility parameters continuously. Utilities deploying these smart water technologies successfully reduce excessive chemical overdosing, safely protecting downward infrastructure assets. Integrating machine-learning models with standard supervisory control and data acquisition data enables predictive membrane fouling management for bioreactor systems, shifting equipment vendors toward high-margin software service models.


Decentralized Treatment for Emerging-Market Industrial Parks

Under the federal BHAVYA infrastructure initiative, India is spearheading one hundred smart, plug-and-play industrial parks requiring rapid regional wastewater deployments. These manufacturing hubs, alongside expanding industrial zones across emerging economies, utilize modular, containerized effluent treatment systems. Deploying standardized package plants combines biological reactors with advanced ultrafiltration membranes, accelerating infrastructure readiness on greenfield development sites globally


Resource Recovery and Circular-Economy Revenue

Industrial heavy metal removal platforms increasingly utilize advanced, selective ion-exchange resins capable of extracting copper, nickel, and zinc at exceptionally high purities. This specialized chemical isolation allows factories to reclaim raw material assets directly from highly concentrated electroplating streams. Consequently, circular-economy initiatives turn industrial wastewater treatment installations from static cost centers into valuable, resource-generating facilities.


PFAS Destruction Technologies

Sovereign environmental agencies classify supercritical water oxidation as a premier technology for permanently neutralizing persistent organic pollutants. Unlike conventional adsorption methods that merely concentrate chemical waste, these high-pressure platforms demonstrate a verified destruction efficiency exceeding 99.9%. This definitive mineralization breaks stubborn carbon-fluorine bonds, establishing a highly critical, technologically advanced growth sector globally.


Industrial Wastewater Treatment Market Future Outlook

AI-Driven Autonomous Treatment Plants

Industrial facility operators are increasingly integrating advanced automated control loops within new effluent treatment plants to streamline global resource management. These intelligent software setups continuously monitor biological parameters, optimizing aerator power and chemical dosing without manual intervention. This data-driven transformation allows facilities to reduce routine localized operating expenditures by up to 20%, driving long-term equipment purchases toward software analytics depth.


Electrification and Electrochemical Treatment

Advanced electrochemical oxidation, capacitive deionization, and specialized electrodialysis platforms are gaining traction as energy-efficient alternatives to traditional thermal evaporation. The United States Department of Energy's industrial decarbonization frameworks actively guide public funding toward scalable electrification technologies. These systems extract heavy metals from complex mining and semiconductor wastewater streams, bypassing intensive boiling processes while significantly lowering facility Scope 2 carbon footprint metrics.


ESG Reporting and Water-Stewardship Disclosure

The European Union's Corporate Sustainability Reporting Directive actively mandates rigorous water disclosures, impacting roughly 50,000 large multinational corporations. Under these binding ESG frameworks, companies must meticulously track and publish their total annual water consumption metrics in cubic meters. Investing in comprehensive on-site wastewater recycling systems dramatically improves a manufacturer's freshwater-intensity ratios, directly determining ongoing corporate access to favorable global green capital financing.


Industrial Wastewater Treatment Market Segmentation

By Treatment Technology

Segment Metric Primary Demand Driver
MBR (Membrane Bioreactor) ~24% share Superior effluent quality; compact footprint
Activated Sludge / Biological USD 3.65 B (2025) Food & beverage; pulp & paper COD loads
ZLD Systems 9.2% CAGR Water scarcity mandates; heavy metal recovery
Chemical Treatment ~18% share Quick deployment for heavy metal removal
Physical / Mechanical USD 2.10 B (2025) Primary screening and sedimentation needs


MBR membrane bioreactor industrial wastewater technology dominates the Industrial Wastewater Treatment Market by share, delivering treated-water quality that meets direct-reuse standards (TSS < 1 mg/L, turbidity < 0.5 NTU) in a single step. The technology is particularly popular in pharmaceutical and electronics manufacturing, where effluent must meet stringent biological treatment aerobic anaerobic industrial removal thresholds for nitrogen and phosphorus. Membrane costs continue to fall, and hybrid MBR-RO trains now achieve water recovery rates above 90%.

ZLD zero liquid discharge industrial systems, though smaller in absolute terms, represent the fastest-growing technology segment. Thermal brine concentrators paired with crystallizers can handle TDS levels exceeding 100,000 mg/L, making them indispensable for textile dyeing, thermal power, and petrochemical applications. Rising freshwater tariffs and stricter effluent norms ensure that the Industrial Wastewater Treatment Market sees accelerating ZLD adoption across Asia-Pacific and the Middle East.

By End-Use Industry

Segment Metric Primary Demand Driver
Chemical & Petrochemical ~22% share Complex organic/inorganic pollutant mix
Power Generation 7.8% CAGR Coal ash-pond closure; FGD wastewater
Food & Beverage USD 2.85 B (2025) High BOD/COD; reuse for process water
Metal & Mining ~14% share Acid mine drainage; heavy metal removal in industrial wastewater
Pharmaceutical 8.5% CAGR API residue; emerging micro-pollutant regulation
Textiles ~9% share Dye and salt loads; ZLD mandates in India


The chemical and petrochemical sector generates the most complex waste streams in the Industrial Wastewater Treatment Market, with high concentrations of phenols, cyanides, and heavy metals requiring multi-stage treatment trains combining chemical oxidation, biological treatment, aerobic anaerobic industrial reactors, and polishing filtration. Capital spending in this sector is correlated with refinery turnaround cycles, which have accelerated post-pandemic.

Food and beverage manufacturers are the third-largest spenders, driven by high organic loadings (BOD often exceeding 5,000 mg/L) that lend themselves to anaerobic digestion with biogas recovery. Industrial wastewater reuse recycling in brewing and dairy processing is increasingly common, with treated effluent meeting CIP (clean-in-place) rinse-water standards and reducing freshwater intake by 40–50%.

By Treatment Stage

Segment Metric Primary Demand Driver
Primary Treatment ~20% share Screening, sedimentation and equalization
Secondary Treatment USD 6.50 B (2025) Biological COD/BOD removal
Tertiary / Advanced Treatment 7.9% CAGR Reuse-grade quality; nutrient removal


Tertiary and advanced treatment is the fastest-growing stage segment in the Industrial Wastewater Treatment Market, reflecting the global push toward industrial wastewater reuse and recycling. Processes including ultrafiltration, reverse osmosis, and UV/ozone disinfection convert secondary effluent into process-grade or even potable-grade water. Biological treatment, aerobic anaerobic industrial systems at the secondary stage, remain the volume backbone, but value-add is migrating downstream.


Regional Market Share Analysis

Region Metric Primary Investment Themes
North America ~32% share (2025) PFAS compliance, shale-water treatment, biological treatment, aerobic anaerobic industrial upgrades
Europe ~28% share (2025) IED compliance, circular economy, industrial wastewater reuse and recycling
Asia-Pacific 8.1% CAGR (2026–2035) ZLD mandates, FDI-driven manufacturing, and heavy metal removal in industrial wastewater
South America USD 0.95 B (2025) Mining effluent, pulp & paper, regulatory catch-up
Middle East & Africa 7.4% CAGR (2026–2035) Desalination brine, petrochemical expansion and water scarcity
Total USD 15.80 B (2025)

The Industrial Wastewater Treatment Market displays clear regional asymmetry, with mature regulatory regimes in North America and Europe anchoring current demand while Asia-Pacific and the Middle East & Africa drive incremental growth through new industrial capacity and ZLD zero liquid discharge industrial mandates.


North America

Country Metric Key Driver
United States ~78% of regional share EPA ELG & PFAS rules
Canada USD 0.62 B (2025) Oil-sands produced water
Mexico 6.8% CAGR Nearshoring manufacturing boom


The United States accounts for the bulk of North American spending in the Industrial Wastewater Treatment Market, with the EPA's 2024 PFAS rule and tightened steam-electric ELGs compelling coal and gas utilities to install advanced heavy metal removal industrial wastewater systems. Canada's oil-sands operators are investing in evaporator-crystallizer combinations for tailings-pond remediation under Alberta's Tailings Management Framework, while Mexico's automotive and electronics corridors in Nuevo León and Jalisco are adding effluent treatment plant ETP industrial capacity to meet export-market sustainability certifications [3][16].

Europe

Country Metric Key Driver
Germany ~24% of regional share Chemical-sector BAT compliance
United Kingdom USD 0.68 B (2025) Thames Tideway and CSO regulation
France 5.9% CAGR Agri-food industry upgrades


Europe's Industrial Wastewater Treatment Market benefits from the EU's Best Available Techniques (BAT) reference documents, which set binding emission limits for 30+ industrial sectors. Germany's chemical corridor along the Rhine is retrofitting MBR membrane bioreactor industrial wastewater units to meet BAT-AEL limits on AOX and COD, while the UK's Environment Agency is mandating industrial wastewater reuse recycling for water-stressed catchments in southeast England [7][17].

Asia-Pacific

Country Metric Key Driver
China ~38% of regional share 14th Five-Year Plan water targets
India 9.4% CAGR ZLD and CETP mandates
Japan USD 1.10 B (2025) Semiconductor fab ultrapure-water recycling


Asia-Pacific is the engine of expansion for the Industrial Wastewater Treatment Market. China's Ministry of Ecology and Environment now requires real-time effluent monitoring at all industrial parks. At the same time, India's National Green Tribunal continues to enforce ZLD zero liquid discharge industrial compliance in the textile, tannery, and distillery sectors. Japan's semiconductor fabs in Kumamoto and Hokkaido are installing closed-loop industrial wastewater reuse recycling systems to secure ultrapure-water supplies amid regional drought risk [2][4][18].

South America

Country Metric Key Driver
Brazil ~52% of regional share Mining & ethanol sector effluent
Chile 7.1% CAGR Copper mining acid-mine drainage


Brazil's mining giants Vale and CSN are under judicial orders to install heavy metal removal industrial wastewater systems at tailings-dam discharge points following the Mariana and Brumadinho disasters. Chile's copper sector faces tightening norms on acid-mine drainage and is piloting biological treatment, aerobic anaerobic industrial processes for sulfate reduction in the Atacama [19].

Middle East & Africa

Country Metric Key Driver
Saudi Arabia ~35% of regional share MODON industrial-city mandates
UAE 7.6% CAGR Petrochemical and aluminum smelting


Saudi Arabia's MODON authority mandates tertiary-treated effluent standards for all tenants in industrial cities, pushing the adoption of MBR membrane bioreactor industrial wastewater and ZLD zero liquid discharge industrial platforms. The UAE's aluminum smelters in Jebel Ali are upgrading to closed-loop fluoride-removal systems to meet evolving federal discharge standards, expanding the Industrial Wastewater Treatment Market in the Gulf [20].


Industrial Wastewater Treatment Market By Region, 2025-2035
 

Competitive Benchmarking

The Industrial Wastewater Treatment Market is moderately fragmented, with an estimated HHI of ~600 and the top five companies holding roughly 28–33% combined share. Global engineering firms compete alongside regional specialists and emerging technology disruptors. Competitive differentiation increasingly hinges on digital capabilities, WaaS contract offerings, and heavy metal removal industrial wastewater IP portfolios.

Company Est. Revenue Share Range Key Offerings for Industrial Wastewater Treatment Market Strategic Positioning
Veolia Environnement ~7–10% Full-spectrum ETP, MBR, ZLD, digital solutions Integrated utility; global scale
SUEZ (now Veolia Water Technologies) ~5–8% Membrane systems, biological treatment, sludge mgmt Technology-led; strong EU base
Evoqua Water Technologies (Xylem) ~4–7% Electrochemical, MBR, mobile treatment US-centric; service-contract focus
Kurita Water Industries ~3–5% Chemical treatment, boiler water, reuse Japan anchor; semiconductor niche
Thermax Limited ~2–4% ZLD, biological, chemical treatment India-focused; cost-competitive
Aquatech International ~2–3% ZLD zero liquid discharge industrial desalination ZLD specialist; emerging-market reach
Pall Corporation (Danaher) ~2–3% Membrane filtration, MBR modules OEM component supplier
Ecolab ~2–3% Chemical dosing, monitoring and reuse programs Cross-sell from the hygiene portfolio
Nijhuis Saur Industries ~1–2% Biological, DAF, food & beverage solutions EU mid-market specialist
Gradiant Corporation ~1–2% Selective contaminant removal, WaaS Technology disruptor; VC-backed


Recent News & Developments


  • Veolia Group (2026): In 2026, Veolia Group completed the acquisition of remediation firm Enviropacific for $154 million to scale up its advanced oxidation process services targeting global PFAS contamination markets.
  • Ecolab Inc. (2026): In March 2026, Ecolab Inc. executed a $4.75 billion acquisition of CoolIT Systems, integrating its industrial water optimization software to manage wastewater and hyperscale cooling demands inside AI data centers.
  • DuPont (2025): In 2025, DuPont Water Solutions launched its FilmTec Fortilife XC-Max elements, a high-efficiency ultra-pure membrane system designed to help heavy industries optimize Zero Liquid Discharge wastewater reuse.
  • U.S. EPA (April 2024): Finalized national PFAS drinking-water limits at 4 ppt for PFOA/PFOS, triggering pre-treatment upgrade planning across the Industrial Wastewater Treatment Market [Ref 8].


Industrial Wastewater Treatment Market Report Scope

Parameter Detail
Market Scope Global Industrial Wastewater Treatment Market — equipment, chemicals, services, digital platforms
Study Period 2021–2035
CAGR 6.35% (2026–2035)
Base Year Market Size USD 15.80 Billion (2025)
Forecast Endpoint USD 27.45 Billion (2035)
Fastest Growing Segment ZLD zero liquid discharge industrial systems (9.2% CAGR)
Companies Profiled Veolia, SUEZ, Evoqua (Xylem), Kurita, Thermax, Aquatech, Pall (Danaher), Ecolab, Nijhuis Saur, Gradiant
Valuation Currency USD (constant 2025 dollars)


FAQs

How does the total cost of ownership for ZLD compare with conventional discharge-and-treat models over a 15-year plant life?

ZLD total cost of ownership runs 2.5–3.5× higher than conventional discharge systems over 15 years, but freshwater savings and recovered-salt revenues offset 30–40% of the premium in water-scarce regions. Facilities treating above 2,000 m³/day typically reach cost parity faster [Ref 11].

What contractual structures are emerging for industrial wastewater treatment outsourcing?

Water-as-a-Service (WaaS) contracts now bundle design, build, and operate phases under a per-cubic-meter fee with guaranteed effluent quality. These OPEX models reduce upfront capex by 80–90% and include performance penalties tied to COD/BOD exceedances [Ref 23].

Which membrane chemistries are displacing PVDF in MBR applications for corrosive industrial streams?

Ceramic membranes (alumina and silicon carbide) are gaining share for high-temperature and solvent-rich streams, offering 3× longer service life than PVDF at pH extremes below 2 or above 12. Adoption remains limited by 4–5× higher unit costs [Ref 7].

How are semiconductor fabs addressing ultrapure-water recovery from CMP slurry wastewater?

Fabs now deploy integrated coagulation-UF-RO trains to recover 85–90% of CMP wastewater as ultrapure-grade feed, reducing freshwater intake per wafer by up to 35%. Silica and ceria particles are simultaneously recovered for partial reuse [Ref 18].

What role does anaerobic digestion play in offsetting the energy costs of industrial wastewater treatment plants?

Anaerobic digesters at food and beverage ETPs generate 0.35–0.50 m³ of biogas per kg of COD removed, covering 40–60% of on-site electricity demand. Combined heat-and-power configurations push energy self-sufficiency above 70% in large breweries [Ref 9].

How do carbon-credit markets interact with industrial wastewater methane capture?

Verified methane-avoidance credits from covered anaerobic lagoons trade at USD 8–15 per tonne CO₂e under Verra's VCS methodology. A 10,000 m³/day palm-oil mill ETP can generate 4,000–6,000 credits annually [Ref 12].

What cybersecurity risks do connected industrial wastewater treatment systems face under IIoT expansion?

SCADA-connected ETPs face ransomware, data manipulation, and unauthorized dosing-rate alteration threats. NIST's Cybersecurity Framework 2.0 now includes OT-specific water-sector guidance, and insurers increasingly require IEC 62443 compliance for policy coverage [Ref 10].


FAQs

What is the current valuation of the Industrial Wastewater Treatment Market?

The Industrial Wastewater Treatment Market was valued at 40.57 USD Billion in 2024.

What is the projected market valuation for the Industrial Wastewater Treatment Market by 2035?

The market is projected to reach 70.71 USD Billion by 2035.

What is the expected CAGR for the Industrial Wastewater Treatment Market during the forecast period 2025 - 2035?

The expected CAGR for the market during the forecast period 2025 - 2035 is 5.18%.

Which treatment technology segment holds the highest valuation in the Industrial Wastewater Treatment Market?

The Activated Sludge Process segment holds the highest valuation, projected to grow from 10.14 to 18.0 USD Billion.

What are the key industry verticals contributing to the Industrial Wastewater Treatment Market?

Key industry verticals include Chemical and Petrochemical, Food and Beverage, Textile, Pulp and Paper, and Metal and Mining.

How does the valuation of industrial wastewater compare to municipal wastewater?

Industrial wastewater is projected to grow from 20.28 to 35.0 USD Billion, while municipal wastewater is expected to grow from 10.14 to 18.0 USD Billion.

What is the treatment capacity segment with the highest projected valuation?

The 10-100 MGD treatment capacity segment is projected to grow from 15.0 to 25.0 USD Billion.

Which companies are considered key players in the Industrial Wastewater Treatment Market?

Key players include Veolia, SUEZ, Xylem, Evoqua Water Technologies, and Aquatech International.

What is the projected growth for aerobic treatment compared to anaerobic treatment in the market?

Aerobic treatment is projected to grow from 20.28 to 35.36 USD Billion, while anaerobic treatment is expected to grow from 20.29 to 35.35 USD Billion.

What trends are influencing the Industrial Wastewater Treatment Market in 2025?

Trends include increasing regulatory pressures, technological advancements, and a growing focus on sustainability in wastewater management.

Author
Author
Author Profile
Priya Nagrale LinkedIn
Senior Research Analyst
With an experience of over five years in market research industry (Chemicals & Materials domain), I gather and analyze market data from diverse sources to produce results, which are then presented back to a client. Also, provide recommendations based on the findings. As a Senior Research Analyst, I perform quality checks (QC) for market estimations, QC for reports, and handle queries and work extensively on client customizations. Also, handle the responsibilities of client proposals, report planning, report finalization, and execution

Research Approach


Secondary Research

The secondary research process involved comprehensive analysis of regulatory databases, peer-reviewed environmental engineering journals, industry publications, and authoritative environmental organizations. Key sources included the US Environmental Protection Agency (EPA), European Environment Agency (EEA), International Water Association (IWA), Water Environment Federation (WEF), United Nations Environment Programme (UNEP), World Health Organization (WHO) Water Quality Guidelines, OECD Environmental Statistics, World Bank Water Data Portal, UNESCO World Water Assessment Programme, US Geological Survey (USGS) Water Data, EU Water Framework Directive Database, China Ministry of Ecology and Environment, India Central Pollution Control Board (CPCB), and national environmental ministry reports from key markets. These sources were used to collect treatment capacity statistics, regulatory compliance data, technology adoption studies, industrial discharge monitoring reports, and market landscape analysis for activated sludge processes, membrane bioreactors, moving bed biofilm reactors, and other treatment technologies.

Additional authoritative sources included Global Water Intelligence (GWI), International Desalination Association (IDA), American Water Works Association (AWWA), National Association of Clean Water Agencies (NACWA), European Water Association (EWA), Asia-Pacific Water Forum, International Commission on Irrigation and Drainage (ICID), FAO Aquastat Database, IEA World Energy Outlook Water Chapter, and BloombergNEF Water Market Analysis. Industry-specific data was gathered from American Chemistry Council, European Chemical Industry Council (Cefic), World Steel Association, International Council of Forest and Paper Associations (ICFPA), and International Textile Manufacturers Federation (ITMF) to capture vertical-specific wastewater generation patterns and treatment requirements.


Primary Research

Qualitative and quantitative insights were obtained by interviewing supply-side and demand-side stakeholders during the primary research process. Supply-side sources included CEOs, VPs of Technology Development, regulatory compliance heads, and commercial directors from wastewater treatment equipment manufacturers, EPC contractors, and chemical solution providers. Plant managers, environmental health and safety (EHS) directors, procurement leads from chemical and petrochemical facilities, food and beverage processing plants, textile mills, pulp and paper mills, and metal and mining operations constituted demand-side sources. Market segmentation was validated, technology adoption timelines were confirmed, and insights regarding CAPEX/OPEX patterns, regulatory compliance costs, and water reuse implementation strategies were obtained through primary research.

Primary Respondent Breakdown:

By Designation: C-level Primaries (32%), Director Level (30%), Others (38%)

By Region: North America (32%), Europe (29%), Asia-Pacific (34%), Rest of World (5%)


Market Size Estimation

Global market valuation was derived through revenue mapping and treatment capacity analysis. The methodology included:

Identification of 50+ key manufacturers and system integrators across North America, Europe, Asia-Pacific, Latin America, and Middle East & Africa

Technology mapping across activated sludge process, membrane bioreactor, moving bed biofilm reactor, trickling filter, rotating biological contactor, and other advanced treatment categories

Analysis of reported and modeled annual revenues specific to industrial wastewater treatment portfolios

Coverage of manufacturers representing 75-80% of global market share in 2024

Extrapolation using bottom-up (treatment capacity × unit cost by country/region) and top-down (manufacturer revenue validation) approaches to derive segment-specific valuations for chemical/petrochemical, food & beverage, textile, pulp & paper, and metal & mining verticals

The market size was further validated through triangulation with municipal wastewater treatment spending data, industrial water withdrawal statistics, and regulatory enforcement expenditure reports from EPA, EEA, and equivalent bodies in APAC markets.

Download Free Sample

Kindly complete the form below to receive a free sample of this Report

Download PDF ×

We do not share your information with anyone. However, we may send you emails based on your report interest from time to time. You may contact us at any time to opt-out.