SEGMENTATION QUICK REFERENCE
| Dimension | Sub-Segments | Dominant Segment | Fastest Growing Segment |
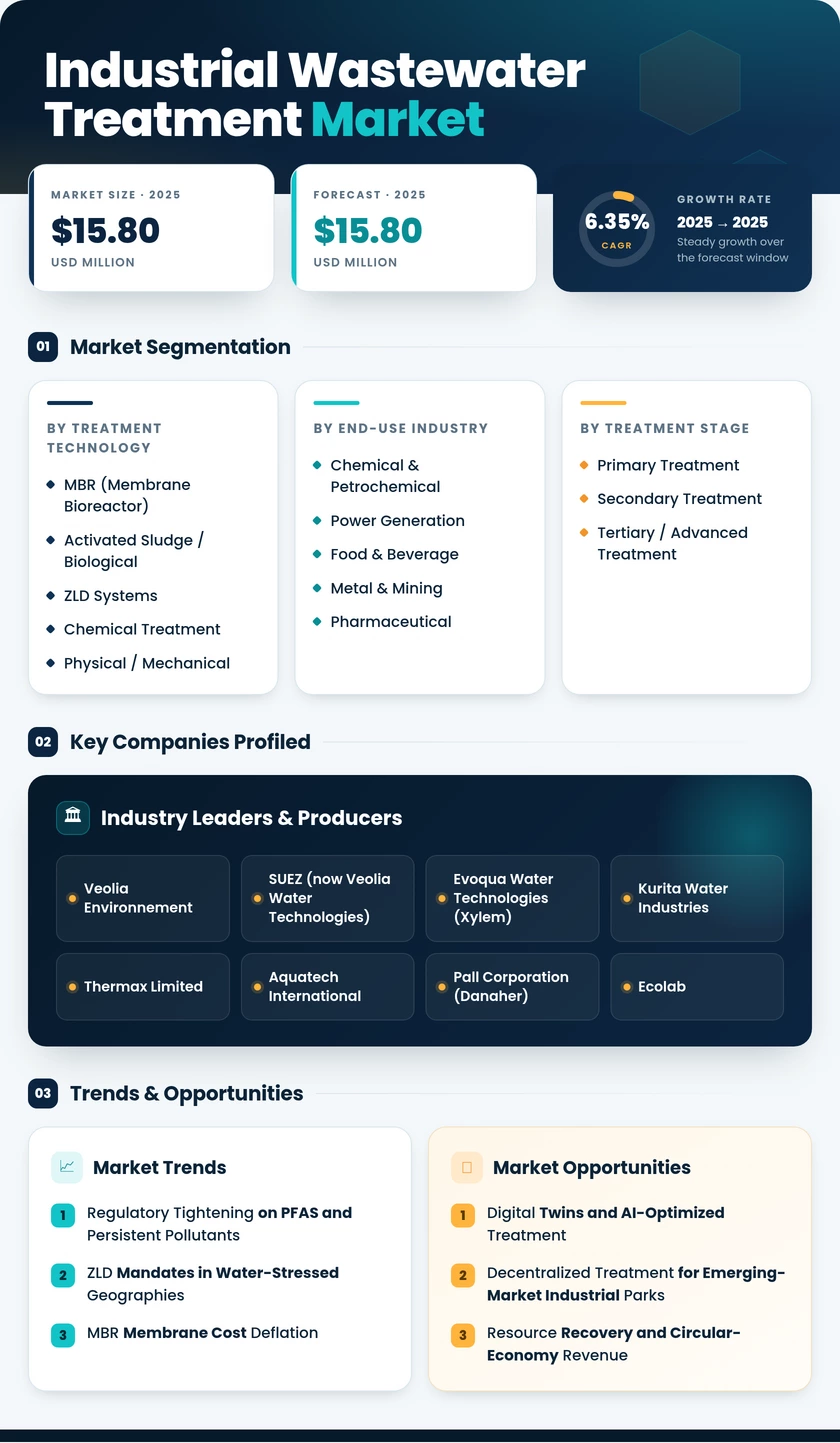
| By Treatment Technology | MBR (Membrane Bioreactor), Activated Sludge / Biological, ZLD Systems, Chemical Treatment, Physical / Mechanical | MBR (Membrane Bioreactor) | ZLD (Zero Liquid Discharge) Systems |
| By End-Use Industry | Chemical & Petrochemical, Power Generation, Food & Beverage, Metal & Mining, Pharmaceutical, Textiles | Chemical & Petrochemical | Pharmaceutical |
| By Treatment Stage | Primary Treatment, Secondary Treatment, Tertiary / Advanced Treatment | Secondary Treatment | Tertiary / Advanced Treatment |
MARKET SEGMENTATION OVERVIEW
By Treatment Technology
| Sub-Segment | Key Trend |
| MBR (Membrane Bioreactor) | PVDF and ceramic module cost declines, enabling mid-market adoption; hybrid MBR-RO trains achieving >90% water recovery |
| Activated Sludge / Biological | Anaerobic digestion with biogas recovery, turning treatment into an energy source; MBBR hybrids gaining share. |
| ZLD Systems | Thermal-membrane hybrids replacing standalone evaporators; regulatory mandates in India, Saudi Arabia, and China driving rapid uptake |
| Chemical Treatment | Advanced coagulants and electrocoagulation reduce sludge volumes; PFAS-specific adsorbents creating new sub-niche |
| Physical / Mechanical | DAF (dissolved air flotation) upgrades for oil & grease-heavy streams; automation of screening and grit-removal processes |
Treatment technology selection in the Industrial Wastewater Treatment Market is increasingly driven by effluent reuse targets rather than simple discharge compliance, pushing operators toward MBR and ZLD configurations that deliver higher water-recovery rates and smaller environmental footprints.
By End-Use Industry
| Sub-Segment | Key Trend |
| Chemical & Petrochemical | Multi-stage trains for phenol/cyanide removal; refinery turnaround cycle accelerating retrofit demand |
| Power Generation | Coal ash-pond closure mandates (U.S. CCR Rule); FGD wastewater selenium/mercury treatment upgrades |
| Food & Beverage | Anaerobic digestion for high-BOD streams with biogas energy offset; CIP rinse-water reuse expansion |
| Metal & Mining | Acid-mine drainage neutralization; selective heavy-metal ion exchange for resource recovery |
| Pharmaceutical | API micro-pollutant destruction via AOP (advanced oxidation); EU Watch List driving emerging-compound monitoring |
| Textiles | ZLD mandates in Indian dyeing clusters; electrochemical color-removal gaining traction |
End-use industry dynamics in the Industrial Wastewater Treatment Market reflect sector-specific pollutant profiles: high organic loads favor biological solutions, while heavy-metal and persistent-pollutant streams demand chemical and membrane-based approaches.
By Treatment Stage
| Sub-Segment | Key Trend |
| Primary Treatment | Smart screening with automated rake systems; equalization tanks with real-time flow balancing |
| Secondary Treatment | MBBR and SBR variants supplementing conventional activated sludge; energy-positive anaerobic configurations |
| Tertiary / Advanced Treatment | UF-RO-UV polishing for direct reuse; nutrient-recovery systems (struvite precipitation) adding circular-economy value |
The treatment-stage mix in the Industrial Wastewater Treatment Market is shifting toward tertiary processes as reuse mandates tighten globally, with advanced treatment commanding higher margins and faster growth than primary or secondary stages.