×
  • Cat-intel
  • MedIntelliX
  • Resources
  • About Us
  • Hero Background
    English
    Chinese
    French
    Japanese
    Korean
    German
    Spanish

    India Solar Pump Market Trends

    ID: MRFR/EnP/14640-HCR
    128 Pages
    Garvit Vyas
    October 2025

    India Solar Pump Market Research Report Information By Product (Surface Suction, Submersible, and Floating), By End-users (Agriculture, Water Management, and Others), By Operation (AC Pump and DC Pump) –Market Forecast Till 2035

    Share:
    Download PDF ×

    We do not share your information with anyone. However, we may send you emails based on your report interest from time to time. You may contact us at any time to opt-out.

    India Solar Pump Market Infographic
    Purchase Options

    Market Trends

    Key Emerging Trends in the India Solar Pump Market

    In the burgeoning landscape of the India Green Hydrogen Market, strategic positioning is crucial for companies to establish a strong presence, adapt to evolving energy trends, and outperform competitors. Technological innovation forms a foundational strategy, with companies investing in advanced electrolysis technologies, renewable energy integration, and efficient hydrogen production methods. Innovations such as high-efficiency electrolyzers, solar and wind-powered hydrogen production, and sustainable feedstock utilization position companies as leaders in providing green and clean hydrogen solutions, contributing significantly to capturing and maintaining a substantial market share.

    Strategic collaborations and partnerships play a pivotal role in shaping market share positioning within the India Green Hydrogen Market. Aligning with government agencies, energy companies, or research institutions allows companies to pool resources and expertise, fostering a collaborative ecosystem for green hydrogen development. Such collaborations not only enhance project efficiency but also position companies as key contributors to India's transition towards green energy, contributing to an increased market share within the industry.

    Adherence to stringent environmental and regulatory standards is a strategic imperative in the India Green Hydrogen Market. Companies that prioritize sustainable practices, invest in low-carbon technologies, and align with the national agenda for clean energy transition position themselves favorably. Compliance with regulations not only ensures market relevance but also builds trust with stakeholders, including investors and policymakers, influencing their choices and positively impacting market share.

    Diversification and optimization of production methods and end-use applications are key strategies employed by companies in the India Green Hydrogen Market to enhance market share positioning. Offering a diversified range of green hydrogen applications, such as industrial feedstock, transportation fuel, or grid balancing, allows companies to address the diverse energy needs of the country. Additionally, optimizing production costs and efficiency contributes to competitiveness, optimizing overall market share.

    Strategic pricing is an essential aspect of market share positioning in the India Green Hydrogen Market. Companies must balance competitive pricing with government incentives and operational costs to attract investors and end-users. Offering attractive pricing structures, innovative financing models, or long-term supply agreements helps companies gain a competitive edge and secure a larger market share. Strategic pricing strategies may also include collaborative pricing initiatives with government bodies or industry associations to align with national energy goals.

    Geographic expansion and project deployment in key regions are strategic approaches to secure a competitive market share in the India Green Hydrogen industry. As India accelerates its focus on clean energy solutions, companies that strategically expand their presence in regions with high renewable energy potential and supportive regulatory frameworks can tap into new opportunities and enhance their market share. Adapting projects to local energy needs and collaborating with regional stakeholders is crucial in successfully penetrating diverse markets within the country.

    Investment in research and development contributes significantly to market share positioning strategies in the India Green Hydrogen Market. Innovations in electrolysis technologies, renewable energy integration, and hydrogen storage solutions enable companies to stay ahead of industry trends and technological advancements. Being leaders in sustainable hydrogen solutions positions companies as key contributors to India's green energy transition, fostering investor confidence and positively influencing market share.

    Customer relationship management and stakeholder engagement are strategic approaches to secure a competitive market share in the India Green Hydrogen sector. Establishing strong relationships with government bodies, local communities, and project investors fosters collaboration and support. Positive relationships with stakeholders are essential for navigating regulatory landscapes, gaining social acceptance, and attracting investment, all of which contribute to a favorable market share.

    Strategic acquisitions and mergers also shape market share positioning in the India Green Hydrogen Market. Companies that acquire or merge with complementary businesses gain access to new technologies, expanded project portfolios, and broader customer bases. These strategic moves enable companies to strengthen their market presence, consolidate resources, and position themselves as influential players in India's green hydrogen landscape, enhancing overall market share.

    In conclusion, market share positioning strategies in the India Green Hydrogen Market involve a comprehensive approach, encompassing technological innovation, strategic collaborations, regulatory compliance, portfolio diversification, pricing strategies, geographic expansion, research and development efforts, customer relationships, and strategic acquisitions. Successful implementation of these strategies allows companies to navigate the competitive landscape effectively, capture a significant market share, and establish a robust and sustainable position within India's dynamic transition towards green hydrogen.

    Author
    Garvit Vyas
    Analyst

    Explore the profile of Garvit Vyas, one of our esteemed authors at Market Research Future, and access their expert research contributions in the field of market research and industry analysis

    Leave a Comment

    FAQs

    What is the current valuation of the India Solar Pump Market?

    <p>The overall market valuation was 0.545 USD Billion in 2024.</p>

    What is the projected market size for the India Solar Pump Market by 2035?

    <p>The projected valuation for 2035 is 0.8751 USD Billion.</p>

    What is the expected CAGR for the India Solar Pump Market during the forecast period?

    <p>The expected CAGR for the India Solar Pump Market from 2025 to 2035 is 4.4%.</p>

    Which companies are the key players in the India Solar Pump Market?

    <p>Key players include Tata Power, Luminous Power Technologies, and Mahindra Solar, among others.</p>

    What are the main product segments in the India Solar Pump Market?

    <p>The main product segments include Surface Suction, Submersible, and Floating pumps.</p>

    How did the Surface Suction segment perform in 2024?

    <p>The Surface Suction segment was valued at 0.2 USD Billion in 2024.</p>

    Market Summary

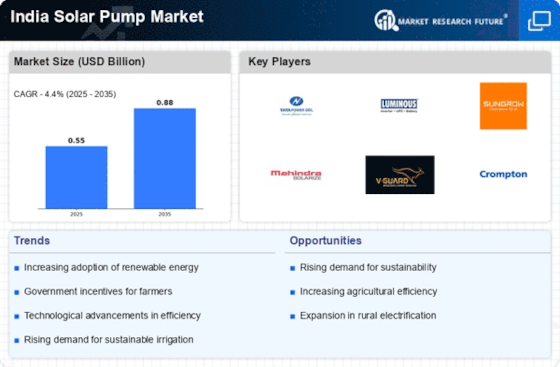
    As per MRFR analysis, the India Solar Pump Market Size was estimated at 0.545 USD Billion in 2024. The India Solar Pump industry is projected to grow from 0.5689 in 2025 to 0.8751 by 2035, exhibiting a compound annual growth rate (CAGR) of 4.4 during the forecast period 2025 - 2035.

    Key Market Trends & Highlights

    The India Solar Pump Market is poised for substantial growth driven by technological advancements and government initiatives.

    • Government initiatives are increasingly promoting the adoption of solar pumps in rural areas, enhancing agricultural productivity.
    • Technological advancements in solar pump efficiency are driving down costs and improving accessibility for farmers.
    • The agriculture segment remains the largest market, while the water management segment is experiencing rapid growth due to rising demand.
    • Rising agricultural demand and government subsidies are key drivers propelling the market forward.

    Market Size & Forecast

    2024 Market Size 0.545 (USD Billion)
    2035 Market Size 0.8751 (USD Billion)
    CAGR (2025 - 2035) 4.4%
    Largest Regional Market Share in 2024 Asia Pacific

    Major Players

    <p>Tata Power (IN), Luminous Power Technologies (IN), Sungrow Power Supply Co. Ltd. (CN), Mahindra Solar (IN), V-Guard Industries Ltd. (IN), Crompton Greaves Consumer Electricals Ltd. (IN), Solarify (IN), Jain Irrigation Systems Ltd. (IN), KSB Limited (IN)</p>

    Market Trends

    The India Solar Pump Market is currently experiencing a transformative phase, driven by a confluence of factors including government initiatives, rising energy costs, and an increasing emphasis on sustainable agricultural practices. The market appears to be expanding as farmers and agricultural stakeholders recognize the potential benefits of solar-powered irrigation systems. These systems not only reduce dependency on conventional energy sources but also offer a reliable solution for water management in regions facing water scarcity. Furthermore, the integration of advanced technologies in solar pumps is likely enhancing efficiency and user experience, thereby attracting a broader customer base. In addition to technological advancements, the India Solar Pump Market is witnessing a shift in consumer preferences towards eco-friendly solutions. This trend is further supported by various state and central government schemes aimed at promoting renewable energy usage in agriculture. As awareness regarding climate change and environmental sustainability grows, the adoption of solar pumps is expected to gain momentum. The market's future seems promising, with potential for innovation and growth as stakeholders continue to explore the benefits of solar energy in agricultural practices.

    Government Initiatives

    Government policies and incentives are playing a crucial role in promoting the adoption of solar pumps. Various schemes are being implemented to subsidize costs and encourage farmers to transition to renewable energy sources.

    Technological Advancements

    The integration of cutting-edge technology in solar pumps is enhancing their efficiency and functionality. Innovations such as smart monitoring systems and improved battery storage are making these pumps more appealing to users.

    Sustainability Focus

    There is a growing emphasis on sustainable agricultural practices, which is driving demand for solar pumps. As farmers seek eco-friendly solutions, solar-powered irrigation systems are becoming increasingly popular.

    India Solar Pump Market Market Drivers

    Technological Innovations

    Technological advancements are significantly influencing the India Solar Pump Market. Innovations in solar panel efficiency, battery storage, and pump design are enhancing the performance and affordability of solar pumps. For example, the introduction of smart solar pumps equipped with IoT technology allows for real-time monitoring and management of water usage, which can lead to more efficient irrigation practices. As technology continues to evolve, the cost of solar pump systems is expected to decrease, making them more accessible to a larger segment of the agricultural community. This trend suggests a promising future for the India Solar Pump Market, as farmers increasingly adopt these advanced solutions to meet their irrigation needs.

    Rising Agricultural Demand

    The increasing demand for agricultural productivity in India is a primary driver for the India Solar Pump Market. With a significant portion of the population engaged in agriculture, the need for efficient irrigation solutions has become paramount. Solar pumps offer a sustainable alternative to traditional diesel pumps, reducing operational costs and enhancing water accessibility. According to recent data, the agricultural sector contributes approximately 17-18 percent to India's GDP, indicating a robust market potential for solar pumps. As farmers seek to optimize their yield and reduce dependency on conventional energy sources, the adoption of solar pumps is likely to rise, thereby propelling the growth of the India Solar Pump Market.

    Environmental Sustainability

    The growing emphasis on environmental sustainability is a significant driver for the India Solar Pump Market. As concerns regarding climate change and water scarcity intensify, there is a pressing need for sustainable agricultural practices. Solar pumps, which utilize renewable energy, contribute to reducing carbon footprints and conserving water resources. The Indian government has set ambitious targets for renewable energy capacity, aiming for 175 GW by 2022, which includes solar energy. This commitment not only supports the transition to cleaner energy sources but also encourages the adoption of solar pumps in agriculture. Consequently, the focus on sustainability is likely to bolster the growth of the India Solar Pump Market.

    Government Subsidies and Policies

    Government initiatives play a crucial role in shaping the India Solar Pump Market. Various state and central government schemes provide financial incentives and subsidies for the installation of solar pumps. For instance, the Pradhan Mantri Kisan Urja Suraksha evam Utthaan Mahabhiyan (PM-KUSUM) scheme aims to promote the use of solar energy in agriculture, offering subsidies that can cover a significant portion of the installation costs. This policy framework not only encourages farmers to transition to solar pumps but also aligns with India's broader renewable energy goals. As a result, the market is expected to witness accelerated growth, driven by favorable government support and increasing awareness among farmers.

    Rural Electrification Initiatives

    Rural electrification initiatives are pivotal in driving the India Solar Pump Market. Many rural areas in India still lack reliable access to electricity, making solar pumps an attractive solution for farmers. The government's efforts to enhance rural electrification through solar energy projects have created a conducive environment for the adoption of solar pumps. By providing an alternative energy source, solar pumps enable farmers to irrigate their fields without relying on erratic grid power. This trend is expected to continue, as more rural regions gain access to solar technology, thereby expanding the market for solar pumps. The intersection of rural development and renewable energy initiatives presents a unique opportunity for the India Solar Pump Market.

    Market Segment Insights

    By Product: Submersible (Largest) vs. Surface Suction (Fastest-Growing)

    <p>In the India Solar Pump Market, the product segment is primarily divided into three categories: Surface Suction, Submersible, and Floating pumps. Among these, Submersible pumps hold the largest market share due to their efficiency and higher adaptability to various depths of water. Surface Suction pumps, while trailing in share, are gaining popularity in specific regions due to their simplicity and lower initial costs. Meanwhile, Floating pumps are emerging but currently represent a minor share in the overall market, reflecting a niche demand.</p>

    <p>Pump Type: Submersible (Dominant) vs. Surface Suction (Emerging)</p>

    <p>Submersible pumps dominate the market, recognized for their superior performance in extracting water from deep sources and their growing application in agriculture and industrial usage. These pumps are favored for their energy efficiency and reliability, making them a go-to choice in regions where water scarcity is a challenge. On the other hand, Surface Suction pumps are slowly gaining traction, especially among smallholder farmers who seek cost-effective solutions. Their user-friendly operation and lower initial investment have made them an attractive option in various rural areas. However, the rising demand for efficient irrigation systems hints at a potential shift towards Submersible pumps as the agricultural landscape evolves.</p>

    By End-users: Agriculture (Largest) vs. Water Management (Fastest-Growing)

    <p>The India Solar Pump Market is predominantly driven by the agriculture sector, which accounts for a significant percentage of the market share among end-users. Solar pumps are increasingly being adopted by farmers looking to take advantage of sustainable resources for irrigation and other agricultural activities. This segment's contribution is highlighted by the ongoing efforts of the government and various organizations to promote solar energy solutions in rural areas, thus enhancing the agriculture sector's ability to meet its water needs efficiently. On the other hand, the water management segment is emerging as the fastest-growing area within the India Solar Pump Market. With the increasing concerns over water scarcity and the need for sustainable water management solutions, there has been a surge in the installation of solar pumps for urban water supply and irrigation purposes. This growth is supported by technological advancements and favorable government policies, making solar pumps an attractive option for various water management applications.</p>

    <p>Agriculture (Dominant) vs. Water Management (Emerging)</p>

    <p>In the India Solar Pump Market, the agriculture segment stands out as the dominant end-user, largely due to the extensive reliance on irrigation for crop production. Farmers benefit from solar pumps as they provide a cost-effective and environmentally friendly solution for their irrigation needs, enabling them to access water more efficiently. Meanwhile, the water management segment is emerging as a robust competitor, driven by increasing urbanization and intensified efforts to manage water resources sustainably. This segment focuses on the deployment of solar pumps for municipal water supplies, reservoir management, and flood control, making it an integral part of India's response to water scarcity issues. The contrasting characteristics of these segments reflect diverse user priorities, with agriculture being established and water management gaining traction.</p>

    By Operation: AC Pump (Largest) vs. DC Pump (Fastest-Growing)

    <p>In the India Solar Pump Market, AC Pumps dominate the operational segment, capturing significant market share due to established technology and widespread acceptability in agriculture and irrigation. Conversely, DC Pumps are emerging rapidly, fostered by increasing government initiatives promoting solar energy and growing awareness of their efficiency and suitability for small-scale applications. As a result, while AC Pumps hold a strong position, the upward trend of DC Pumps indicates changing preferences in the market.</p>

    <p>Operation: AC Pump (Dominant) vs. DC Pump (Emerging)</p>

    <p>AC Pumps are well-liked in the India Solar Pump Market primarily due to their efficiency in high-power applications, making them suitable for large agricultural operations. Their robust performance in varied operational conditions has solidified their position as the dominant choice among farmers. On the other hand, DC Pumps are experiencing a surge in popularity, particularly among smallholders and in rural markets where affordability and ease of installation are critical. This segment's growth is bolstered by innovations that enhance their performance and durability, ultimately meeting the needs of a diverse customer base.</p>

    Get more detailed insights about India Solar Pump Market Research Report – Forecast till 2035

    Regional Insights

    North America : Innovation and Sustainability Focus

    The North American solar pump market is driven by increasing demand for sustainable agricultural practices and government incentives promoting renewable energy. The U.S. holds the largest market share at approximately 60%, followed by Canada at 25%. Regulatory support, such as tax credits and grants, is catalyzing growth, making solar pumps an attractive option for farmers seeking cost-effective irrigation solutions. Leading countries in this region include the United States and Canada, with a competitive landscape featuring key players like SunPower and First Solar. The presence of established companies and innovative startups is fostering a dynamic market environment. As awareness of solar technology benefits grows, the adoption of solar pumps is expected to accelerate, enhancing agricultural productivity and sustainability.

    Europe : Regulatory Support and Growth

    The European solar pump market is characterized by strong regulatory frameworks and a commitment to renewable energy. Germany and France are the largest markets, holding approximately 35% and 30% market shares, respectively. The European Union's Green Deal and various national policies are driving demand for solar pumps, as they align with sustainability goals and reduce reliance on fossil fuels. Key players in this region include companies like Grundfos and KSB, which are leading the charge in innovative solar pump technologies. The competitive landscape is marked by a mix of established firms and emerging startups, all focused on enhancing efficiency and reducing costs. As the market matures, collaboration between public and private sectors is expected to further boost growth and adoption of solar pumps across Europe.

    Asia-Pacific : Rapid Growth and Adoption

    The Asia-Pacific region is witnessing rapid growth in the solar pump market, driven by increasing agricultural demands and government initiatives promoting renewable energy. India is the largest market, accounting for approximately 70% of the regional share, followed by China at 20%. The Indian government's subsidy schemes and initiatives like the Pradhan Mantri Kisan Urja Suraksha evam Utthaan Mahabhiyan are significant catalysts for market expansion. In this region, India and China are the leading countries, with major players such as Tata Power and Mahindra Solar dominating the landscape. The competitive environment is characterized by a mix of local and international companies, all striving to innovate and provide cost-effective solutions. As awareness of solar technology benefits grows, the adoption of solar pumps is expected to increase significantly, enhancing agricultural productivity and sustainability.

    Middle East and Africa : Emerging Market Potential

    The Middle East and Africa region is emerging as a potential market for solar pumps, driven by the need for sustainable irrigation solutions in arid climates. Countries like South Africa and Kenya are leading the market, holding approximately 40% and 30% shares, respectively. Government initiatives aimed at promoting renewable energy and improving agricultural efficiency are key drivers of growth in this sector. In this region, South Africa and Kenya are at the forefront, with key players such as Solarify and Jain Irrigation Systems Ltd. actively participating in the market. The competitive landscape is evolving, with both local and international companies seeking to capitalize on the growing demand for solar pumps. As investment in renewable energy increases, the adoption of solar pumps is expected to rise, contributing to improved agricultural practices and water management.

    Key Players and Competitive Insights

    Leading market players are investing majorly in research and development to spread their product lines, which will help the Solar Pump market grow even more. The participants are also undertaking various strategic activities to spread their footprint with new market developments, including product launches, contractual agreements, mergers and acquisitions, major investments, and collaboration with other organizations. The Solar Pump industry must offer cost-effective items to spread and survive in a competitive and rising market climate.

    The players in the Solar Pump market are attempting to raise market demand by investing in research and development operations, including Lorentz (Germany), C. R. I. Pumps Private Limited (India), Tata Power Solar Systems Ltd (India), Shakti Pumps (India) Ltd (India), Wenling Jintai Pump Factory Limited (China), Bright Solar Limited (India), Grundfos (Denmark), Symtech Solar (Oman), PhotonSolar.com (Australia), Urja Global Limited (India) and Kavita Solar Energy Private Limited (India).

    Key Companies in the India Solar Pump Market market include

    Industry Developments

    In 2022:Solar pumps are becoming pivotal for the Indian government to fulfill its mission of increasing farmers' incomes. Rajasthan is one of the few states that has taken the initiative to popularize solar pumps on a large scale in rural areas, and the budget announcement is likely to provide further impetus.

    Future Outlook

    India Solar Pump Market Future Outlook

    <p>The India Solar Pump Market is projected to grow at a 4.4% CAGR from 2024 to 2035, driven by increasing agricultural demand, government incentives, and technological advancements.</p>

    New opportunities lie in:

    • <p>Development of integrated solar irrigation systems for smallholder farmers.</p>
    • <p>Expansion into rural electrification projects leveraging solar pump technology.</p>
    • <p>Partnerships with agricultural cooperatives for bulk solar pump installations.</p>

    <p>By 2035, the market is expected to solidify its position as a leader in sustainable agricultural solutions.</p>

    Market Segmentation

    Solar Pump Product Outlook

    • Surface Suction
    • Submersible
    • Floating

    Solar Pump End-users Outlook

    • Agriculture
    • Water Management
    • Others

    Solar Pump Operation Outlook

    • AC Pump
    • DC Pump

    Report Scope

    MARKET SIZE 20240.545(USD Billion)
    MARKET SIZE 20250.5689(USD Billion)
    MARKET SIZE 20350.8751(USD Billion)
    COMPOUND ANNUAL GROWTH RATE (CAGR)4.4% (2024 - 2035)
    REPORT COVERAGERevenue Forecast, Competitive Landscape, Growth Factors, and Trends
    BASE YEAR2024
    Market Forecast Period2025 - 2035
    Historical Data2019 - 2024
    Market Forecast UnitsUSD Billion
    Key Companies ProfiledMarket analysis in progress
    Segments CoveredMarket segmentation analysis in progress
    Key Market OpportunitiesGrowing demand for sustainable irrigation solutions drives innovation in the India Solar Pump Market.
    Key Market DynamicsRising demand for sustainable irrigation solutions drives innovation and competition in the India Solar Pump Market.
    Countries CoveredNorth America, Europe, APAC, South America, MEA

    FAQs

    What is the current valuation of the India Solar Pump Market?

    <p>The overall market valuation was 0.545 USD Billion in 2024.</p>

    What is the projected market size for the India Solar Pump Market by 2035?

    <p>The projected valuation for 2035 is 0.8751 USD Billion.</p>

    What is the expected CAGR for the India Solar Pump Market during the forecast period?

    <p>The expected CAGR for the India Solar Pump Market from 2025 to 2035 is 4.4%.</p>

    Which companies are the key players in the India Solar Pump Market?

    <p>Key players include Tata Power, Luminous Power Technologies, and Mahindra Solar, among others.</p>

    What are the main product segments in the India Solar Pump Market?

    <p>The main product segments include Surface Suction, Submersible, and Floating pumps.</p>

    How did the Surface Suction segment perform in 2024?

    <p>The Surface Suction segment was valued at 0.2 USD Billion in 2024.</p>

    1. SECTION I: EXECUTIVE SUMMARY AND KEY HIGHLIGHTS
      1. EXECUTIVE SUMMARY
        1. Market Overview
        2. Key Findings
        3. Market Segmentation
        4. Competitive Landscape
        5. Challenges and Opportunities
        6. Future Outlook
    2. SECTION II: SCOPING, METHODOLOGY AND MARKET STRUCTURE
      1. MARKET INTRODUCTION
        1. Definition
        2. Scope of the study
      2. RESEARCH METHODOLOGY
        1. Overview
        2. Data Mining
        3. Secondary Research
        4. Primary Research
        5. Forecasting Model
        6. Market Size Estimation
        7. Data Triangulation
        8. Validation
    3. SECTION III: QUALITATIVE ANALYSIS
      1. MARKET DYNAMICS
        1. Overview
        2. Drivers
        3. Restraints
        4. Opportunities
      2. MARKET FACTOR ANALYSIS
        1. Value chain Analysis
        2. Porter's Five Forces Analysis
        3. COVID-19 Impact Analysis
    4. SECTION IV: QUANTITATIVE ANALYSIS
      1. Energy & Power, BY Product (USD Billion)
        1. Surface Suction
        2. Submersible
        3. Floating
      2. Energy & Power, BY End-users (USD Billion)
        1. Agriculture
        2. Water Management
        3. Others
      3. Energy & Power, BY Operation (USD Billion)
        1. AC Pump
        2. DC Pump
      4. Energy & Power, BY Region (USD Billion)
        1. North America
        2. Europe
        3. APAC
        4. South America
        5. MEA
    5. SECTION V: COMPETITIVE ANALYSIS
      1. Competitive Landscape
        1. Overview
        2. Competitive Analysis
        3. Market share Analysis
        4. Major Growth Strategy in the Energy & Power
        5. Competitive Benchmarking
        6. Leading Players in Terms of Number of Developments in the Energy & Power
        7. Key developments and growth strategies
        8. Major Players Financial Matrix
      2. Company Profiles
        1. Tata Power (IN)
        2. Luminous Power Technologies (IN)
        3. Sungrow Power Supply Co. Ltd. (CN)
        4. Mahindra Solar (IN)
        5. V-Guard Industries Ltd. (IN)
        6. Crompton Greaves Consumer Electricals Ltd. (IN)
        7. Solarify (IN)
        8. Jain Irrigation Systems Ltd. (IN)
        9. KSB Limited (IN)
      3. Appendix
        1. References
        2. Related Reports
    6. LIST OF FIGURES
      1. MARKET SYNOPSIS
      2. NORTH AMERICA MARKET ANALYSIS
      3. US MARKET ANALYSIS BY PRODUCT
      4. US MARKET ANALYSIS BY END-USERS
      5. US MARKET ANALYSIS BY OPERATION
      6. CANADA MARKET ANALYSIS BY PRODUCT
      7. CANADA MARKET ANALYSIS BY END-USERS
      8. CANADA MARKET ANALYSIS BY OPERATION
      9. EUROPE MARKET ANALYSIS
      10. GERMANY MARKET ANALYSIS BY PRODUCT
      11. GERMANY MARKET ANALYSIS BY END-USERS
      12. GERMANY MARKET ANALYSIS BY OPERATION
      13. UK MARKET ANALYSIS BY PRODUCT
      14. UK MARKET ANALYSIS BY END-USERS
      15. UK MARKET ANALYSIS BY OPERATION
      16. FRANCE MARKET ANALYSIS BY PRODUCT
      17. FRANCE MARKET ANALYSIS BY END-USERS
      18. FRANCE MARKET ANALYSIS BY OPERATION
      19. RUSSIA MARKET ANALYSIS BY PRODUCT
      20. RUSSIA MARKET ANALYSIS BY END-USERS
      21. RUSSIA MARKET ANALYSIS BY OPERATION
      22. ITALY MARKET ANALYSIS BY PRODUCT
      23. ITALY MARKET ANALYSIS BY END-USERS
      24. ITALY MARKET ANALYSIS BY OPERATION
      25. SPAIN MARKET ANALYSIS BY PRODUCT
      26. SPAIN MARKET ANALYSIS BY END-USERS
      27. SPAIN MARKET ANALYSIS BY OPERATION
      28. REST OF EUROPE MARKET ANALYSIS BY PRODUCT
      29. REST OF EUROPE MARKET ANALYSIS BY END-USERS
      30. REST OF EUROPE MARKET ANALYSIS BY OPERATION
      31. APAC MARKET ANALYSIS
      32. CHINA MARKET ANALYSIS BY PRODUCT
      33. CHINA MARKET ANALYSIS BY END-USERS
      34. CHINA MARKET ANALYSIS BY OPERATION
      35. INDIA MARKET ANALYSIS BY PRODUCT
      36. INDIA MARKET ANALYSIS BY END-USERS
      37. INDIA MARKET ANALYSIS BY OPERATION
      38. JAPAN MARKET ANALYSIS BY PRODUCT
      39. JAPAN MARKET ANALYSIS BY END-USERS
      40. JAPAN MARKET ANALYSIS BY OPERATION
      41. SOUTH KOREA MARKET ANALYSIS BY PRODUCT
      42. SOUTH KOREA MARKET ANALYSIS BY END-USERS
      43. SOUTH KOREA MARKET ANALYSIS BY OPERATION
      44. MALAYSIA MARKET ANALYSIS BY PRODUCT
      45. MALAYSIA MARKET ANALYSIS BY END-USERS
      46. MALAYSIA MARKET ANALYSIS BY OPERATION
      47. THAILAND MARKET ANALYSIS BY PRODUCT
      48. THAILAND MARKET ANALYSIS BY END-USERS
      49. THAILAND MARKET ANALYSIS BY OPERATION
      50. INDONESIA MARKET ANALYSIS BY PRODUCT
      51. INDONESIA MARKET ANALYSIS BY END-USERS
      52. INDONESIA MARKET ANALYSIS BY OPERATION
      53. REST OF APAC MARKET ANALYSIS BY PRODUCT
      54. REST OF APAC MARKET ANALYSIS BY END-USERS
      55. REST OF APAC MARKET ANALYSIS BY OPERATION
      56. SOUTH AMERICA MARKET ANALYSIS
      57. BRAZIL MARKET ANALYSIS BY PRODUCT
      58. BRAZIL MARKET ANALYSIS BY END-USERS
      59. BRAZIL MARKET ANALYSIS BY OPERATION
      60. MEXICO MARKET ANALYSIS BY PRODUCT
      61. MEXICO MARKET ANALYSIS BY END-USERS
      62. MEXICO MARKET ANALYSIS BY OPERATION
      63. ARGENTINA MARKET ANALYSIS BY PRODUCT
      64. ARGENTINA MARKET ANALYSIS BY END-USERS
      65. ARGENTINA MARKET ANALYSIS BY OPERATION
      66. REST OF SOUTH AMERICA MARKET ANALYSIS BY PRODUCT
      67. REST OF SOUTH AMERICA MARKET ANALYSIS BY END-USERS
      68. REST OF SOUTH AMERICA MARKET ANALYSIS BY OPERATION
      69. MEA MARKET ANALYSIS
      70. GCC COUNTRIES MARKET ANALYSIS BY PRODUCT
      71. GCC COUNTRIES MARKET ANALYSIS BY END-USERS
      72. GCC COUNTRIES MARKET ANALYSIS BY OPERATION
      73. SOUTH AFRICA MARKET ANALYSIS BY PRODUCT
      74. SOUTH AFRICA MARKET ANALYSIS BY END-USERS
      75. SOUTH AFRICA MARKET ANALYSIS BY OPERATION
      76. REST OF MEA MARKET ANALYSIS BY PRODUCT
      77. REST OF MEA MARKET ANALYSIS BY END-USERS
      78. REST OF MEA MARKET ANALYSIS BY OPERATION
      79. KEY BUYING CRITERIA OF ENERGY & POWER
      80. RESEARCH PROCESS OF MRFR
      81. DRO ANALYSIS OF ENERGY & POWER
      82. DRIVERS IMPACT ANALYSIS: ENERGY & POWER
      83. RESTRAINTS IMPACT ANALYSIS: ENERGY & POWER
      84. SUPPLY / VALUE CHAIN: ENERGY & POWER
      85. ENERGY & POWER, BY PRODUCT, 2024 (% SHARE)
      86. ENERGY & POWER, BY PRODUCT, 2024 TO 2035 (USD Billion)
      87. ENERGY & POWER, BY END-USERS, 2024 (% SHARE)
      88. ENERGY & POWER, BY END-USERS, 2024 TO 2035 (USD Billion)
      89. ENERGY & POWER, BY OPERATION, 2024 (% SHARE)
      90. ENERGY & POWER, BY OPERATION, 2024 TO 2035 (USD Billion)
      91. BENCHMARKING OF MAJOR COMPETITORS
    7. LIST OF TABLES
      1. LIST OF ASSUMPTIONS
      2. 7.1.1
      3. North America MARKET SIZE ESTIMATES; FORECAST
        1. BY PRODUCT, 2025-2035 (USD Billion)
        2. BY END-USERS, 2025-2035 (USD Billion)
        3. BY OPERATION, 2025-2035 (USD Billion)
      4. US MARKET SIZE ESTIMATES; FORECAST
        1. BY PRODUCT, 2025-2035 (USD Billion)
        2. BY END-USERS, 2025-2035 (USD Billion)
        3. BY OPERATION, 2025-2035 (USD Billion)
      5. Canada MARKET SIZE ESTIMATES; FORECAST
        1. BY PRODUCT, 2025-2035 (USD Billion)
        2. BY END-USERS, 2025-2035 (USD Billion)
        3. BY OPERATION, 2025-2035 (USD Billion)
      6. Europe MARKET SIZE ESTIMATES; FORECAST
        1. BY PRODUCT, 2025-2035 (USD Billion)
        2. BY END-USERS, 2025-2035 (USD Billion)
        3. BY OPERATION, 2025-2035 (USD Billion)
      7. Germany MARKET SIZE ESTIMATES; FORECAST
        1. BY PRODUCT, 2025-2035 (USD Billion)
        2. BY END-USERS, 2025-2035 (USD Billion)
        3. BY OPERATION, 2025-2035 (USD Billion)
      8. UK MARKET SIZE ESTIMATES; FORECAST
        1. BY PRODUCT, 2025-2035 (USD Billion)
        2. BY END-USERS, 2025-2035 (USD Billion)
        3. BY OPERATION, 2025-2035 (USD Billion)
      9. France MARKET SIZE ESTIMATES; FORECAST
        1. BY PRODUCT, 2025-2035 (USD Billion)
        2. BY END-USERS, 2025-2035 (USD Billion)
        3. BY OPERATION, 2025-2035 (USD Billion)
      10. Russia MARKET SIZE ESTIMATES; FORECAST
        1. BY PRODUCT, 2025-2035 (USD Billion)
        2. BY END-USERS, 2025-2035 (USD Billion)
        3. BY OPERATION, 2025-2035 (USD Billion)
      11. Italy MARKET SIZE ESTIMATES; FORECAST
        1. BY PRODUCT, 2025-2035 (USD Billion)
        2. BY END-USERS, 2025-2035 (USD Billion)
        3. BY OPERATION, 2025-2035 (USD Billion)
      12. Spain MARKET SIZE ESTIMATES; FORECAST
        1. BY PRODUCT, 2025-2035 (USD Billion)
        2. BY END-USERS, 2025-2035 (USD Billion)
        3. BY OPERATION, 2025-2035 (USD Billion)
      13. Rest of Europe MARKET SIZE ESTIMATES; FORECAST
        1. BY PRODUCT, 2025-2035 (USD Billion)
        2. BY END-USERS, 2025-2035 (USD Billion)
        3. BY OPERATION, 2025-2035 (USD Billion)
      14. APAC MARKET SIZE ESTIMATES; FORECAST
        1. BY PRODUCT, 2025-2035 (USD Billion)
        2. BY END-USERS, 2025-2035 (USD Billion)
        3. BY OPERATION, 2025-2035 (USD Billion)
      15. China MARKET SIZE ESTIMATES; FORECAST
        1. BY PRODUCT, 2025-2035 (USD Billion)
        2. BY END-USERS, 2025-2035 (USD Billion)
        3. BY OPERATION, 2025-2035 (USD Billion)
      16. India MARKET SIZE ESTIMATES; FORECAST
        1. BY PRODUCT, 2025-2035 (USD Billion)
        2. BY END-USERS, 2025-2035 (USD Billion)
        3. BY OPERATION, 2025-2035 (USD Billion)
      17. Japan MARKET SIZE ESTIMATES; FORECAST
        1. BY PRODUCT, 2025-2035 (USD Billion)
        2. BY END-USERS, 2025-2035 (USD Billion)
        3. BY OPERATION, 2025-2035 (USD Billion)
      18. South Korea MARKET SIZE ESTIMATES; FORECAST
        1. BY PRODUCT, 2025-2035 (USD Billion)
        2. BY END-USERS, 2025-2035 (USD Billion)
        3. BY OPERATION, 2025-2035 (USD Billion)
      19. Malaysia MARKET SIZE ESTIMATES; FORECAST
        1. BY PRODUCT, 2025-2035 (USD Billion)
        2. BY END-USERS, 2025-2035 (USD Billion)
        3. BY OPERATION, 2025-2035 (USD Billion)
      20. Thailand MARKET SIZE ESTIMATES; FORECAST
        1. BY PRODUCT, 2025-2035 (USD Billion)
        2. BY END-USERS, 2025-2035 (USD Billion)
        3. BY OPERATION, 2025-2035 (USD Billion)
      21. Indonesia MARKET SIZE ESTIMATES; FORECAST
        1. BY PRODUCT, 2025-2035 (USD Billion)
        2. BY END-USERS, 2025-2035 (USD Billion)
        3. BY OPERATION, 2025-2035 (USD Billion)
      22. Rest of APAC MARKET SIZE ESTIMATES; FORECAST
        1. BY PRODUCT, 2025-2035 (USD Billion)
        2. BY END-USERS, 2025-2035 (USD Billion)
        3. BY OPERATION, 2025-2035 (USD Billion)
      23. South America MARKET SIZE ESTIMATES; FORECAST
        1. BY PRODUCT, 2025-2035 (USD Billion)
        2. BY END-USERS, 2025-2035 (USD Billion)
        3. BY OPERATION, 2025-2035 (USD Billion)
      24. Brazil MARKET SIZE ESTIMATES; FORECAST
        1. BY PRODUCT, 2025-2035 (USD Billion)
        2. BY END-USERS, 2025-2035 (USD Billion)
        3. BY OPERATION, 2025-2035 (USD Billion)
      25. Mexico MARKET SIZE ESTIMATES; FORECAST
        1. BY PRODUCT, 2025-2035 (USD Billion)
        2. BY END-USERS, 2025-2035 (USD Billion)
        3. BY OPERATION, 2025-2035 (USD Billion)
      26. Argentina MARKET SIZE ESTIMATES; FORECAST
        1. BY PRODUCT, 2025-2035 (USD Billion)
        2. BY END-USERS, 2025-2035 (USD Billion)
        3. BY OPERATION, 2025-2035 (USD Billion)
      27. Rest of South America MARKET SIZE ESTIMATES; FORECAST
        1. BY PRODUCT, 2025-2035 (USD Billion)
        2. BY END-USERS, 2025-2035 (USD Billion)
        3. BY OPERATION, 2025-2035 (USD Billion)
      28. MEA MARKET SIZE ESTIMATES; FORECAST
        1. BY PRODUCT, 2025-2035 (USD Billion)
        2. BY END-USERS, 2025-2035 (USD Billion)
        3. BY OPERATION, 2025-2035 (USD Billion)
      29. GCC Countries MARKET SIZE ESTIMATES; FORECAST
        1. BY PRODUCT, 2025-2035 (USD Billion)
        2. BY END-USERS, 2025-2035 (USD Billion)
        3. BY OPERATION, 2025-2035 (USD Billion)
      30. South Africa MARKET SIZE ESTIMATES; FORECAST
        1. BY PRODUCT, 2025-2035 (USD Billion)
        2. BY END-USERS, 2025-2035 (USD Billion)
        3. BY OPERATION, 2025-2035 (USD Billion)
      31. Rest of MEA MARKET SIZE ESTIMATES; FORECAST
        1. BY PRODUCT, 2025-2035 (USD Billion)
        2. BY END-USERS, 2025-2035 (USD Billion)
        3. BY OPERATION, 2025-2035 (USD Billion)
      32. PRODUCT LAUNCH/PRODUCT DEVELOPMENT/APPROVAL
      33. 7.31.1
      34. ACQUISITION/PARTNERSHIP
      35. 7.32.1

    India Solar Pump Market Segmentation

    Market Segmentation Overview

    • Detailed segmentation data will be available in the full report
    • Comprehensive analysis by multiple parameters
    • Regional and country-level breakdowns
    • Market size forecasts by segment
    Infographic

    Free Sample Request

    Kindly complete the form below to receive a free sample of this Report

    Get Free Sample

    Customer Strories

    “I am very pleased with how market segments have been defined in a relevant way for my purposes (such as "Portable Freezers & refrigerators" and "last-mile"). In general the report is well structured. Thanks very much for your efforts.”

    Victoria Milne

    Founder
    Case Study
    Chemicals and Materials

    Compare Licence

    ×
    Features License Type
    Single User Multiuser License Enterprise User
    Price $4,950 $5,950 $7,250
    Maximum User Access Limit 1 User Upto 10 Users Unrestricted Access Throughout the Organization
    Free Customization
    Direct Access to Analyst
    Deliverable Format
    Platform Access
    Discount on Next Purchase 10% 15% 15%
    Printable Versions