In Memory Analytics Market (2026 – 2035)

ID: MRFR/ICT/28164-HCR 100 Pages Nirmit Biswas Last Updated: October 17, 2026
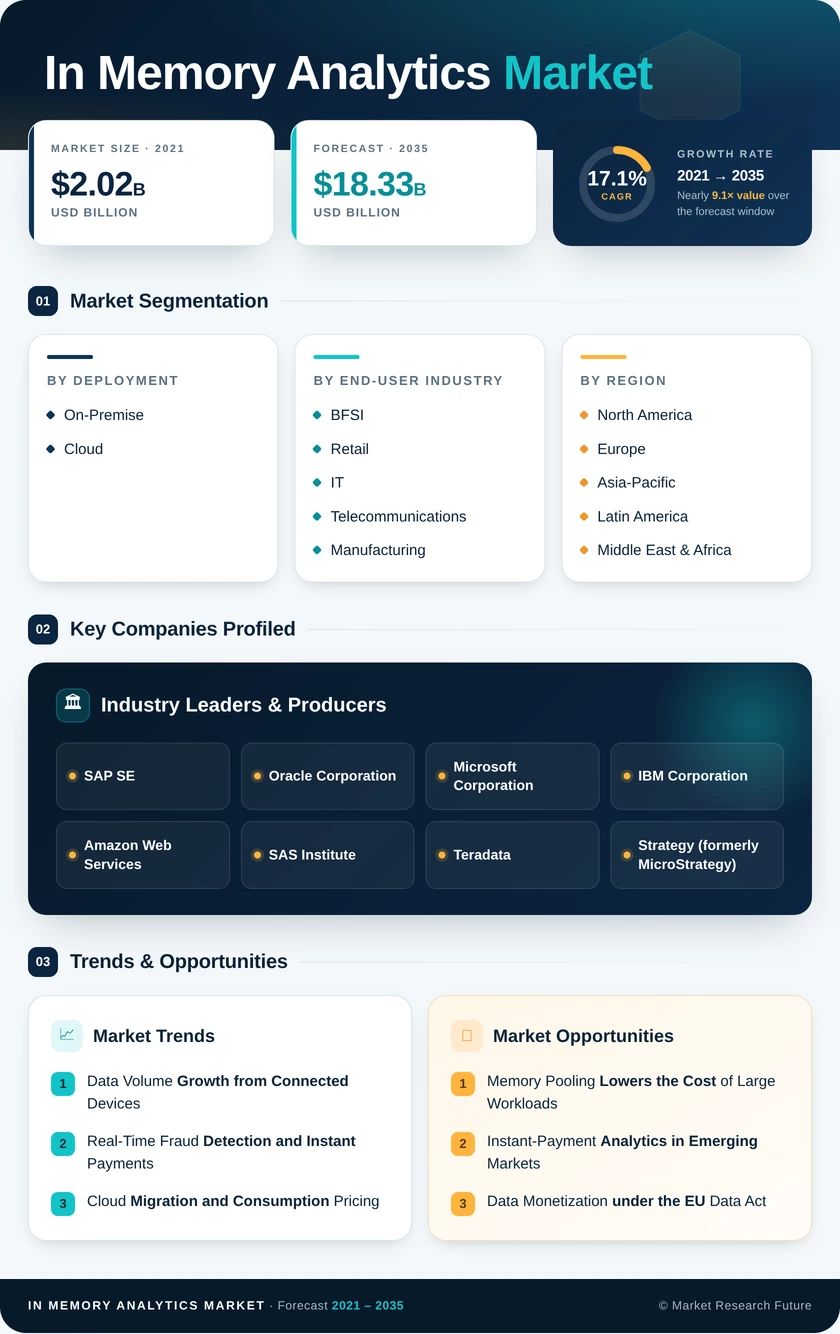
In Memory Analytics Market Size, Share and Research Report By Deployment (On-Premise and Cloud), By End-User Industry (BFSI, Retail, IT and Telecommunications, Manufacturing, Government and Public Sector, and Other End-User Industries), And By Region (North America, Europe, Asia-Pacific, And Rest Of The World) – Industry Forecast Till 2035
In Memory Analytics Market
Market Size
Forecast Period2026-2035
CAGR (2026-2035)17.1%
2025 Market SizeUSD 3.78 Billion
2035 Market SizeUSD 18.33 Billion
Key Players
SAP SE
Oracle Corporation
Microsoft Corporation
IBM Corporation
Amazon Web Services
SAS Institute
Opportunities
  • Memory Pooling Lowers the Cost of Large Workloads
  • Instant-Payment Analytics in Emerging Markets
  • Data Monetization under the EU Data Act
  1. 1 Market Summary | |
  2. 2 Key Report Takeaways | |
    1. 2.1 By Deployment | |
    2. 2.2 By End-user Industry | |
    3. 2.3 By Region | |
  3. 3 Market Size and Forecast (2021–2035) | |
    1. 3.1 Historical Market Size (2021–2024) | |
    2. 3.2 Base Year Market Size (2025) | |
    3. 3.3 Forecast Market Size (2026–2035) | |
    4. 3.4 Year-over-Year Growth Analysis | |
  4. 4 Driver Impact Analysis | |
    1. 4.1 Data Volume Growth from Connected Devices | |
    2. 4.2 Real-Time Fraud Detection and Instant Payments | |
    3. 4.3 Cloud Migration and Consumption Pricing | |
    4. 4.4 Generative AI and HTAP Workloads | |
    5. 4.5 Memory Architecture Advances | |
    6. 4.6 Data-Sharing and Resilience Regulation | |
    7. 4.7 National AI Programs in Emerging Economies | |
  5. 5 Restraints Impact Analysis | |
    1. 5.1 High Memory Cost and DRAM Price Volatility | |
    2. 5.2 Persistent-Memory Roadmap Disruption | |
    3. 5.3 Shortage of Data Engineering Skills | |
    4. 5.4 Privacy and Data-Sovereignty Compliance Costs | |
    5. 5.5 Data Center Power Constraints | |
  6. 6 Opportunities | |
    1. 6.1 Memory Pooling Lowers the Cost of Large Workloads | |
    2. 6.2 Instant-Payment Analytics in Emerging Markets | |
    3. 6.3 Data Monetization under the EU Data Act | |
    4. 6.4 Edge Analytics for Smart Manufacturing | |
    5. 6.5 Memory Services for AI Agents | |
  7. 7 Regional Market Share and Country-Level Analysis | |
    1. 7.1 North America | | |
      1. 7.1.1 US | | |
      2. 7.1.2 Canada | | |
      3. 7.1.3 Mexico | |
    2. 7.2 Europe | | |
      1. 7.2.1 Germany | | |
      2. 7.2.2 UK | | |
      3. 7.2.3 France | | |
      4. 7.2.4 Italy | | |
      5. 7.2.5 Spain | | |
      6. 7.2.6 Nordic Countries | | |
      7. 7.2.7 Russia | | |
      8. 7.2.8 Rest of Europe | |
    3. 7.3 Asia-Pacific | | |
      1. 7.3.1 China | | |
      2. 7.3.2 India | | |
      3. 7.3.3 Japan | | |
      4. 7.3.4 South Korea | | |
      5. 7.3.5 ASEAN | | |
      6. 7.3.6 Rest of Asia-Pacific | |
    4. 7.4 Latin America | | |
      1. 7.4.1 Brazil | | |
      2. 7.4.2 Argentina | | |
      3. 7.4.3 Rest of Latin America | |
    5. 7.5 Middle East & Africa | | |
      1. 7.5.1 Saudi Arabia | | |
      2. 7.5.2 UAE | | |
      3. 7.5.3 South Africa | | |
      4. 7.5.4 Egypt | | |
      5. 7.5.5 Rest of MEA | |
  8. 8 Future Outlook (2026–2035) | |
    1. 8.1 Autonomous Analytics and AI Agents | |
    2. 8.2 Platform Consolidation and Consumption Economics | |
    3. 8.3 The Memory Hierarchy Supercycle | |
    4. 8.4 Energy Efficiency and Sustainability Reporting | |
  9. 9 Segmentation Analysis | |
    1. 9.1 By Deployment | | |
      1. 9.1.1 On-Premise | | |
      2. 9.1.2 Cloud | |
    2. 9.2 By End-user Industry | | |
      1. 9.2.1 BFSI | | |
      2. 9.2.2 Retail | | |
      3. 9.2.3 IT and Telecommunications | | |
      4. 9.2.4 Manufacturing | | |
      5. 9.2.5 Government and Public Sector | | |
      6. 9.2.6 Other End-user Industries | |
  10. 10 Competitive Landscape | |
    1. 10.1 Market Concentration Analysis | |
    2. 10.2 Competitive Benchmarking Matrix | |
    3. 10.3 Company Profiles | | |
      1. 10.3.1 SAP SE | | |
      2. 10.3.2 Oracle Corporation | | |
      3. 10.3.3 Microsoft Corporation | | |
      4. 10.3.4 IBM Corporation | | |
      5. 10.3.5 Amazon Web Services | | |
      6. 10.3.6 SAS Institute | | |
      7. 10.3.7 Teradata | | |
      8. 10.3.8 Strategy (formerly MicroStrategy) | | |
      9. 10.3.9 Qlik | | |
      10. 10.3.10 Software AG | | |
      11. 10.3.11 Exasol | | |
      12. 10.3.12 Kognitio | |
  11. 11 Recent News & Developments | |
  12. 12 Report Scope and Methodology | |
  13. 13 Detailed Sources and Citations | |
  14. 14 Frequently Asked Questions (FAQs) | | LIST OF TABLES | |
  15. TABLE 1 Global In-Memory Analytics Market Summary Snapshot, 2025–2035 | |
  16. TABLE 2 Global In-Memory Analytics Market Size & Forecast, by Revenue (USD Billion), 2021–2035 | |
  17. TABLE 3 Driver Impact Analysis, 2026–2035 | |
  18. TABLE 4 Restraints Impact Analysis, 2026–2035 | |
  19. TABLE 5 Global In-Memory Analytics Market, by Region, 2025 (USD Billion) | |
  20. TABLE 6 North America In-Memory Analytics Market, by Country, 2021–2035 (USD Billion) | |
  21. TABLE 7 Europe In-Memory Analytics Market, by Country, 2021–2035 (USD Billion) | |
  22. TABLE 8 Asia-Pacific In-Memory Analytics Market, by Country, 2021–2035 (USD Billion) | |
  23. TABLE 9 Latin America In-Memory Analytics Market, by Country, 2021–2035 (USD Billion) | |
  24. TABLE 10 Middle East & Africa In-Memory Analytics Market, by Country, 2021–2035 (USD Billion) | |
  25. TABLE 11 Global In-Memory Analytics Market, by Deployment, 2021–2035 (USD Billion) | |
  26. TABLE 12 Global In-Memory Analytics Market, by End-user Industry, 2021–2035 (USD Billion) | |
  27. TABLE 13 Competitive Benchmarking Matrix, 2025 | |
  28. TABLE 14 Report Scope and Methodology | |
  29. TABLE 15 Detailed Sources and Citations | |
  30. TABLE 16 Segmentation Quick Reference | | LIST OF FIGURES | |
  31. FIGURE 1 Market Dynamics Overview — Drivers, Restraints, Opportunities | |
  32. FIGURE 2 In-Memory Analytics Value Chain Analysis | |
  33. FIGURE 3 Porter's Five Forces Analysis | |
  34. FIGURE 4 Global Market Size Trend, 2021–2035 (USD Billion) | |
  35. FIGURE 5 Year-over-Year Growth Rate, 2022–2035 | |
  36. FIGURE 6 Market Share by Deployment, 2025 | |
  37. FIGURE 7 Market Share by End-user Industry, 2025 | |
  38. FIGURE 8 Regional Market Share, 2025 | |
  39. FIGURE 9 Regional CAGR Comparison, 2026–2035 | |
  40. FIGURE 10 Competitive Landscape — Estimated Revenue Share Ranges, 2025 | |
  41. FIGURE 11 Competitive Positioning Matrix

Segmentation Quick Reference

DimensionSub-SegmentsDominant SegmentFastest Growing Segment
By DeploymentOn-Premise, CloudOn-Premise (54.0% share)Cloud (20.6% CAGR)
By End-user IndustryBFSI, Retail, IT and Telecommunications, Manufacturing, Government and Public Sector, Other End-user IndustriesBFSI (27.5% share)Retail (19.4% CAGR)
By RegionNorth America, Europe, Asia-Pacific, Latin America, Middle East & AfricaNorth America (38.5% share)Asia-Pacific (20.4% CAGR (2026–2035))


Market Segmentation Overview

By Deployment

Sub-SegmentKey Trend
On-PremiseRefresh cycles shifting toward CXL-ready servers and hybrid control planes
CloudManaged, consumption-priced services absorbing new analytical workloads


On-Premise leads with a 54.0% share because regulated buyers in banking and government still require direct control over where sensitive data sits in memory. Cloud grows fastest at a 20.6% CAGR, since metered services remove the large upfront DRAM outlay and scale capacity with seasonal peaks. Hybrid designs that keep regulated data on-premises while bursting to the cloud are narrowing the gap between the two modes.

By End-user Industry

Sub-SegmentKey Trend
BFSIMillisecond fraud scoring and DORA-aligned risk monitoring
RetailDynamic pricing and unified store and e-commerce inventory
IT and TelecommunicationsNetwork assurance and real-time subscriber analytics
ManufacturingEdge-based predictive maintenance and quality inspection
Government and Public SectorTax analytics and smart-government services
Other End-user IndustriesClinical, energy, and logistics monitoring


BFSI holds the largest share at 27.5% because instant payments and fraud losses leave banks no tolerance for batch delays in transaction scoring. Retail grows fastest at a 19.4% CAGR, as merchants use memory-resident engines to reprice products and reconcile inventory across stores and online channels within minutes. IT and Telecommunications and Manufacturing follow, with network-slice assurance and factory telemetry driving steady expansion.




Download PDF ×

We do not share your information with anyone. However, we may send you emails based on your report interest from time to time. You may contact us at any time to opt-out.