• Cat-intel
  • MedIntelliX
  • Resources
  • About Us
  • Hero Background
    English
    Chinese
    French
    Japanese
    Korean
    German
    Spanish

    Immersive Technology in Gaming Industry Market Size

    ID: MRFR/ICT/10610-HCR
    128 Pages
    Ankit Gupta
    October 2025

    Immersive Technology in Gaming Industry Market Research Report Information By Component (Hardware, Head-Mounted Display (HMD), Gesture Tracking Devices (GTD), Projectors & Display Walls (PDW), Software/Platform, Services, Professional and Managed), By Technology (Mixed Reality (MR), Virtual Reality (VR), Augmented Reality (AR) and 360 Film), By Application (Training & Learning, Emergenc...

    Share:
    Download PDF ×

    We do not share your information with anyone. However, we may send you emails based on your report interest from time to time. You may contact us at any time to opt-out.

    Immersive Technology in Gaming Industry Market Infographic
    $ 4,950.0
    $ 5,950.0
    $ 7,250.0

    Immersive Technology In Gaming Industry Size

    Immersive Technology in Gaming Industry Market Growth Projections and Opportunities

    The market dynamics of immersive technology in gaming are undergoing significant shifts driven by various factors reshaping the landscape of gaming experiences. Immersive technologies, such as virtual reality (VR), augmented reality (AR), and mixed reality (MR), have revolutionized the way players engage with video games, offering immersive, interactive, and lifelike experiences. As technology advances and consumer preferences evolve, the demand for immersive gaming experiences continues to grow, fueling innovation and competition in the gaming industry.

    One of the primary drivers behind the evolving market dynamics is the advancement of immersive technologies and hardware. Over the past decade, significant advancements have been made in VR and AR technologies, resulting in more affordable, accessible, and high-quality immersive gaming experiences. VR headsets, such as Oculus Rift, HTC Vive, and PlayStation VR, offer players immersive worlds and interactive gameplay, while AR-enabled devices, such as smartphones and tablets, overlay digital content onto the real world, creating unique gaming experiences.

    Moreover, the increasing popularity of esports and multiplayer gaming is driving demand for immersive gaming experiences that offer social interaction and competitive gameplay. Immersive technologies enable players to collaborate, compete, and communicate with friends and strangers in virtual environments, enhancing the social aspect of gaming. VR esports tournaments, for example, attract millions of viewers and participants worldwide, showcasing the potential of immersive gaming experiences to engage audiences and drive community engagement.

    Furthermore, the rise of digital distribution platforms and cloud gaming services has democratized access to immersive gaming experiences, making them more accessible to players around the world. Digital storefronts, such as Steam, Oculus Store, and PlayStation Store, offer a wide range of VR and AR games for download, allowing players to access immersive gaming content from the comfort of their homes. Cloud gaming services, such as Google Stadia, NVIDIA GeForce Now, and Xbox Cloud Gaming, stream immersive gaming experiences to a variety of devices, eliminating the need for expensive hardware and enabling players to enjoy high-quality gaming experiences on any device with an internet connection.

    Additionally, the integration of immersive technologies into existing gaming franchises and genres is driving innovation and expanding the market for immersive gaming experiences. Game developers are leveraging VR, AR, and MR technologies to create new gameplay mechanics, storytelling techniques, and interactive experiences that enhance immersion and engagement. From first-person shooters and role-playing games to puzzle games and simulations, immersive technologies are transforming traditional gaming experiences and opening up new possibilities for creativity and innovation in game design.

    Moreover, the COVID-19 pandemic has accelerated the adoption of immersive gaming experiences as players seek out virtual worlds and escapism during times of social distancing and lockdowns. With traditional entertainment options limited and social gatherings restricted, players turned to immersive gaming experiences to connect with friends, explore virtual worlds, and escape from the stresses of everyday life. The pandemic also highlighted the potential of immersive technologies to facilitate remote social interaction and collaboration, driving interest and investment in VR and AR gaming experiences.

    Furthermore, the increasing convergence of entertainment and technology is driving collaboration and partnerships between gaming companies, content creators, and technology providers to create immersive gaming experiences. Gaming companies are partnering with Hollywood studios, musicians, and brands to create immersive gaming experiences that blend storytelling, music, and interactive gameplay. Technology providers are collaborating with game developers to integrate immersive technologies into existing gaming platforms and create new hardware and software solutions that enhance immersion and engagement.

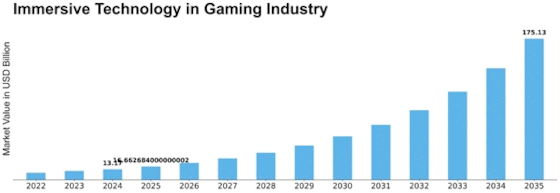
    Immersive Technology in Gaming Industry Market Size Graph

    Market Summary

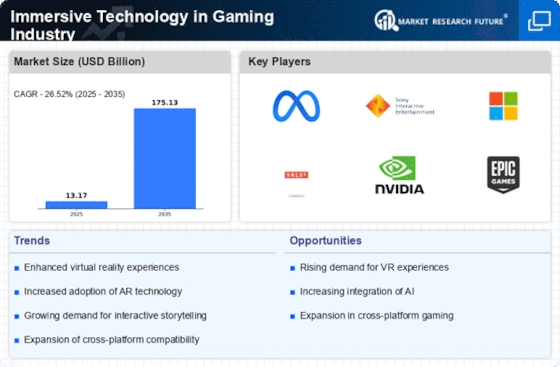
    As per Market Research Future Analysis, the Immersive Technology in Gaming Industry is poised for significant growth, expanding from USD 16.66 billion in 2025 to USD 175.13 billion by 2035, with a robust CAGR of 26.52% during the forecast period. The market was valued at USD 13.17 billion in 2024, driven by enhanced gaming experiences, hardware advancements, and the growth of eSports. The North American region dominated the market in 2022, accounting for 45.80% of the share, with the U.S. leading in market demand.

    Key Market Trends & Highlights

    Key trends driving the Immersive Technology in Gaming Industry include:

    • Enhanced Gaming Experience through VR technology is a primary growth driver.
    • The Hardware segment led the market in 2022, focusing on user-friendly designs.
    • VR technology dominated the market, particularly in competitive gaming.
    • Product Development generated the most revenue in 2022, emphasizing haptic feedback.

    Market Size & Forecast

    2024 Market Size USD 13.17 Billion
    2035 Market Size USD 175.13 Billion
    CAGR 26.52%
    Largest Regional Market Share in 2022 North America (45.80%)

    Major Players

    Key players include Acer Inc., Google LLC, HTC Corporation, Sony Corporation, and Unity Software Inc.

    Market Trends

    Enhanced Gaming Experience is driving the market growth

    Gamers seek an immersive experience that makes them feel like a part of the game. This urge is specifically satisfied by VR technology, which takes gamers into virtual worlds. When you put on a VR headset, you stop only managing a character on a screen and instead take on the role of that character, experiencing the game world from their point of view. The adoption of VR in gaming is being fueled by this unmatched level of immersion.

    Players' emotions can be strongly evoked through immersive technologies. In VR, the feeling of presence and the capacity to engage more deeply with virtual worlds and characters can elicit powerful emotional reactions. Immersive technology intensifies these emotional experiences, making gaming more intriguing and memorable, whether it is the dread of playing a horror game, the exhilaration of playing a racing simulation, or the wonder of exploring magical realms.

    Immersive gaming is characterized by higher levels of engagement. Players can interact with the game environment and objects in VR and AR by making hand motions, body movements, and even vocalizations. Traditional gaming interfaces can't compete with the physicality and engagement that this hands-on approach to gaming brings. Because of the interactivity, players keep coming back for more in search of fresh and different experiences.

    Experiences in social gaming are being improved via immersive technologies. In virtual environments where they may communicate and work together as if they were physically present, users can connect with friends and other players in multiplayer VR games. Its appeal is being driven by this social component of VR gaming, especially during times when opportunities for in-person interactions are scarce.

    The potential of immersive technology is constantly being pushed by game makers. They are experimenting with novel gaming mechanics, narrative strategies, and visual effects that are only possible in virtual reality or augmented reality. Gamers find this desire for innovation thrilling, and it also draws in new audiences to the gaming sector. Thus, driving the Immersive Technology in Gaming Industry market revenue.

    The integration of immersive technologies in gaming is poised to redefine user experiences, fostering deeper engagement and interaction within virtual environments.

    U.S. Department of Commerce

    Immersive Technology in Gaming Industry Market Market Drivers

    Market Growth Charts

    Increased Consumer Demand

    Consumer demand for immersive gaming experiences is a primary driver of the Global Immersive Technology in Gaming Industry. Gamers are increasingly seeking more engaging and realistic experiences, which immersive technologies can provide. The rise of esports and online gaming communities has further fueled this demand, as players desire competitive and interactive environments. By 2035, the market is projected to reach 175.1 USD Billion, indicating a robust appetite for immersive gaming solutions. This growing consumer interest suggests that developers and publishers will likely continue to invest in immersive technologies to meet evolving player expectations.

    Technological Advancements

    The Global Immersive Technology in Gaming Industry experiences rapid growth due to continuous technological advancements. Innovations in virtual reality (VR), augmented reality (AR), and mixed reality (MR) are enhancing user experiences, making gaming more engaging and interactive. For instance, the introduction of high-resolution displays and haptic feedback systems has significantly improved immersion levels. As of 2024, the market is valued at 5.74 USD Billion, reflecting the increasing demand for immersive gaming experiences. This trend is likely to continue, as advancements in hardware and software are expected to drive further growth in the coming years.

    Expansion of Gaming Platforms

    The expansion of gaming platforms plays a crucial role in the growth of the Global Immersive Technology in Gaming Industry. With the proliferation of consoles, PCs, and mobile devices, more players have access to immersive gaming experiences. The rise of cloud gaming services also enables users to enjoy high-quality games without the need for expensive hardware. This accessibility is likely to broaden the market reach and attract a diverse audience. As the industry evolves, it is anticipated that the integration of immersive technologies will become standard across various platforms, further driving market growth.

    Investment in Research and Development

    Investment in research and development is vital for the advancement of the Global Immersive Technology in Gaming Industry. Companies are allocating significant resources to explore new technologies and enhance existing ones. This commitment to innovation is evident in the development of more sophisticated VR headsets and AR applications that provide unparalleled user experiences. The anticipated compound annual growth rate (CAGR) of 36.44% from 2025 to 2035 underscores the importance of R&D in maintaining competitive advantage. As firms continue to innovate, the market is likely to witness an influx of groundbreaking immersive gaming solutions.

    Growing Adoption of AR and VR Technologies

    The growing adoption of AR and VR technologies is a key driver of the Global Immersive Technology in Gaming Industry. These technologies are increasingly being integrated into mainstream gaming, offering players unique experiences that blend the virtual and real worlds. For example, popular titles are now incorporating AR features that enhance gameplay and interaction. This trend is expected to contribute significantly to the market's growth, with projections indicating a substantial increase in revenue. As more developers embrace these technologies, the immersive gaming landscape is likely to evolve, attracting a broader audience and fostering further innovation.

    Market Segment Insights

    Immersive Technology in Gaming Industry Component Insights

    The Immersive Technology in Gaming Industry market segmentation, based on Component, includes Hardware, Head-Mounted Display (HMD), Gesture Tracking Devices (GTD), Projectors & Display Walls (PDW), Software/Platform, Services, Professional and Managed. The Hardware segment dominated the market in 2022. Hardware manufacturers have been working to make VR headsets and AR glasses more comfortable, lightweight, and user-friendly. Enhanced ergonomics and reduced bulkiness encourage longer gaming sessions and better user experiences.

    Immersive Technology in Gaming Industry Technology Insights

    The Immersive Technology in Gaming Industry market segmentation, based on Technology, includes Mixed Reality (MR), Virtual Reality (VR), Augmented Reality (AR) and 360 Film. The Virtual Reality (VR) segment dominated the market in 2022. VR is firmly entrenched in the world of competitive gaming. Games like "Beat Saber" and "Echo VR" have flourishing e-sports ecosystems that draw both participants and spectators. In addition to deepening the experience, the competitive nature of VR gaming also piques interest in the technology.

    Immersive Technology in Gaming Industry Application Insights

    The Immersive Technology in Gaming Industry market segmentation, based on Application, includes Training & Learning, Emergency Services, Product Development and Sales & Marketing. The Product Development category generated the most income in 2022. The feeling of touch and engagement in immersive gaming is enhanced by the incorporation of haptic feedback and advanced input devices. Products that give a more immersive tactile experience, such haptic gloves or motion controllers, are the focus of product development efforts.

    Figure 1: Immersive Technology in Gaming Industry Market, by Technology, 2022 & 2032 (USD Billion)

    Source: Secondary Research, Primary Research, Market Research Future Database and Analyst Review

    Get more detailed insights about Immersive Technology in Gaming Industry Market Research Report – Forecast till 2034

    Regional Insights

    By region, the study provides the market insights into North America, Europe, Asia-Pacific and Rest of the World. The North America Immersive Technology in Gaming Industry Market dominated this market in 2022 (45.80%). There is a sizable gaming community in the US. The popularity of Valve Corporation's VR headgear, the Valve Index, serves as a prime illustration of the market's need for immersive technology.

    One of the biggest names in the gaming business, Valve, saw the promise of virtual reality and produced the Index headgear, which offers premium VR experiences and works with well-known titles like "Half-Life: Alyx." The overwhelmingly positive response from gamers in North America demonstrates the market's hunger for immersive gaming. Further, the U.S. Immersive Technology in Gaming Industry market held the largest market share, and the Canada Immersive Technology in Gaming Industry market was the fastest growing market in the North America region.

    Further, the major countries studied in the market report are The U.S., Canada, German, France, the UK, Italy, Spain, China, Japan, India, Australia, South Korea, and Brazil.

    Figure 2: IMMERSIVE TECHNOLOGY IN GAMING INDUSTRY MARKET SHARE BY REGION 2022 (USD Billion)

    IMMERSIVE TECHNOLOGY IN GAMING INDUSTRY MARKET SHARE BY REGION,

    Source: Secondary Research, Primary Research, Market Research Future Database and Analyst Review

    Europe Immersive Technology in Gaming Industry market accounts for the second-largest market share. Europe's diverse cultures and historical richness serve as an inspiration for immersive gaming experiences. One notable example is "Assassin's Creed" by Ubisoft, a game series that explores different historical settings, including Renaissance Italy, ancient Egypt, and Viking-era Norway. Ubisoft, headquartered in France, leverages Europe's cultural diversity to create captivating game worlds that resonate with a audience.

    Further, the German Immersive Technology in Gaming Industry market held the largest market share, and the UK Immersive Technology in Gaming Industry market was the fastest growing market in the European region.

    The Asia-Pacific Immersive Technology in Gaming Industry Market is expected to grow at the fastest CAGR from 2023 to 2032. China, Japan, and South Korea are among the Asia-Pacific nations that dominate the mobile gaming industry. Games like "Pokémon GO" (created by Niantic) are a prime example of how augmented reality and mobile gaming have combined. The popularity of the game encouraged many mobile gamers in the area to start using AR technology.

    Moreover, China’s Immersive Technology in Gaming Industry market held the largest market share, and the Indian Immersive Technology in Gaming Industry market was the fastest growing market in the Asia-Pacific region.

    Key Players and Competitive Insights

    Leading market players are investing heavily in research and development in order to expand their product lines, which will help the Immersive Technology in Gaming Industry market, grow even more. Market participants are also undertaking a variety of strategic activities to expand their footprint, with important market developments including new product launches, contractual agreements, mergers and acquisitions, higher investments, and collaboration with other organizations. To expand and survive in a more competitive and rising market climate, Immersive Technology in Gaming Industry industry must offer cost-effective items.

    Manufacturing locally to minimize operational costs is one of the key business tactics used by manufacturers in the Immersive Technology in Gaming Industry industry to benefit clients and increase the market sector. In recent years, the Immersive Technology in Gaming Industry industry has offered some of the most significant advantages to medicine.

    Major players in the Immersive Technology in Gaming Industry market, including Acer Inc., Atheer, Inc., AVEVA Group PLC, Barco NV, Blippar Ltd., Carl Zeiss AG, CM Labs Simulations Inc., EON Reality, Inc., FAAC Incorporated, Google, LLC, HCL Technologies Limited, Honeywell International, Inc., HTC Corporation, Immersive Media Company, Immersive Technologies Pty Limited, Lockheed Martin Corporation, Magic Leap, Inc., NCTech Limited, Oculus (Facebook Technologies, LLC.), Samsung Group, Sony Corporation, Unity Software Inc., Varjo Technologies Oy, VI-grade GmbH, Zeality Inc. and others, are attempting to increase market demand by investing in research and development operations.

    Google LLC (Google), an affiliate of Alphabet Inc., provides online search and advertising services. The company's primary business segments include advertising, search, platforms and operating systems, enterprise products, and hardware. These are just a few of the products and services it provides: Google Search, Google Chrome, Google Docs, Google Calendar, Google Photos, Google Meet, Google Drive, Google Finance, Google Play Books, Google News, Google Earth, Google Ad Manager, Google Play, AdMob, Google Maps, AdSense, Gmail, Google Groups, and YouTube. The business has operations in the Americas, Europe, Asia-Pacific, Middle East, and Africa.

    Google's main office is located in Mountain View, California, in the United States.

    HCL Technologies Ltd (HCL) is a provider of software and IT infrastructure services. The company offers a wide range of services in the following areas: industry software services, engineering and R&D services, cybersecurity, cloud native services, digital and analytics services, DRYiCE, IoT works, HCL software services, SIAM/XaaS products & advanced services. The following sectors are served by HCL: banking, finance, manufacturing, telecommunications, retail and CPG, media and entertainment, life sciences, insurance, capital markets, oil and gas, mining and natural resources, automotive, chemical and process industries, high-tech, industrial manufacturing, energy and utility, healthcare, travel, transportation, hospitality, and logistics.

    The company operates an international offshore infrastructure in addition to a network of offices across the Americas, Asia-Pacific, the Middle East, Africa, and Europe. HCL's headquarters are in Noida, Uttar Pradesh, in India.

    Key Companies in the Immersive Technology in Gaming Industry Market market include

    Industry Developments

    In March 2022, StatusPRO, Inc., a sports tech and gaming company, has teamed up with the National Football League to create an NFL-authorized virtual-reality video game.

    This December 2021 deal between Brelyon (an MIT spin-off making innovative ultra-immersive display technologies) and GameWorks (a leading eSport and entertainment company) on deploying virtual display technology for e-sports is mind-blowing. GameWorks’ American locations are to have Brelyon’s full-size gaming stations.

    Collaboration among Oculus VR, indie studio Armature, and publisher Capcom led Resident Evil 4 VR remake onto Oculus Quest 2 in April 2021. Facebook, its parent company, is looking to continue using Quest as a marketing tool.

    In April 2024, XR Immersive Tech Inc. (“Immersive Tech”, or the “Company”) (CSE: VRAI) (FSE:79W) (OTCQB: FNTTF), an industry leader in Social Entertainment, AI, VR, and AR content and experiences, is thrilled to announce the partnership with Smilegate Entertainment Inc to bring one of most popular first-person shooter VR games in the world Crossfire: Sierra Squad to VR locations worldwide through its subsidiary Synthesis VR (SynthesisVR). The SynthesisVR software platform is one of the largest VR out-of-home entertainment marketplaces for games, educational experiences, and training worldwide.

    SynthesisVR has over 450 VR arcades globally and a market of over 400+ VR games.

    During May 2024 month’s end, i.e., on May 23rd, Sony revealed its “Creative Entertainment Vision” during a corporate strategy meeting. This plan outlines what the company wants to achieve in the next decade by highlighting how new technology will change entertainment. SONY’S CREATIVE ENTERTAINMENT VISION serves as a compass for future business decisions and investments, where they want to be in ten years, given the rapid technological developments that are reshaping entertainment.

    An Indian metaverse research and advisory firm, Metaverse911, has established a Metaverse Experience Centre (MEC) in Noida. The firm officially launched this experience center on Tuesday to enable industry leaders and other Web3 enthusiasts to discover its potential. The center will let visitors indulge in immersive technologies that include Augmented Reality (AR) and Virtual Reality (VR) — all of which make for key components that bring the digital ecosystem to life in the metaverse.

    Future Outlook

    Immersive Technology in Gaming Industry Market Future Outlook

    The Global Immersive Technology in Gaming Industry is projected to grow at a 26.52% CAGR from 2025 to 2035, driven by advancements in VR/AR technology and increasing consumer demand.

    New opportunities lie in:

    • Develop cross-platform immersive experiences to enhance user engagement.
    • Invest in AI-driven content creation tools for personalized gaming experiences.
    • Leverage cloud gaming technologies to expand accessibility and reach.

    By 2035, the market is poised to achieve substantial growth, reflecting a dynamic evolution in gaming experiences.

    Market Segmentation

    Immersive Technology in Gaming Industry Regional Outlook

    • U.S.
    • Canada

    Immersive Technology in Gaming Industry Component Outlook

    • Hardware
    • Head-Mounted Display (HMD)
    • Gesture Tracking Devices (GTD)
    • Projectors & Display Walls (PDW)
    • Software/Platform
    • Services
    • Professional
    • Managed

    Immersive Technology in Gaming Industry Technology Outlook

    • Mixed Reality (MR)
    • Virtual Reality (VR)
    • Augmented Reality (AR)
    • 360 Film

    Immersive Technology in Gaming Industry Application Outlook

    • Training & Learning
    • Emergency Services
    • Product Development
    • Sales & Marketing

    Report Scope

    Report Attribute/Metric Details
    Market Size 2024 13.17 (USD Billion)
    Market Size 2025 16.66 (USD Billion)
    Market Size 2035 175.13 (USD Billion)
    Compound Annual Growth Rate (CAGR) 26.52% (2025 - 2035)
    Report Coverage Revenue Forecast, Competitive Landscape, Growth Factors, and Trends
    Base Year 2024
    Market Forecast Period 2025 - 2035
    Historical Data 2019 - 2023
    Market Forecast Units USD Billion
    Segments Covered Component, Technology, Application, and Region
    Geographies Covered North America, Europe, Asia Pacific, and the Rest of the World
    Countries Covered The U.S., Canada, German, France, UK, Italy, Spain, China, Japan, India, Australia, South Korea, and Brazil
    Key Companies Profiled Acer Inc., Atheer, Inc., AVEVA Group PLC, Barco NV, Blippar Ltd., Carl Zeiss AG, CM Labs Simulations Inc., EON Reality, Inc., FAAC Incorporated, Google, LLC, HCL Technologies Limited, Honeywell International, Inc., HTC Corporation, Immersive Media Company, Immersive Technologies Pty Limited, Lockheed Martin Corporation, Magic Leap, Inc., NCTech Limited, Oculus (Facebook Technologies, LLC.), Samsung Group, Sony Corporation, Unity Software Inc., Varjo Technologies Oy, VI-grade GmbH, Zeality Inc.
    Key Market Opportunities Social VR platforms and multiplayer VR experiences are promoting social connections in virtual environments.
    Key Market Dynamics The development of high-quality, exclusive VR and AR content as a result of cooperation between tech firms, gaming studios, and content producers is enhancing the appeal of immersive technology.

    Market Highlights

    Author

    Ankit Gupta
    Senior Research Analyst

    She holds an experience of about 6+ years in market research and business consulting, working under the spectrum of information communication technology, telecommunications and semiconductor domains. aarti conceptualizes and implements a scalable business strategy and provides strategic leadership to the clients. her expertise lies in market estimation, competitive intelligence, pipeline analysis, customer assessment, etc.

    Leave a Comment

    Latest Comments

    John Doe
    john@example.com

    This is a great article! Really helped me understand the topic better.

    Posted on July 23, 2025, 10:15 AM
    Jane Smith
    jane@domain.com

    Thanks for sharing this. I’ve bookmarked it for later reference.

    Posted on July 22, 2025, 7:45 PM

    FAQs

    How much is the Immersive Technology in Gaming Industry market?

    The global Immersive Technology in Gaming Industry market size was valued at USD 13.17 Billion in 2024.

    What is the growth rate of the Immersive Technology in Gaming Industry market?

    The global market is projected to grow at a CAGR of 26.52% during the forecast period, 2025-2034.

    Which region held the largest market share in the Immersive Technology in Gaming Industry market?

    North America had the largest share in the market

    Who are the key players in the Immersive Technology in Gaming Industry market?

    The key players in the market are Acer Inc., Atheer, Inc., AVEVA Group PLC, Barco NV, Blippar Ltd., Carl Zeiss AG, CM Labs Simulations Inc., EON Reality, Inc., FAAC Incorporated, Google, LLC, HCL Technologies Limited, Honeywell International, Inc., HTC Corporation, Immersive Media Company, Immersive Technologies Pty Limited, Lockheed Martin Corporation, Magic Leap, Inc., NCTech Limited, Oculus (Facebook Technologies, LLC.), Samsung Group, Sony Corporation, Unity Software Inc., Varjo Technologies Oy, VI-grade GmbH, Zeality Inc.

    Which Technology led the Immersive Technology in Gaming Industry market?

    The Virtual Reality (VR) category dominated the market in 2022.

    Which Application had the largest market share in the Immersive Technology in Gaming Industry market?

    The Product Development had the largest share in the market.

    1. Table of Contents
    2. Executive Summary
    3. Market Introduction
      1. Definition
      2. Scope of the Study
        1. Research Objective
        2. Assumptions
        3. Limitations
    4. Research Methodology
      1. Overview
      2. Data Mining
      3. Secondary Research
      4. Primary Research
        1. Primary Interviews and Information Gathering Process
        2. Breakdown of Primary Respondents
      5. Forecasting Modality
      6. Market Size Estimation
        1. Bottom-up Approach
        2. Top-Down Approach
      7. Data Triangulation
      8. Validation
    5. Market Dynamics
      1. Overview
      2. Drivers
      3. Restraints
      4. Opportunities
    6. Market Factor Analysis
      1. Value Chain Analysis
      2. Porter’s Five Forces Analysis
        1. Bargaining Power of Suppliers
        2. Bargaining Power of Buyers
        3. Threat of New Entrants
        4. Threat of Substitutes
        5. Intensity of Rivalry
      3. COVID-19 Impact Analysis
        1. Market Impact Analysis
        2. Regional Impact
        3. Opportunity and Threat Analysis
    7. GLOBAL Immersive Technology in Gaming Industry MARKET, BY Component
      1. Overview
      2. Hardware
        1. Head-Mounted Display (HMD)
        2. Gesture Tracking Devices (GTD)
        3. Projectors & Display Walls (PDW)
      3. Software/Platform
      4. Services
        1. Professional
        2. Managed
    8. GLOBAL Immersive Technology in Gaming Industry MARKET, BY Technology
      1. Overview
      2. Mixed Reality (MR)
      3. Virtual Reality (VR)
      4. Augmented Reality (AR)
      5. 360 Film
    9. GLOBAL Immersive Technology in Gaming Industry MARKET, BY Application
      1. Overview
      2. Training & Learning
      3. Emergency Services
      4. Product Development
      5. Sales & Marketing
    10. GLOBAL Immersive Technology in Gaming Industry MARKET, by Region
      1. Overview
      2. North America
        1. U.S.
        2. Canada
      3. Europe
        1. Germany
        2. France
        3. U.K
        4. Italy
        5. Spain
        6. Rest of Europe
      4. Asia-Pacific
        1. China
        2. India
        3. Japan
        4. South Korea
        5. Australia
        6. Rest of Asia-Pacific
      5. Rest of the World
        1. Middle East
        2. Africa
        3. Latin America
    11. Competitive Landscape
      1. Overview
      2. Competitive Analysis
      3. Market Share Analysis
      4. Major Growth Strategy in the Global Immersive Technology in Gaming Industry Market,
      5. Competitive Benchmarking
      6. Leading Players in Terms of Number of Developments in the Global Immersive Technology in Gaming Industry Market,
      7. Key developments and Growth Strategies
        1. New Component Launch/Technology Application
        2. Merger & Acquisitions
        3. Joint Ventures
      8. Major Players Financial Matrix
        1. Sales & Operating Income, 2022
        2. Major Players R&D Expenditure. 2022
    12. Company ProfileS
      1. ACER INC.
        1. Company Overview
        2. Financial Overview
        3. Product Offered
        4. Key Developments
        5. SWOT Analysis
        6. Key Strategies
      2. Atheer, Inc.
        1. Company Overview
        2. Financial Overview
        3. Product Offered
        4. Key Developments
        5. SWOT Analysis
        6. Key Strategies
      3. AVEVA Group PLC
        1. Company Overview
        2. Financial Overview
        3. Product Offered
        4. Key Developments
        5. SWOT Analysis
        6. Key Strategies
      4. Barco NV
        1. Company Overview
        2. Financial Overview
        3. Product Offered
        4. Key Developments
        5. SWOT Analysis
        6. Key Strategies
      5. Blippar Ltd.
        1. Company Overview
        2. Financial Overview
        3. Product Offered
        4. Key Developments
        5. SWOT Analysis
        6. Key Strategies
      6. Carl Zeiss AG
        1. Company Overview
        2. Financial Overview
        3. Product Offered
        4. Key Developments
        5. SWOT Analysis
        6. Key Strategies
      7. CM Labs Simulations Inc.
        1. Company Overview
        2. Financial Overview
        3. Product Offered
        4. Key Developments
        5. SWOT Analysis
        6. Key Strategies
      8. EON Reality, Inc.
        1. Company Overview
        2. Financial Overview
        3. Product Offered
        4. Key Developments
        5. SWOT Analysis
        6. Key Strategies
      9. FAAC Incorporated
        1. Company Overview
        2. Financial Overview
        3. Product Offered
        4. Key Developments
        5. SWOT Analysis
        6. Key Strategies
      10. Google, LLC
        1. Company Overview
        2. Financial Overview
        3. Product Offered
        4. Key Developments
        5. SWOT Analysis
        6. Key Strategies
      11. HCL Technologies Limited
        1. Company Overview
        2. Financial Overview
        3. Product Offered
        4. Key Developments
        5. SWOT Analysis
        6. Key Strategies
      12. Honeywell International, Inc.
        1. Company Overview
        2. Financial Overview
        3. Product Offered
        4. Key Developments
        5. SWOT Analysis
        6. Key Strategies
      13. HTC Corporation
        1. Company Overview
        2. Financial Overview
        3. Product Offered
        4. Key Developments
        5. SWOT Analysis
        6. Key Strategies
      14. Immersive Media Company
        1. Company Overview
        2. Financial Overview
        3. Product Offered
        4. Key Developments
        5. SWOT Analysis
        6. Key Strategies
      15. Immersive Technologies Pty Limited
        1. Company Overview
        2. Financial Overview
        3. Product Offered
        4. Key Developments
        5. SWOT Analysis
        6. Key Strategies
      16. Lockheed Martin Corporation
        1. Company Overview
        2. Financial Overview
        3. Product Offered
        4. Key Developments
        5. SWOT Analysis
        6. Key Strategies
      17. Magic Leap, Inc.
        1. Company Overview
        2. Financial Overview
        3. Product Offered
        4. Key Developments
        5. SWOT Analysis
        6. Key Strategies
      18. NCTech Limited
        1. Company Overview
        2. Financial Overview
        3. Product Offered
        4. Key Developments
        5. SWOT Analysis
        6. Key Strategies
      19. Oculus (Facebook Technologies, LLC.)
        1. Company Overview
        2. Financial Overview
        3. Product Offered
        4. Key Developments
        5. SWOT Analysis
        6. Key Strategies
      20. Samsung Group
        1. Company Overview
        2. Financial Overview
        3. Product Offered
        4. Key Developments
        5. SWOT Analysis
        6. Key Strategies
      21. Sony Corporation
        1. Company Overview
        2. Financial Overview
        3. Product Offered
        4. Key Developments
        5. SWOT Analysis
        6. Key Strategies
      22. Unity Software Inc.
        1. Company Overview
        2. Financial Overview
        3. Product Offered
        4. Key Developments
        5. SWOT Analysis
        6. Key Strategies
      23. Varjo Technologies Oy
        1. Company Overview
        2. Financial Overview
        3. Product Offered
        4. Key Developments
        5. SWOT Analysis
        6. Key Strategies
      24. VI-grade GmbH
        1. Company Overview
        2. Financial Overview
        3. Product Offered
        4. Key Developments
        5. SWOT Analysis
        6. Key Strategies
      25. Zeality Inc.
        1. Company Overview
        2. Financial Overview
        3. Product Offered
        4. Key Developments
        5. SWOT Analysis
        6. Key Strategies
    13. Appendix
      1. References
      2. Related Reports
    14. List of Tables and Figures
      1. LIST OF TABLES
      2. TABLE 1 Global Immersive Technology in Gaming Industry Market, Synopsis, 2018-2032
      3. TABLE 2 Global Immersive Technology in Gaming Industry Market, Estimates & Forecast, 2018-2032 (USD BILLION)
      4. TABLE 3 GLOBAL Immersive Technology in Gaming Industry MARKET, BY Component, 2018-2032 (USD BILLION)
      5. TABLE 4 GLOBAL Immersive Technology in Gaming Industry MARKET, BY TECHNOLOGY, 2018-2032 (USD BILLION)
      6. TABLE 5 GLOBAL Immersive Technology in Gaming Industry MARKET, BY APPLICATION, 2018-2032 (USD BILLION)
      7. TABLE 6 North America Immersive Technology in Gaming Industry MARKET, BY Component, 2018-2032 (USD BILLION)
      8. TABLE 7 North America Immersive Technology in Gaming Industry MARKET, BY TECHNOLOGY, 2018-2032 (USD BILLION)
      9. TABLE 8 North America Immersive Technology in Gaming Industry MARKET, BY APPLICATION, 2018-2032 (USD BILLION)
      10. TABLE 9 North America Immersive Technology in Gaming Industry MARKET, BY Country, 2018-2032 (USD BILLION)
      11. TABLE 10 U.S. Immersive Technology in Gaming Industry MARKET, BY Component, 2018-2032 (USD BILLION)
      12. TABLE 11 U.S. Immersive Technology in Gaming Industry MARKET, BY TECHNOLOGY, 2018-2032 (USD BILLION)
      13. TABLE 12 U.S. Immersive Technology in Gaming Industry MARKET, BY APPLICATION, 2018-2032 (USD BILLION)
      14. TABLE 13 Canada Immersive Technology in Gaming Industry MARKET, BY Component, 2018-2032 (USD BILLION)
      15. TABLE 14 Canada Immersive Technology in Gaming Industry MARKET, BY TECHNOLOGY, 2018-2032 (USD BILLION)
      16. TABLE 15 Canada Immersive Technology in Gaming Industry MARKET, BY APPLICATION, 2018-2032 (USD BILLION)
      17. TABLE 16 Europe Immersive Technology in Gaming Industry MARKET, BY Component, 2018-2032 (USD BILLION)
      18. TABLE 17 Europe Immersive Technology in Gaming Industry MARKET, BY TECHNOLOGY, 2018-2032 (USD BILLION)
      19. TABLE 18 Europe Immersive Technology in Gaming Industry MARKET, BY APPLICATION, 2018-2032 (USD BILLION)
      20. TABLE 19 Europe Immersive Technology in Gaming Industry MARKET, BY Country, 2018-2032 (USD BILLION)
      21. TABLE 20 Germany Immersive Technology in Gaming Industry MARKET, BY Component, 2018-2032 (USD BILLION)
      22. TABLE 21 Germany Immersive Technology in Gaming Industry MARKET, BY TECHNOLOGY, 2018-2032 (USD BILLION)
      23. TABLE 22 Germany Immersive Technology in Gaming Industry MARKET, BY APPLICATION, 2018-2032 (USD BILLION)
      24. TABLE 23 France Immersive Technology in Gaming Industry MARKET, BY Component, 2018-2032 (USD BILLION)
      25. TABLE 24 France Immersive Technology in Gaming Industry MARKET, BY TECHNOLOGY, 2018-2032 (USD BILLION)
      26. TABLE 25 France Immersive Technology in Gaming Industry MARKET, BY APPLICATION, 2018-2032 (USD BILLION)
      27. TABLE 26 Italy Immersive Technology in Gaming Industry MARKET, BY Component, 2018-2032 (USD BILLION)
      28. TABLE 27 Italy Immersive Technology in Gaming Industry MARKET, BY TECHNOLOGY, 2018-2032 (USD BILLION)
      29. TABLE 28 Italy Immersive Technology in Gaming Industry MARKET, BY APPLICATION, 2018-2032 (USD BILLION)
      30. TABLE 29 Spain Immersive Technology in Gaming Industry MARKET, BY Component, 2018-2032 (USD BILLION)
      31. TABLE 30 Spain Immersive Technology in Gaming Industry MARKET, BY TECHNOLOGY, 2018-2032 (USD BILLION)
      32. TABLE 31 Spain Immersive Technology in Gaming Industry MARKET, BY APPLICATION, 2018-2032 (USD BILLION)
      33. TABLE 32 U.K Immersive Technology in Gaming Industry MARKET, BY Component, 2018-2032 (USD BILLION)
      34. TABLE 33 U.K Immersive Technology in Gaming Industry MARKET, BY TECHNOLOGY, 2018-2032 (USD BILLION)
      35. TABLE 34 U.K Immersive Technology in Gaming Industry MARKET, BY APPLICATION, 2018-2032 (USD BILLION)
      36. TABLE 35 Rest of Europe Immersive Technology in Gaming Industry MARKET, BY Component, 2018-2032 (USD BILLION)
      37. TABLE 36 Rest of Europe Immersive Technology in Gaming Industry MARKET, BY TECHNOLOGY, 2018-2032 (USD BILLION)
      38. TABLE 37 Rest of Europe Immersive Technology in Gaming Industry MARKET, BY APPLICATION, 2018-2032 (USD BILLION)
      39. TABLE 38 Asia Pacific Immersive Technology in Gaming Industry MARKET, BY Component, 2018-2032 (USD BILLION)
      40. TABLE 39 Asia Pacific Immersive Technology in Gaming Industry MARKET, BY TECHNOLOGY, 2018-2032 (USD BILLION)
      41. TABLE 40 Asia Pacific Immersive Technology in Gaming Industry MARKET, BY APPLICATION, 2018-2032 (USD BILLION)
      42. TABLE 41 Asia Pacific Immersive Technology in Gaming Industry MARKET, BY Country, 2018-2032 (USD BILLION)
      43. TABLE 42 Japan Immersive Technology in Gaming Industry MARKET, BY Component, 2018-2032 (USD BILLION)
      44. TABLE 43 Japan Immersive Technology in Gaming Industry MARKET, BY TECHNOLOGY, 2018-2032 (USD BILLION)
      45. TABLE 44 Japan Immersive Technology in Gaming Industry MARKET, BY APPLICATION, 2018-2032 (USD BILLION)
      46. TABLE 45 China Immersive Technology in Gaming Industry MARKET, BY Component, 2018-2032 (USD BILLION)
      47. TABLE 46 China Immersive Technology in Gaming Industry MARKET, BY TECHNOLOGY, 2018-2032 (USD BILLION)
      48. TABLE 47 China Immersive Technology in Gaming Industry MARKET, BY APPLICATION, 2018-2032 (USD BILLION)
      49. TABLE 48 India Immersive Technology in Gaming Industry MARKET, BY Component, 2018-2032 (USD BILLION)
      50. TABLE 49 India Immersive Technology in Gaming Industry MARKET, BY TECHNOLOGY, 2018-2032 (USD BILLION)
      51. TABLE 50 India Immersive Technology in Gaming Industry MARKET, BY APPLICATION, 2018-2032 (USD BILLION)
      52. TABLE 51 Australia Immersive Technology in Gaming Industry MARKET, BY Component, 2018-2032 (USD BILLION)
      53. TABLE 52 Australia Immersive Technology in Gaming Industry MARKET, BY TECHNOLOGY, 2018-2032 (USD BILLION)
      54. TABLE 53 Australia Immersive Technology in Gaming Industry MARKET, BY APPLICATION, 2018-2032 (USD BILLION)
      55. TABLE 54 south korea Immersive Technology in Gaming Industry MARKET, BY Component, 2018-2032 (USD BILLION)
      56. TABLE 55 south korea Immersive Technology in Gaming Industry MARKET, BY TECHNOLOGY, 2018-2032 (USD BILLION)
      57. TABLE 56 south korea Immersive Technology in Gaming Industry MARKET, BY APPLICATION, 2018-2032 (USD BILLION)
      58. TABLE 57 Rest of asia-pacific Immersive Technology in Gaming Industry MARKET, BY Component, 2018-2032 (USD BILLION)
      59. TABLE 58 Rest of asia-pacific Immersive Technology in Gaming Industry MARKET, BY TECHNOLOGY, 2018-2032 (USD BILLION)
      60. TABLE 59 Rest of asia-pacific Immersive Technology in Gaming Industry MARKET, BY APPLICATION, 2018-2032 (USD BILLION)
      61. TABLE 60 Rest of WOrld Immersive Technology in Gaming Industry MARKET, BY Component, 2018-2032 (USD BILLION)
      62. TABLE 61 Rest of WOrld Immersive Technology in Gaming Industry MARKET, BY TECHNOLOGY, 2018-2032 (USD BILLION)
      63. TABLE 62 Rest of WOrld Immersive Technology in Gaming Industry MARKET, BY APPLICATION, 2018-2032 (USD BILLION)
      64. TABLE 63 Rest of WOrld Immersive Technology in Gaming Industry MARKET, BY Country, 2018-2032 (USD BILLION)
      65. TABLE 64 Middle east Immersive Technology in Gaming Industry MARKET, BY Component, 2018-2032 (USD BILLION)
      66. TABLE 65 Middle east Immersive Technology in Gaming Industry MARKET, BY TECHNOLOGY, 2018-2032 (USD BILLION)
      67. TABLE 66 Middle east Immersive Technology in Gaming Industry MARKET, BY APPLICATION, 2018-2032 (USD BILLION)
      68. TABLE 67 Africa Immersive Technology in Gaming Industry MARKET, BY Component, 2018-2032 (USD BILLION)
      69. TABLE 68 Africa Immersive Technology in Gaming Industry MARKET, BY TECHNOLOGY, 2018-2032 (USD BILLION)
      70. TABLE 69 Africa Immersive Technology in Gaming Industry MARKET, BY APPLICATION, 2018-2032 (USD BILLION)
      71. TABLE 70 Latin america Immersive Technology in Gaming Industry MARKET, BY Component, 2018-2032 (USD BILLION)
      72. TABLE 71 Latin america Immersive Technology in Gaming Industry MARKET, BY TECHNOLOGY, 2018-2032 (USD BILLION)
      73. TABLE 72 Latin america Immersive Technology in Gaming Industry MARKET, BY APPLICATION, 2018-2032 (USD BILLION) LIST OF FIGURES
      74. FIGURE 1 Research Process
      75. FIGURE 2 Market Structure for the Global Immersive Technology in Gaming Industry Market
      76. FIGURE 3 Market Dynamics for the Global Immersive Technology in Gaming Industry Market
      77. FIGURE 4 Global Immersive Technology in Gaming Industry Market, Share (%), BY Component, 2022
      78. FIGURE 5 Global Immersive Technology in Gaming Industry Market, Share (%), BY TECHNOLOGY, 2022
      79. FIGURE 6 Global Immersive Technology in Gaming Industry Market, Share (%), BY APPLICATION, 2022
      80. FIGURE 7 Global Immersive Technology in Gaming Industry Market, Share (%), by Region, 2022
      81. FIGURE 8 north AMERICA: Immersive Technology in Gaming Industry MARKET, SHARE (%), BY REGION, 2022
      82. FIGURE 9 Europe: Immersive Technology in Gaming Industry MARKET, SHARE (%), BY REGION, 2022
      83. FIGURE 10 Asia-Pacific: Immersive Technology in Gaming Industry MARKET, SHARE (%), BY REGION, 2022
      84. FIGURE 11 Rest of the world: Immersive Technology in Gaming Industry MARKET, SHARE (%), BY REGION, 2022
      85. FIGURE 12 Global Immersive Technology in Gaming Industry Market: Company Share Analysis, 2022 (%)
      86. FIGURE 13 ACER INC.: FINANCIAL OVERVIEW SNAPSHOT
      87. FIGURE 14 ACER INC.: SWOT ANALYSIS
      88. FIGURE 15 Atheer, Inc.: FINANCIAL OVERVIEW SNAPSHOT
      89. FIGURE 16 Atheer, Inc., Inc.: SWOT ANALYSIS
      90. FIGURE 17 AVEVA Group PLC.: FINANCIAL OVERVIEW SNAPSHOT
      91. FIGURE 18 AVEVA Group PLC: SWOT ANALYSIS
      92. FIGURE 19 Barco NV: FINANCIAL OVERVIEW SNAPSHOT
      93. FIGURE 20 Barco NV: SWOT ANALYSIS
      94. FIGURE 21 Blippar Ltd.: FINANCIAL OVERVIEW SNAPSHOT
      95. FIGURE 22 Blippar Ltd.: SWOT ANALYSIS
      96. FIGURE 23 Carl Zeiss AG: FINANCIAL OVERVIEW SNAPSHOT
      97. FIGURE 24 Carl Zeiss AG: SWOT ANALYSIS
      98. FIGURE 25 CM Labs Simulations Inc.: FINANCIAL OVERVIEW SNAPSHOT
      99. FIGURE 26 CM Labs Simulations Inc.: SWOT ANALYSIS
      100. FIGURE 27 EON Reality, Inc.: FINANCIAL OVERVIEW SNAPSHOT
      101. FIGURE 28 EON Reality, Inc.: SWOT ANALYSIS
      102. FIGURE 29 FAAC Incorporated: FINANCIAL OVERVIEW SNAPSHOT
      103. FIGURE 30 FAAC Incorporated: SWOT ANALYSIS
      104. FIGURE 31 Google, LLC: FINANCIAL OVERVIEW SNAPSHOT
      105. FIGURE 32 Google, LLC.: SWOT ANALYSIS
      106. FIGURE 33 HCL Technologies Limited: FINANCIAL OVERVIEW SNAPSHOT
      107. FIGURE 34 HCL Technologies Limited: SWOT ANALYSIS
      108. FIGURE 35 Honeywell International, Inc.: FINANCIAL OVERVIEW SNAPSHOT
      109. FIGURE 36 Honeywell International, Inc.: SWOT ANALYSIS
      110. FIGURE 37 HTC Corporation: FINANCIAL OVERVIEW SNAPSHOT
      111. FIGURE 38 HTC Corporation: SWOT ANALYSIS
      112. FIGURE 39 Immersive Media Company: FINANCIAL OVERVIEW SNAPSHOT
      113. FIGURE 40 Immersive Media Company.: SWOT ANALYSIS
      114. FIGURE 41 Immersive Technologies Pty Limited: FINANCIAL OVERVIEW SNAPSHOT
      115. FIGURE 42 Immersive Technologies Pty Limited, LLC: SWOT ANALYSIS
      116. FIGURE 43 Lockheed Martin Corporation: FINANCIAL OVERVIEW SNAPSHOT
      117. FIGURE 44 Lockheed Martin Corporation: SWOT ANALYSIS
      118. FIGURE 45 NCTech Limited: FINANCIAL OVERVIEW SNAPSHOT
      119. FIGURE 46 NCTech Limited: SWOT ANALYSIS
      120. FIGURE 47 Oculus (Facebook Technologies, LLC.): FINANCIAL OVERVIEW SNAPSHOT
      121. FIGURE 48 Oculus (Facebook Technologies, LLC.): SWOT ANALYSIS
      122. FIGURE 49 Samsung Group: FINANCIAL OVERVIEW SNAPSHOT
      123. FIGURE 50 Samsung Group: SWOT ANALYSIS
      124. FIGURE 51 Sony Corporation: FINANCIAL OVERVIEW SNAPSHOT
      125. FIGURE 52 Sony Corporation: SWOT ANALYSIS
      126. FIGURE 53 Unity Software Inc.: FINANCIAL OVERVIEW SNAPSHOT
      127. FIGURE 54 Unity Software Inc.: SWOT ANALYSIS
      128. FIGURE 55 Varjo Technologies Oy: FINANCIAL OVERVIEW SNAPSHOT
      129. FIGURE 56 Varjo Technologies Oy: SWOT ANALYSIS
      130. FIGURE 57 VI-grade GmbH: FINANCIAL OVERVIEW SNAPSHOT
      131. FIGURE 58 VI-grade GmbH: SWOT ANALYSIS
      132. FIGURE 59 VI-grade GmbH: FINANCIAL OVERVIEW SNAPSHOT
      133. FIGURE 60 VI-grade GmbH: SWOT ANALYSIS

    Immersive Technology in Gaming Industry Market Segmentation

    Market Segmentation Overview

    • Detailed segmentation data will be available in the full report
    • Comprehensive analysis by multiple parameters
    • Regional and country-level breakdowns
    • Market size forecasts by segment
    Infographic

    Free Sample Request

    Kindly complete the form below to receive a free sample of this Report

    Get Free Sample

    Customer Strories

    “I am very pleased with how market segments have been defined in a relevant way for my purposes (such as "Portable Freezers & refrigerators" and "last-mile"). In general the report is well structured. Thanks very much for your efforts.”

    Victoria Milne

    Founder
    Case Study
    Chemicals and Materials