Certified Global Research Member
Isomar fd.webp Wcrc 57.webp
Key Questions Answered
  • Global Market Outlook
  • In-depth analysis of global and regional trends
  • Analyze and identify the major players in the market, their market share, key developments, etc.
  • To understand the capability of the major players based on products offered, financials, and strategies.
  • Identify disrupting products, companies, and trends.
  • To identify opportunities in the market.
  • Analyze the key challenges in the market.
  • Analyze the regional penetration of players, products, and services in the market.
  • Comparison of major playersโ€™ financial performance.
  • Evaluate strategies adopted by major players.
  • Recommendations
Why Choose Market Research Future?
  • Vigorous research methodologies for specific market.
  • Knowledge partners across the globe
  • Large network of partner consultants.
  • Ever-increasing/ Escalating data base with quarterly monitoring of various markets
  • Trusted by fortune 500 companies/startups/ universities/organizations
  • Large database of 5000+ markets reports.
  • Effective and prompt pre- and post-sales support.

High Density Interconnect PCB Market Research Report Information By Interconnection Layers (1 Layer (1+N+1) HDI, 2 or more layers (2+N+2) HDI, and All Layers HDI), Application (into Consumer Electronics, Automotive, Military and Defense, Healthcare, Industrial/ Manufacturing, and Others), and By Region (North America, Europe, Asia-Pacific, Middle East & Africa, and South America) - Forecast till 2032


ID: MRFR/SEM/5821-CR | 100 Pages | Author: Aarti Dhapte| April 2023

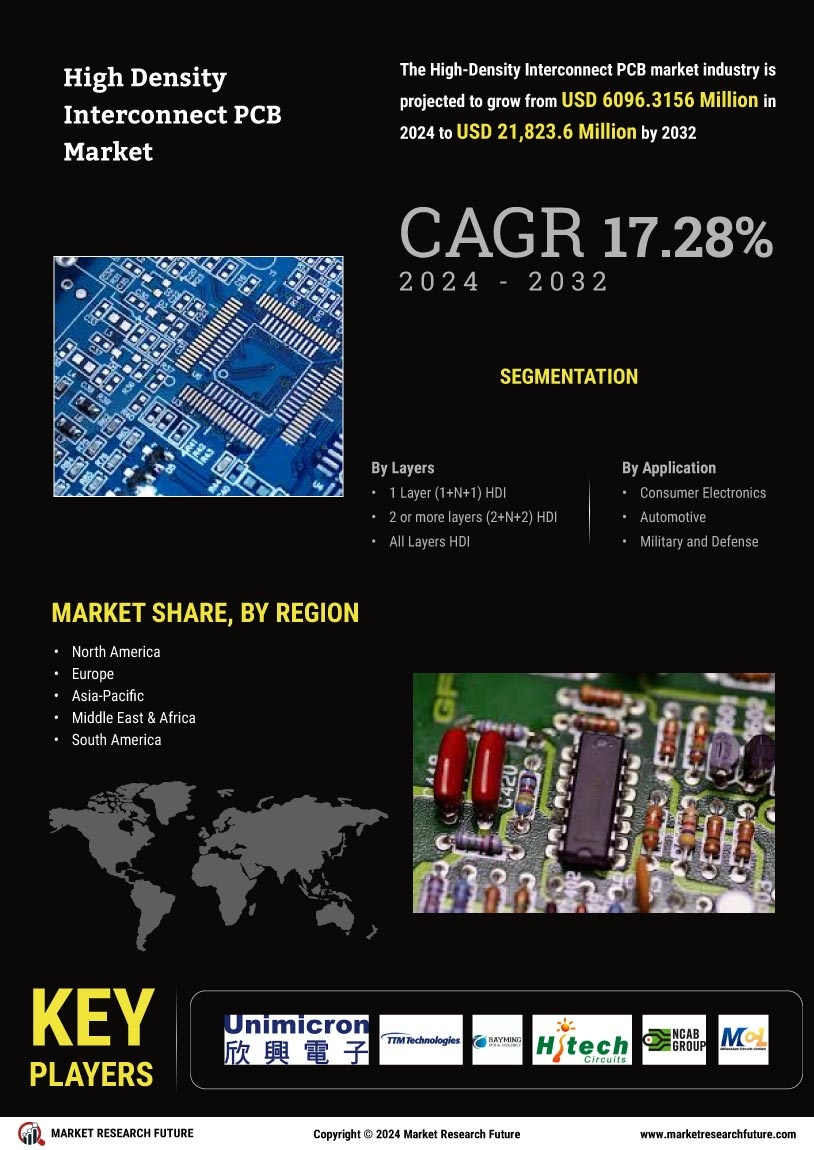
High Density Interconnect PCB Market Segmentation


Global High Density Interconnect PCB, By Interconnection Layers Outlook (USD Million, 2018-2032)


  • 1 Layer (1+N+1) HDI


  • 2 or more layers (2+N+2) HDI


  • All Layers HDI


Global High Density Interconnect PCB, By Application Outlook (USD Million, 2018-2032)


  • Consumer Electronics


  • Automotive


  • Military and Defense


  • Healthcare


  • Industrial/ Manufacturing


  • Others


Global High Density Interconnect PCB Regional Outlook (USD Million, 2018-2032)


  • North America Outlook (USD Million, 2018-2032)


  • North America High Density Interconnect PCB, By Interconnection Layers Outlook (USD Million, 2018-2032)


    • Layer (1+N+1) HDI


    • 2 or more layers (2+N+2) HDI


    • All Layers HDI


  • North America High Density Interconnect PCB, By Application (USD Million, 2018-2032)


    • Consumer Electronics


    • Automotive


    • Military and Defense


    • Healthcare


    • Industrial/ Manufacturing


    • Others


    • US Outlook (USD Million, 2018-2032)


    • US High Density Interconnect PCB, By Interconnection Layers Outlook (USD Million, 2018-2032)


      • Layer (1+N+1) HDI


      • 2 or more layers (2+N+2) HDI


      • All Layers HDI


    • US High Density Interconnect PCB, By Application (USD Million, 2018-2032)


      • Consumer Electronics


      • Automotive


      • Military and Defense


      • Healthcare


      • Industrial/ Manufacturing


      • Others


    • Canada Outlook (USD Million, 2018-2032)


    • Canada High Density Interconnect PCB, By Interconnection Layers Outlook (USD Million, 2018-2032)


      • Layer (1+N+1) HDI


      • 2 or more layers (2+N+2) HDI


      • All Layers HDI


    • Canada High Density Interconnect PCB, By Application (USD Million, 2018-2032)


      • Consumer Electronics


      • Automotive


      • Military and Defense


      • Healthcare


      • Industrial/ Manufacturing


      • Others


    • Mexico Outlook (USD Million, 2018-2032)


    • Mexico High Density Interconnect PCB, By Interconnection Layers Outlook (USD Million, 2018-2032)


      • Layer (1+N+1) HDI


      • 2 or more layers (2+N+2) HDI


      • All Layers HDI


    • Mexico High Density Interconnect PCB, By Application (USD Million, 2018-2032)


      • Consumer Electronics


      • Automotive


      • Military and Defense


      • Healthcare


      • Industrial/ Manufacturing


      • Others


  • Europe Outlook (USD Million, 2018-2032)


  • Europe High Density Interconnect PCB, By Interconnection Layers Outlook (USD Million, 2018-2032)


    • Layer (1+N+1) HDI


    • 2 or more layers (2+N+2) HDI


    • All Layers HDI


  • Europe High Density Interconnect PCB, By Application (USD Million, 2018-2032)


    • Consumer Electronics


    • Automotive


    • Military and Defense


    • Healthcare


    • Industrial/ Manufacturing


    • Others


    • Germany Outlook (USD Million, 2018-2032)


    • Germany High Density Interconnect PCB, By Interconnection Layers Outlook (USD Million, 2018-2032)


      • Layer (1+N+1) HDI


      • 2 or more layers (2+N+2) HDI


      • All Layers HDI


    • Germany High Density Interconnect PCB, By Application (USD Million, 2018-2032)


      • Consumer Electronics


      • Automotive


      • Military and Defense


      • Healthcare


      • Industrial/ Manufacturing


      • Others


    • France Outlook (USD Million, 2018-2032)


    • France High Density Interconnect PCB, By Interconnection Layers Outlook (USD Million, 2018-2032)


      • Layer (1+N+1) HDI


      • 2 or more layers (2+N+2) HDI


      • All Layers HDI


    • France High Density Interconnect PCB, By Application (USD Million, 2018-2032)


      • Consumer Electronics


      • Automotive


      • Military and Defense


      • Healthcare


      • Industrial/ Manufacturing


      • Others


    • UK Outlook (USD Million, 2018-2032)


    • UK High Density Interconnect PCB, By Interconnection Layers Outlook (USD Million, 2018-2032)


      • Layer (1+N+1) HDI


      • 2 or more layers (2+N+2) HDI


      • All Layers HDI


    • UK High Density Interconnect PCB, By Application (USD Million, 2018-2032)


      • Consumer Electronics


      • Automotive


      • Military and Defense


      • Healthcare


      • Industrial/ Manufacturing


      • Others


    • Rest of Europe Outlook (USD Million, 2018-2032)


    • Rest of Europe High Density Interconnect PCB, By Interconnection Layers Outlook (USD Million, 2018-2032)


      • Layer (1+N+1) HDI


      • 2 or more layers (2+N+2) HDI


      • All Layers HDI


    • Rest of Europe High Density Interconnect PCB, By Application (USD Million, 2018-2032)


      • Consumer Electronics


      • Automotive


      • Military and Defense


      • Healthcare


      • Industrial/ Manufacturing


      • Others


  • Asia-Pacific Outlook (USD Million, 2018-2032)


  • Asia-Pacific High Density Interconnect PCB, By Interconnection Layers Outlook (USD Million, 2018-2032)


    • Layer (1+N+1) HDI


    • 2 or more layers (2+N+2) HDI


    • All Layers HDI


  • Asia-Pacific High Density Interconnect PCB, By Application (USD Million, 2018-2032)


    • Consumer Electronics


    • Automotive


    • Military and Defense


    • Healthcare


    • Industrial/ Manufacturing


    • Others


    • China Outlook (USD Million, 2018-2032)


    • China High Density Interconnect PCB, By Interconnection Layers Outlook (USD Million, 2018-2032)


      • Layer (1+N+1) HDI


      • 2 or more layers (2+N+2) HDI


      • All Layers HDI


    • China High Density Interconnect PCB, By Application (USD Million, 2018-2032)


      • Consumer Electronics


      • Automotive


      • Military and Defense


      • Healthcare


      • Industrial/ Manufacturing


      • Others


    • India Outlook (USD Million, 2018-2032)


    • India High Density Interconnect PCB, By Interconnection Layers Outlook (USD Million, 2018-2032)


      • Layer (1+N+1) HDI


      • 2 or more layers (2+N+2) HDI


      • All Layers HDI


    • India High Density Interconnect PCB, By Application (USD Million, 2018-2032)


      • Consumer Electronics


      • Automotive


      • Military and Defense


      • Healthcare


      • Industrial/ Manufacturing


      • Others


    • Japan Outlook (USD Million, 2018-2032)


    • Japan High Density Interconnect PCB, By Interconnection Layers Outlook (USD Million, 2018-2032)


      • Layer (1+N+1) HDI


      • 2 or more layers (2+N+2) HDI


      • All Layers HDI


    • Japan High Density Interconnect PCB, By Application (USD Million, 2018-2032)


      • Consumer Electronics


      • Automotive


      • Military and Defense


      • Healthcare


      • Industrial/ Manufacturing


      • Others


    • Rest of Asia-Pacific Outlook (USD Million, 2018-2032)


    • Rest of Asia-Pacific High Density Interconnect PCB, By Interconnection Layers Outlook (USD Million, 2018-2032)


      • Layer (1+N+1) HDI


      • 2 or more layers (2+N+2) HDI


      • All Layers HDI


    • Rest of Asia-Pacific High Density Interconnect PCB, By Application (USD Million, 2018-2032)


      • Consumer Electronics


      • Automotive


      • Military and Defense


      • Healthcare


      • Industrial/ Manufacturing


      • Others


  • Rest of the World Outlook (USD Million, 2018-2032)


  • Rest of the World High Density Interconnect PCB, By Interconnection Layers Outlook (USD Million, 2018-2032)


    • Layer (1+N+1) HDI


    • 2 or more layers (2+N+2) HDI


    • All Layers HDI


  • Rest of the World High Density Interconnect PCB, By Application (USD Million, 2018-2032)


    • Consumer Electronics


    • Automotive


    • Military and Defense


    • Healthcare


    • Industrial/ Manufacturing


    • Others


    • Middle East & Africa Outlook (USD Million, 2018-2032)


    • Middle East & Africa High Density Interconnect PCB, By Interconnection Layers Outlook (USD Million, 2018-2032)


      • Layer (1+N+1) HDI


      • 2 or more layers (2+N+2) HDI


      • All Layers HDI


    • Middle East & Africa High Density Interconnect PCB, By Application (USD Million, 2018-2032)


      • Consumer Electronics


      • Automotive


      • Military and Defense


      • Healthcare


      • Industrial/ Manufacturing


      • Others


    • South America Outlook (USD Million, 2018-2032)


    • South America High Density Interconnect PCB, By Interconnection Layers Outlook (USD Million, 2018-2032)


      • Layer (1+N+1) HDI


      • 2 or more layers (2+N+2) HDI


      • All Layers HDI


    • South America High Density Interconnect PCB, By Application (USD Million, 2018-2032)


      • Consumer Electronics


      • Automotive


      • Military and Defense


      • Healthcare


      • Industrial/ Manufacturing


      • Others


Research Methodology on High Density Interconnect PCB Market


This research study uses primary and secondary sources to comprehensively analyze the global High Density Interconnect PCB market. Primary sources include industry experts from core and related industries. Secondary sources include press releases, articles, government publications, trade associations, market research studies and surveys. The research data includes market size, revenue forecasts, regional estimates, competitive intelligence and growth opportunities.


Market Research Future (MRFR) has employed a thorough research methodology to furnish a detailed and profound analysis of the High-Density Interconnect PCB market that serves to guide stakeholders. The following points highlight the interpretation of the research data and the steps behind the arrival of the market size equations.


Research Approach


MRFR's research process involves in-depth secondary research, primary interviews and validation from industry experts. Secondary research sources include press releases, investor presentations, SEC filings, annual reports, various international websites, scholarly articles and databases. Primary research sources include in-depth interviews and surveys with industry experts, global vendors, company owners, and executives.


Data Collection


The research process beings with data collection both from secondary and primary sources. Besides this, MRFR also conducts independent research to garner exact market information. The facts and figures gathered from both sources are compared and validated to curate the data points.


Structure of the Study


The High Density Interconnect PCB market report encompasses a comprehensive outline of the global market with brief analysis, industry insights and knowledgeable information related to the market. The report highlights the dynamic aspects of the market sector such as drivers, restraints, opportunities and challenges that influence the growth and growth potential of the sector. The report is also equipped with market size and forecast, which is estimated to offer a complete picture of the latest market scenarios.


Insights


MRFR provides independent analyses of the global High Density Interconnect PCB market, emphasizing important aspects of the sector such as market trends and regional markets. The report also highlights important facets such as the SWOT analysis, key segments, and product portfolio covering a wide range of aspects. Furthermore, the market share of each company, financial analysis and key trends are analysed, offering a bird's eye view of the industry.


Analysis


The data collected from both primary and secondary sources is analysed to get a detailed understanding of the global High Density Interconnect PCB market. This analysis helps to understand the performance of the market with respect to different market scenarios.


Validation


The data points estimated and analyzed with different tools such as SPSS software, and Minitab, are compared and validated with the actual market scenarios. The estimated data is further improved with the help of industry comments to ensure the accuracy and reliability of the market figures.


Conclusion


The final step of the High Density Interconnect PCB market study involves summarizing the insights gathered from primary and secondary research and industry expert interviews. The report includes all the major elements such as market size, market growth, market trends, and challenges faced by the industry players which helps to formulate strategies for the market players to gain maximum profits within the predicted market timeline (2023 -2030).

Leading companies partner with us for data-driven Insights
client_1 client_2 client_3 client_4 client_5 client_6 client_7 client_8 client_9 client_10
Please fill in Business Email for Quick Response

TABLE OF CONTENTS

1. EXECUTIVE SUMMARY

1.1. Market Attractiveness Analysis

1.1.1. Global High Density Interconnect PCB Market, by Interconnection Layers

1.1.2. Global High Density Interconnect PCB Market, by Application

1.1.3. Global High Density Interconnect PCB Market, by Region

2. MARKET INTRODUCTION

2.1. Definition

2.2. Scope of the Study

2.3. Market Structure

2.4. Key Buying Criteria

2.5. Macro Factor Indicator Analysis

3. RESEARCH METHODOLOGY

3.1. Research Process

3.2. Primary Research

3.3. Secondary Research

3.4. Market Size Estimation

3.5. Forecast Model

3.6. List of Assumptions

4. MARKET DYNAMICS

4.1. Introduction

4.2. Drivers

4.2.1. Increasing benefits of high density interconnect technology

4.2.2. Rising demand of HDI PCBs in complex electronic devices

4.2.3. Growing demand for circuit miniaturization

4.2.4. Drivers Impact Analysis

4.3. Challenges

4.3.1. Introducing HDI technology in PCB for space application

4.3.2. 5G technology related PCB design challenges

4.3.3. Challenges faced in any-layer interconnection high density (ALV HDI) in mass productions

4.3.4. Restraints Impact Analysis

4.4. Opportunities

4.4.1. Technological advancement in HDI PCB

4.4.2. 5G technology as a growth opportunity for PCB designers

4.4.3. Rising demand for consumer electronics

4.5. Impact of COVID-19

4.5.1. Impact On Semiconductor Industry

4.5.2. Impact On the medical electronic Industry

4.5.3. Impact On global PCB supply chain

4.5.4. Rising need for digitalization of the supply chain

5. MARKET FACTOR ANALYSIS

5.1. Value Chain Analysis/Supply Chain Analysis

5.2. Porterโ€™s Five Forces Model

5.3. Bargaining Power of Suppliers

5.4. Bargaining Power of Buyers

5.5. Threat of New Entrants

5.6. Threat of Substitutes

5.7. Intensity of Rivalry

6. GLOBAL HIGH DENSITY INTERCONNECT PCB MARKET, BY INTERCONNECTION LAYERS

6.1. Introduction

6.2. 1 Layer (1+N+1) HDI

6.3. 2 or more layers (2+N+2) HDI

6.4. All Layers HDI

7. GLOBAL HIGH DENSITY INTERCONNECT PCB MARKET, BY APPLICATION

7.1. Introduction

7.2. Consumer Electronics

7.3. Automotive

7.4. Military and Defense

7.5. Healthcare

7.6. Industrial/ Manufacturing

7.7. Others

8. GLOBAL HIGH DENSITY INTERCONNECT PCB MARKET SIZE ESTIMATION & FORECAST, BY REGION

8.1. Introduction

8.2. North America

8.2.1. Market Estimates & Forecast, by Country, 2018-2032

8.2.2. Market Estimates & Forecast, by Interconnection Layers, 2018-2032

8.2.3. Market Estimates & Forecast, by Application, 2018-2032

8.2.4. US

8.2.5. Market Estimates & Forecast, by Interconnection Layers, 2018-2032

8.2.6. Market Estimates & Forecast, by Application, 2018-2032

8.2.7. Canada

8.2.8. Market Estimates & Forecast, by Interconnection Layers, 2018-2032

8.2.9. Market Estimates & Forecast, by Application, 2018-2032

8.2.10. Mexico

8.2.11. Market Estimates & Forecast, by Interconnection Layers, 2018-2032

8.2.12. Market Estimates & Forecast, by Application, 2018-2032

8.3. Europe

8.3.1. Market Estimates & Forecast, by Country, 2018-2032

8.3.2. Market Estimates & Forecast, by Interconnection Layers, 2018-2032

8.3.3. Market Estimates & Forecast, by Application, 2018-2032

8.3.4. UK

8.3.4.1. Market Estimates & Forecast, by Interconnection Layers, 2018-2032

8.3.4.2. Market Estimates & Forecast, by Application, 2018-2032

8.3.5. Germany

8.3.5.1. Market Estimates & Forecast, by Interconnection Layers, 2018-2032

8.3.5.2. Market Estimates & Forecast, by Application, 2018-2032

8.3.6. France

8.3.6.1. Market Estimates & Forecast, by Interconnection Layers, 2018-2032

8.3.6.2. Market Estimates & Forecast, by Application, 2018-2032

8.3.7. Rest of Europe

8.3.7.1. Market Estimates & Forecast, by Interconnection Layers, 2018-2032

8.3.7.2. Market Estimates & Forecast, by Application, 2018-2032

8.4. Asia-Pacific

8.4.1. Market Estimates & Forecast, by Country, 2018-2032

8.4.2. Market Estimates & Forecast, by Interconnection Layers, 2018-2032

8.4.3. Market Estimates & Forecast, by Application, 2018-2032

8.4.4. China

8.4.4.1. Market Estimates & Forecast, by Interconnection Layers, 2018-2032

8.4.4.2. Market Estimates & Forecast, by Application, 2018-2032

8.4.5. Japan

8.4.5.1. Market Estimates & Forecast, by Interconnection Layers, 2018-2032

8.4.5.2. Market Estimates & Forecast, by Application, 2018-2032

8.4.6. India

8.4.6.1. Market Estimates & Forecast, by Interconnection Layers, 2018-2032

8.4.6.2. Market Estimates & Forecast, by Application, 2018-2032

8.4.7. Rest of Asia-Pacific

8.4.7.1. Market Estimates & Forecast, by Interconnection Layers, 2018-2032

8.4.7.2. Market Estimates & Forecast, by Application, 2018-2032

8.5. Middle East & Africa

8.5.1. Market Estimates & Forecast, by Interconnection Layers, 2018-2032

8.5.2. Market Estimates & Forecast, by Application, 2018-2032

8.6. South America

8.6.1. Market Estimates & Forecast, by Interconnection Layers, 2018-2032

8.6.2. Market Estimates & Forecast, by Application, 2018-2032

9. COMPETITIVE LANDSCAPE

9.1. Introduction

9.2. Key Developments & Growth Strategies

9.3. Competitor Benchmarking

9.4. Vendor Share Analysis, 2021(% Share)

10. COMPANY PROFILES

10.1. Unimicron, Epec, LLC

10.1.1. Company Overview

10.1.2. Financial Overview

10.1.3. Solution/Services Offered

10.1.4. Key Developments

10.1.5. SWOT Analysis

10.1.6. Key Strategies

10.2. TTM Technologies Inc.

10.2.1. Company Overview

10.2.2. Financial Overview

10.2.3. Solution/Services Offered

10.2.4. Key Developments

10.2.5. SWOT Analysis

10.2.6. Key Strategies

10.3. RayMing Technology

10.3.1. Company Overview

10.3.2. Financial Overview

10.3.3. Solution/Services Offered

10.3.4. Key Developments

10.3.5. SWOT Analysis

10.3.6. Key Strategies

10.4. HiTech Circuits

10.4.1. Company Overview

10.4.2. Financial Overview

10.4.3. Solution/Services Offered

10.4.4. Key Developments

10.4.5. SWOT Analysis

10.4.6. Key Strategies

10.5. NCAB Group Corporation

10.5.1. Company Overview

10.5.2. Financial Overview

10.5.3. Solution/Services Offered

10.5.4. Key Developments

10.5.5. SWOT Analysis

10.5.6. Key Strategies

10.6. Millennium Circuits Limited

10.6.1. Company Overview

10.6.2. Financial Overview

10.6.3. Solution/Services Offered

10.6.4. Key Developments

10.6.5. SWOT Analysis

10.6.6. Key Strategies

10.7. Tripod Technology

10.7.1. Company Overview

10.7.2. Financial Overview

10.7.3. Solution/Services Offered

10.7.4. Key Developments

10.7.5. SWOT Analysis

10.7.6. Key Strategies

10.8. Zhen Ding Tech. Group Technology Holding Limited

10.8.1. Company Overview

10.8.2. Financial Overview

10.8.3. Solution/Services Offered

10.8.4. Key Developments

10.8.5. SWOT Analysis

10.8.6. Key Strategies

10.9. AKM Meadville

10.9.1. Company Overview

10.9.2. Financial Overview

10.9.3. Solution/Services Offered

10.9.4. Key Developments

10.9.5. SWOT Analysis

10.9.6. Key Strategies

10.10. Meiko Electronics Co., Ltd.

10.10.1. Company Overview

10.10.2. Financial Overview

10.10.3. Solution/Services Offered

10.10.4. Key Developments

10.10.5. SWOT Analysis

10.10.6. Key Strategies

10.11. Sierra Circuits Inc.

10.11.1. Company Overview

10.11.2. Financial Overview

10.11.3. Solution/Services Offered

10.11.4. Key Developments

10.11.5. SWOT Analysis

10.11.6. Key Strategies

10.12. Compeq Manufacturing Co., Ltd.

10.12.1. Company Overview

10.12.2. Financial Overview

10.12.3. Solution/Services Offered

10.12.4. Key Developments

10.12.5. SWOT Analysis

10.12.6. Key Strategies

10.13. AT & S (Austria Technologie & Systemtechnik Aktiengesellschaft)

10.13.1. Company Overview

10.13.2. Financial Overview

10.13.3. Solution/Services Offered

10.13.4. Key Developments

10.13.5. SWOT Analysis

10.13.6. Key Strategies

10.14. Advanced Circuits

10.14.1. Company Overview

10.14.2. Financial Overview

10.14.3. Solution/Services Offered

10.14.4. Key Developments

10.14.5. SWOT Analysis

10.14.6. Key Strategies

10.15. DAP Corporation

10.15.1. Company Overview

10.15.2. Financial Overview

10.15.3. Solution/Services Offered

10.15.4. Key Developments

10.15.5. SWOT Analysis

10.15.6. Key Strategies

NOTE:

This table of content is tentative and subject to change as the research progresses.

๏‚ก In section 12, only the top 10 companies will be profiled. Each company will be profiled based on the Market Overview, Financials, Service Portfolio, Business Strategies, and Recent Developments parameters.

๏‚ก The companies are selected based on two broad criteriaยฌโ€“ strength of Type portfolio and excellence in business strategies.

๏‚ก Key parameters considered for evaluating strength of the vendorโ€™s Type portfolio are industry experience, Type capabilities/features, innovations/R&D investment, flexibility to customize the Type, ability to integrate with other systems, pre- and post-sale services, and customer ratings/feedback.

๏‚ก Key parameters considered for evaluating a vendorโ€™s excellence in business strategy are its market share, global presence, customer base, partner ecosystem (Provider alliances/resellers/distributors), acquisitions, and marketing strategies/investments.

The financial details of the company cannot be provided if the information is not available in the public domain and or from reliable sources. โ€ƒ

LIST OF TABLES

TABLE 1 MARKET SYNOPSIS 17

TABLE 2 GLOBAL HIGH DENSITY INTERCONNECT (HDI) PCB MARKET, BY INTERCONNECTION LAYERS, 2018-2032 (USD MILLION) 41

TABLE 3 GLOBAL HIGH DENSITY INTERCONNECT (HDI) PCB MARKET, BY APPLICATION, 2018-2032 (USD MILLION) 43

TABLE 4 GLOBAL HIGH DENSITY INTERCONNECT (HDI) PCB MARKET, BY REGION, 2018-2032 (USD MILLION) 46

TABLE 5 NORTH AMERICA HIGH DENSITY INTERCONNECT (HDI) PCB MARKET, BY COUNTRY, 2018-2032 (USD MILLION) 48

TABLE 6 NORTH AMERICA HIGH DENSITY INTERCONNECT (HDI) PCB MARKET, BY INTERCONNECTION LAYERS, 2018-2032 (USD MILLION) 49

TABLE 7 NORTH AMERICA HIGH DENSITY INTERCONNECT (HDI) PCB MARKET, BY APPLICATION, 2018-2032 (USD MILLION) 49

TABLE 8 US HIGH DENSITY INTERCONNECT (HDI) PCB MARKET, BY INTERCONNECTION LAYERS, 2018-2032 (USD MILLION) 50

TABLE 9 US HIGH DENSITY INTERCONNECT (HDI) PCB MARKET, BY APPLICATION, 2018-2032 (USD MILLION) 50

TABLE 10 CANADA HIGH DENSITY INTERCONNECT (HDI) PCB MARKET, BY INTERCONNECTION LAYERS, 2018-2032 (USD MILLION) 50

TABLE 11 CANADA HIGH DENSITY INTERCONNECT (HDI) PCB MARKET, BY APPLICATION, 2018-2032 (USD MILLION) 51

TABLE 12 MEXICO HIGH DENSITY INTERCONNECT (HDI) PCB MARKET, BY INTERCONNECTION LAYERS, 2018-2032 (USD MILLION) 51

TABLE 13 MEXICO HIGH DENSITY INTERCONNECT (HDI) PCB MARKET, BY APPLICATION, 2018-2032 (USD MILLION) 51

TABLE 14 EUROPE HIGH DENSITY INTERCONNECT (HDI) PCB MARKET, BY COUNTRY, 2018-2032 (USD MILLION) 55

TABLE 15 EUROPE HIGH DENSITY INTERCONNECT (HDI) PCB MARKET, BY INTERCONNECTION LAYERS, 2018-2032 (USD MILLION) 55

TABLE 16 EUROPE HIGH DENSITY INTERCONNECT (HDI) PCB MARKET, BY APPLICATION, 2018-2032 (USD MILLION) 56

TABLE 17 GERMANY HIGH DENSITY INTERCONNECT (HDI) PCB MARKET, BY INTERCONNECTION LAYERS, 2018-2032 (USD MILLION) 57

TABLE 18 GERMANY HIGH DENSITY INTERCONNECT (HDI) PCB MARKET, BY APPLICATION, 2018-2032 (USD MILLION) 57

TABLE 19 FRANCE HIGH DENSITY INTERCONNECT (HDI) PCB MARKET, BY INTERCONNECTION LAYERS, 2018-2032 (USD MILLION) 57

TABLE 20 FRANCE HIGH DENSITY INTERCONNECT (HDI) PCB MARKET, BY APPLICATION, 2018-2032 (USD MILLION) 58

TABLE 21 UK HIGH DENSITY INTERCONNECT (HDI) PCB MARKET, BY INTERCONNECTION LAYERS, 2018-2032 (USD MILLION) 58

TABLE 22 UK HIGH DENSITY INTERCONNECT (HDI) PCB MARKET, BY APPLICATION, 2018-2032 (USD MILLION) 58

TABLE 23 REST OF EUROPE HIGH DENSITY INTERCONNECT (HDI) PCB MARKET, BY INTERCONNECTION LAYERS, 2018-2032 (USD MILLION) 59

TABLE 24 REST OF EUROPE HIGH DENSITY INTERCONNECT (HDI) PCB MARKET, BY APPLICATION, 2018-2032 (USD MILLION) 59

TABLE 25 ASIA-PACIFIC HIGH DENSITY INTERCONNECT (HDI) PCB MARKET, BY COUNTRY, 2018-2032 (USD MILLION) 61

TABLE 26 ASIA-PACIFIC HIGH DENSITY INTERCONNECT (HDI) PCB MARKET, BY INTERCONNECTION LAYERS, 2018-2032 (USD MILLION) 62

TABLE 27 ASIA-PACIFIC HIGH DENSITY INTERCONNECT (HDI) PCB MARKET, BY APPLICATION, 2018-2032 (USD MILLION) 62

TABLE 28 CHINA HIGH DENSITY INTERCONNECT (HDI) PCB MARKET, BY INTERCONNECTION LAYERS, 2018-2032 (USD MILLION) 63

TABLE 29 CHINA HIGH DENSITY INTERCONNECT (HDI) PCB MARKET, BY APPLICATION, 2018-2032 (USD MILLION) 63

TABLE 30 JAPAN HIGH DENSITY INTERCONNECT (HDI) PCB MARKET, BY INTERCONNECTION LAYERS, 2018-2032 (USD MILLION) 63

TABLE 31 JAPAN HIGH DENSITY INTERCONNECT (HDI) PCB MARKET, BY APPLICATION, 2018-2032 (USD MILLION) 64

TABLE 32 INDIA HIGH DENSITY INTERCONNECT (HDI) PCB MARKET, BY INTERCONNECTION LAYERS, 2018-2032 (USD MILLION) 64

TABLE 33 INDIA HIGH DENSITY INTERCONNECT (HDI) PCB MARKET, BY APPLICATION, 2018-2032 (USD MILLION) 64

TABLE 34 REST OF ASIA-PACIFIC HIGH DENSITY INTERCONNECT (HDI) PCB MARKET, BY INTERCONNECTION LAYERS, 2018-2032 (USD MILLION) 65

TABLE 35 REST OF ASIA-PACIFIC HIGH DENSITY INTERCONNECT (HDI) PCB MARKET, BY APPLICATION, 2018-2032 (USD MILLION) 65

TABLE 36 REST OF THE WORLD HIGH DENSITY INTERCONNECT (HDI) PCB MARKET, BY COUNTRY, 2018-2032 (USD MILLION) 67

TABLE 37 REST OF THE WORLD HIGH DENSITY INTERCONNECT (HDI) PCB MARKET, BY INTERCONNECTION LAYERS, 2018-2032 (USD MILLION) 67

TABLE 38 REST OF THE WORLD HIGH DENSITY INTERCONNECT (HDI) PCB MARKET, BY APPLICATION, 2018-2032 (USD MILLION) 68

TABLE 39 MIDDLE EAST & AFRICA HIGH DENSITY INTERCONNECT (HDI) PCB MARKET, BY INTERCONNECTION LAYERS, 2018-2032 (USD MILLION) 69

TABLE 40 MIDDLE EAST & AFRICA HIGH DENSITY INTERCONNECT (HDI) PCB MARKET, BY APPLICATION, 2018-2032 (USD MILLION) 69

TABLE 41 SOUTH AMERICA HIGH DENSITY INTERCONNECT (HDI) PCB MARKET, BY INTERCONNECTION LAYERS, 2018-2032 (USD MILLION) 69

TABLE 42 SOUTH AMERICA HIGH DENSITY INTERCONNECT (HDI) PCB MARKET, BY APPLICATION, 2018-2032 (USD MILLION) 70

TABLE 43 BUSINESS EXPANSIONS/ACQUISITIONS 73

TABLE 44 UNIMICRON: PRODUCTS/SOLUTIONS/SERVICES OFFERED 77

TABLE 45 EPEC, LLC: PRODUCTS/SOLUTIONS/SERVICES OFFERED 78

TABLE 46 EPEC, LLC: KEY DEVELOPMENTS 78

TABLE 47 TTM TECHNOLOGIES INC.: PRODUCTS/SOLUTIONS/SERVICES OFFERED 81

TABLE 48 RAYMING TECHNOLOGY: PRODUCTS/SOLUTIONS/SERVICES OFFERED 83

TABLE 49 HITECH CIRCUITS: PRODUCTS/SOLUTIONS/SERVICES OFFERED 84

TABLE 50 NCAB GROUP CORPORATION: PRODUCTS/SOLUTIONS/SERVICES OFFERED 86

TABLE 51 NCAB GROUP CORPORATION: KEY DEVELOPMENTS 86

TABLE 52 MILENNIUM CIRCUITS LIMITED: PRODUCTS/SOLUTIONS/SERVICES OFFERED 89

TABLE 53 TRIPOD TECHNOLOGY: PRODUCTS/SOLUTIONS/SERVICES OFFERED 90

TABLE 54 ZHEN DING TECH. GROUP TECHNOLOGY HOLDING LIMITED: PRODUCTS/SOLUTIONS/SERVICES OFFERED 93

TABLE 55 AKM MEADVILLE: PRODUCTS/SOLUTIONS/SERVICES OFFERED 96

TABLE 56 MEIKO ELECTRONICS CO., LTD: PRODUCTS/SOLUTIONS/SERVICES OFFERED 99

TABLE 57 MEIKO ELECTRONICS CO., LTD: KEY DEVELOPMENTS 100

TABLE 58 SIERRA CIRCUITS INC.: PRODUCTS/SOLUTIONS/SERVICES OFFERED 102

TABLE 59 COMPEQ MANUFACTURING CO. LTD.: PRODUCTS/SOLUTIONS/SERVICES OFFERED 104

TABLE 60 AT & S AUSTRIA TECHNOLOGIE & SYSTEMTECHNIK AKTIENGESELLSCHAFT: PRODUCTS/SOLUTIONS/SERVICES OFFERED 106

TABLE 61 ADVANCED CIRCUIT.: PRODUCTS/SOLUTIONS/SERVICES OFFERED 108

TABLE 62 DAP CORPORATION: PRODUCTS/SOLUTIONS/SERVICES OFFERED 109

LIST OF FIGURES

FIGURE 1 MARKET ATTRACTIVENESS ANALYSIS: GLOBAL HIGH DENSITY INTERCONNECT (HDI) PCB MARKET 18

FIGURE 2 GLOBAL HIGH DENSITY INTERCONNECT (HDI) PCB MARKET: MARKET STRUCTURE 20

FIGURE 3 BOTTOM-UP AND TOP-DOWN APPROACHES 25

FIGURE 4 MARKET DYNAMIC ANALYSIS OF THE GLOBAL HIGH DENSITY INTERCONNECT (HDI) PCB MARKET 28

FIGURE 5 DRIVER IMPACT ANALYSIS 30

FIGURE 6 GLOBAL HIGH DENSITY INTERCONNECT (HDI) PCB MARKET: SUPPLY CHAIN ANALYSIS 36

FIGURE 7 PORTER'S FIVE FORCES ANALYSIS OF THE HIGH DENSITY INTERCONNECT (HDI) PCB MARKET 38

FIGURE 8 GLOBAL HIGH DENSITY INTERCONNECT (HDI) PCB MARKET, BY INTERCONNECTION LAYERS, 2022 (% SHARE) 40

FIGURE 9 GLOBAL HIGH DENSITY INTERCONNECT (HDI) PCB MARKET, BY INTERCONNECTION LAYERS, 2022 VS 2032 (USD MILLION) 40

FIGURE 10 GLOBAL HIGH DENSITY INTERCONNECT (HDI) PCB MARKET, BY APPLICATION, 2022 (% SHARE) 42

FIGURE 11 GLOBAL HIGH DENSITY INTERCONNECT (HDI) PCB MARKET, BY APPLICATION, 2022 VS 2032 (USD MILLION) 42

FIGURE 12 GLOBAL HIGH DENSITY INTERCONNECT (HDI) PCB MARKET, BY REGION, 2022 (% SHARE) 45

FIGURE 13 GLOBAL HIGH DENSITY INTERCONNECT (HDI) PCB MARKET, BY REGION, 2022 VS 2032 (USD MILLION) 45

FIGURE 14 NORTH AMERICA HIGH DENSITY INTERCONNECT (HDI) PCB MARKET, BY COUNTRY, 2022 (% SHARE) 47

FIGURE 15 NORTH AMERICA HIGH DENSITY INTERCONNECT (HDI) PCB MARKET, BY COUNTRY, 2022 VS 2032 (USD MILLION) 48

FIGURE 16 NORTH AMERICA HIGH DENSITY INTERCONNECT (HDI) PCB MARKET, BY INTERCONNECTION LAYERS, 2018-2032 (USD MILLION) 48

FIGURE 17 NORTH AMERICA HIGH DENSITY INTERCONNECT (HDI) PCB MARKET, BY APPLICATION, 2018-2032 (USD MILLION) 49

FIGURE 18 EUROPE HIGH DENSITY INTERCONNECT (HDI) PCB MARKET, BY COUNTRY, 2022 (% SHARE) 53

FIGURE 19 EUROPE HIGH DENSITY INTERCONNECT (HDI) PCB MARKET, BY COUNTRY, 2022 VS 2032 (USD MILLION) 53

FIGURE 20 EUROPE HIGH DENSITY INTERCONNECT (HDI) PCB MARKET, BY INTERCONNECTION LAYERS, 2018-2032 (USD MILLION) 55

FIGURE 21 EUROPE HIGH DENSITY INTERCONNECT (HDI) PCB MARKET, BY APPLICATION, 2018-2032 (USD MILLION) 56

FIGURE 22 ASIA-PACIFIC HIGH DENSITY INTERCONNECT (HDI) PCB MARKET, BY COUNTRY, 2022 (% SHARE) 60

FIGURE 23 ASIA-PACIFIC HIGH DENSITY INTERCONNECT (HDI) PCB MARKET, BY COUNTRY, 2022 VS 2032 (USD MILLION) 61

FIGURE 24 ASIA-PACIFIC HIGH DENSITY INTERCONNECT (HDI) PCB MARKET, BY INTERCONNECTION LAYERS, 2018-2032 (USD MILLION) 61

FIGURE 25 ASIA-PACIFIC HIGH DENSITY INTERCONNECT (HDI) PCB MARKET, BY APPLICATION, 2018-2032 (USD MILLION) 62

FIGURE 26 REST OF THE WORLD HIGH DENSITY INTERCONNECT (HDI) PCB MARKET, BY COUNTRY, 2022 (% SHARE) 66

FIGURE 27 REST OF THE WORLD HIGH DENSITY INTERCONNECT (HDI) PCB MARKET, BY COUNTRY, 2022 VS 2032 (USD MILLION) 66

FIGURE 28 REST OF THE WORLD HIGH DENSITY INTERCONNECT (HDI) PCB MARKET, BY INTERCONNECTION LAYERS, 2018-2032 (USD MILLION) 67

FIGURE 29 REST OF THE WORLD HIGH DENSITY INTERCONNECT (HDI) PCB MARKET, BY APPLICATION, 2018-2032 (USD MILLION) 68

FIGURE 30 GLOBAL HIGH DENSITY INTERCONNECT (HDI) PCB MARKET: COMPETITIVE BENCHMARKING 72

FIGURE 31 VENDOR SHARE ANALYSIS, 2021 (%) 73

FIGURE 32 UNIMICRON: FINANCIAL OVERVIEW SNAPSHOT 76

FIGURE 33 UNIMICRON: SWOT ANALYSIS 77

FIGURE 34 EPEC, LLC: SWOT ANALYSIS 79

FIGURE 35 TTM TECHNOLOGIES INC.: FINANCIAL OVERVIEW SNAPSHOT 81

FIGURE 36 TTM TECHNOLOGIES INC.: SWOT ANALYSIS 82

FIGURE 37 NCAB GROUP CORPORATION: FINANCIAL OVERVIEW SNAPSHOT 85

FIGURE 38 NCAB GROUP CORPORATION: SWOT ANALYSIS 88

FIGURE 39 TRIPOD TECHNOLOGY: FINANCIAL OVERVIEW SNAPSHOT 90

FIGURE 40 TRIPOD TECHNOLOGY: SWOT ANALYSIS 91

FIGURE 41 ZHEN DING TECH. GROUP TECHNOLOGY HOLDING LIMITED: FINANCIAL OVERVIEW SNAPSHOT 92

FIGURE 42 ZHEN DING TECH. GROUP TECHNOLOGY HOLDING LIMITED: SWOT ANALYSIS 93

FIGURE 43 AKM MEADVILLE (AKM INDUSTRIAL COMPANY LIMITED): FINANCIAL OVERVIEW SNAPSHOT 95

FIGURE 44 AKM MEADVILLE: SWOT ANALYSIS 97

FIGURE 45 MEIKO ELECTRONICS CO., LTD.: FINANCIAL OVERVIEW SNAPSHOT 99

FIGURE 46 MEIKO ELECTRONICS CO., LTD: SWOT ANALYSIS 100

FIGURE 47 COMPEQ MANUFACTURING CO., LTD: FINANCIAL OVERVIEW SNAPSHOT 103

FIGURE 48 COMPEQ MANUFACTURING CO. LTD.: SWOT ANALYSIS 104

FIGURE 49 AT & S (AUSTRIA TECHNOLOGIE & SYSTEMTECHNIK AKTIENGESELLSCHAFT): FINANCIAL OVERVIEW SNAPSHOT 105

FIGURE 50 AT & S (AUSTRIA TECHNOLOGIE & SYSTEMTECHNIK AKTIENGESELLSCHAFT): SWOT ANALYSIS 107

Purchase Option
Single User $ 4,950
Multiuser License $ 5,950
Enterprise User $ 7,250
Compare Licenses
Tailored for You
  • Dedicated Research on any specifics segment or region.
  • Focused Research on specific players in the market.
  • Custom Report based only on your requirements.
  • Flexibility to add or subtract any chapter in the study.
  • Historic data from 2014 and forecasts outlook till 2040.
  • Flexibility of providing data/insights in formats (PDF, PPT, Excel).
  • Provide cross segmentation in applicable scenario/markets.