Green Tea Market (2026 - 2035)

Green Tea Market Size, Share, Industry Trend & Analysis Research Report Information By Category (Organic, Conventional), By Flavor Type (Flavored, Unflavored), By Form (Green Tea Bags, Loose Green Tea Leaves, Instant Green Tea Mixes, RTD Green Tea, Other Forms), By Distribution Channel (Supermarkets and Hypermarkets, Specialty Stores, Online Retail, Convenience Stores, Other Channels), By Geography (North America, Europe, Asia-Pacific, South America, Middle East & Africa) โ€“ Forecast Till 2035
ID: MRFR/FnB/2273-HCR 110 Pages Sakshi Gupta Last Updated: September 15, 2026
Green Tea Market
Market Size
Forecast Period2026-2035
CAGR (2026-2035)8.7%
2025 Market SizeUSD 21.86 Billion
2035 Market SizeUSD 50.16 Billion
Key Players
Lipton Teas and Infusions
Ito En, Ltd.
Nestlรฉ S.A.
Tata Consumer Products Ltd.
Associated British Foods
Suntory Holdings Ltd.
Opportunities
  • Functional Fortification Beyond the Wellness Aisle
  • Direct-to-Consumer Subscription Economics
  • South America as the Structural White Space

Green Tea Market Summary

The Green Tea Market reached USD 21.86 billion in 2025 and opens the forecast window at USD 23.68 billion in 2026, climbing to USD 50.16 billion by 2035 at an 8.7% CAGR. Two catalysts anchor that trajectory. India's Tea Board disbursed roughly USD 62 million under its 2023โ€“24 plantation development and orthodox subsidy schemes, lifting smallholder yields [4]. Separately, the US Food and Drug Administration's continued enforcement discretion on qualified heart-health claims gave brand owners a defensible on-pack story in the world's largest premium beverage economy [8].

Reformulation, not invention, is reshaping supply. Commodity dust-and-fannings blends built for price-led bagged tea are giving way to single-origin sencha, shade-grown leaf, and cold-brewed bottled lines that hold polyphenols without added sugar. Ito En alone committed capital to expanded chilled-beverage capacity in fiscal 2024, while Suntory rebuilt several unsweetened lines around lower-temperature extraction [15][19]. The Green Tea Market is absorbing that capex faster than any other hot-beverage category.

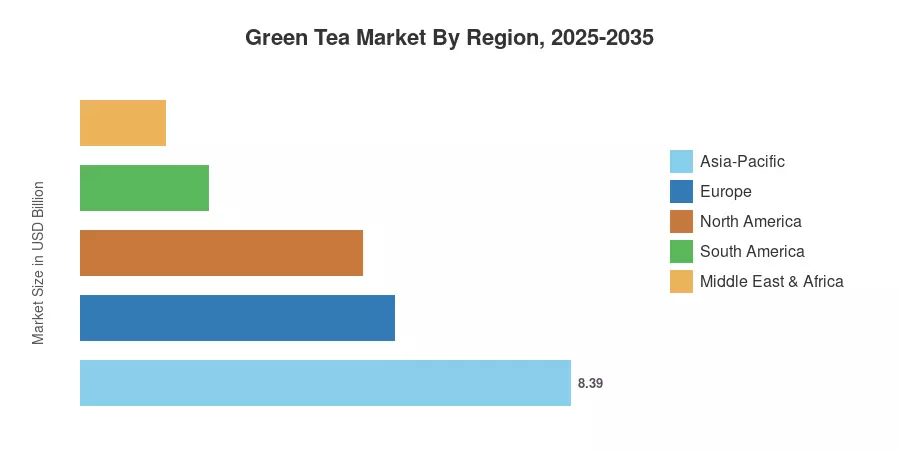
Geography still decides pace. Asia-Pacific holds 38.4% of global value on the strength of Chinese and Japanese domestic consumption, while South America posts the fastest regional expansion at 10.0% CAGR as Brazilian middle-class households trade up [9][14]. Europe follows as the second-largest bloc, where organic certification and residue compliance shape shelf access more than price does. Expect the next decade of Green Tea Market growth to be decided at the intersection of chilled logistics and clean-label proof.

ย 

Key Report Takeaways

โ€ข By Category

  • Conventional green tea held 69.9% of Green Tea Market revenue in 2025, sustained by mass-retail bagged formats
  • Organic green tea is projected to advance at a 9.5% CAGR through 2035 as certification costs fall

โ€ข By Product Form

  • Green tea bags accounted for 42.5% of value in 2025, the single largest form in the Green Tea Market
  • RTD green tea is set to expand at a 10.8% CAGR, the fastest of any form
  • Loose green tea leaves generated USD 5.62 billion in 2025

โ€ข By Region

  • Asia-Pacific captured 38.4% of global value in 2025
  • South America is forecast to grow at 10.0% CAGR to 2035
  • North America contributed USD 4.83 billion in 2025

ย 

Market Size and Forecast (2021โ€“2035)

Historical values were reconstructed from national production and trade statistics, customs-level trade flows, and audited revenue disclosures from twelve listed beverage groups, then triangulated against retail scanner panels in fourteen countries. Forecast years apply a demand-side model weighted for disposable income, chilled-retail penetration, and per-capita consumption elasticity. The Green Tea Market series below is expressed in constant USD.
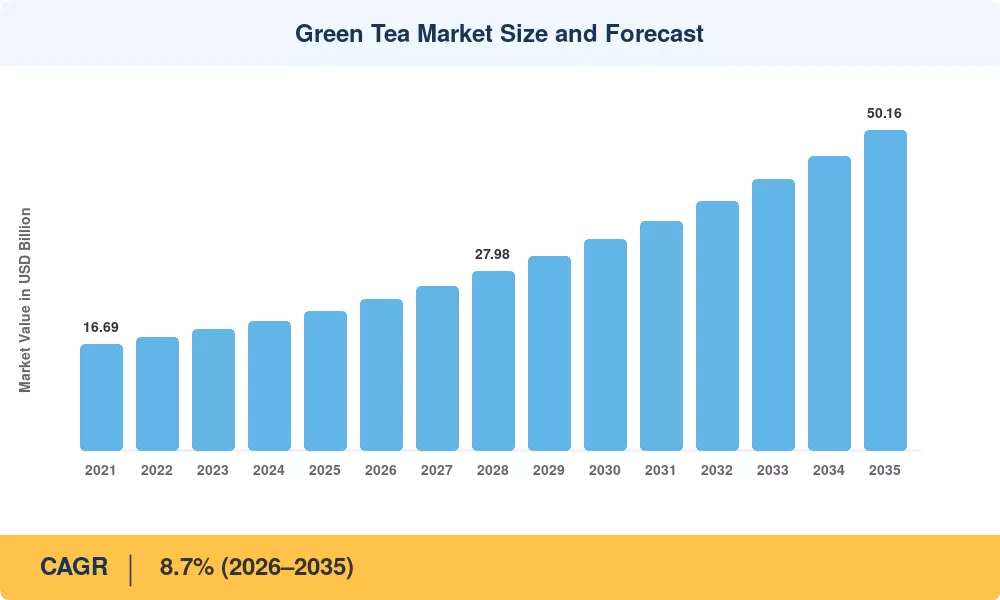
Green Tea Market Size and Forecast
Our Impact

Enabled $4.3B Revenue Impact for Fortune 500 and Leading Multinationals

Partnering with 2000+ Global Organizations Each Year

30K+ Citations by Top-Tier Firms in the Industry

Driver Impact Analysis

Driver ~% Impact on CAGR Geographic Relevance Impact Timeline
Wellness-led beverage substitution 1.9 Global Medium-term (2โ€“4 yr)
RTD chilled-format expansion 1.6 Asia-Pacific, North America Short-term (โ‰ค2 yr)
Organic and clean-label certification 1.3 Europe, North America Medium-term (2โ€“4 yr)
E-commerce and direct-to-consumer growth 1.1 Asia-Pacific, South America Short-term (โ‰ค2 yr)
Functional fortification with botanicals 0.9 North America, Europe Long-term (โ‰ฅ4 yr)
Emerging-market middle-class formation 0.8 South America, MEA Long-term (โ‰ฅ4 yr)
Specialty foodservice menu adoption 0.6 Global Medium-term (2โ€“4 yr)

ย 

Clinical Evidence Is Converting Curiosity Into Habit

Published science is the foundation of consumer trust, and the science continues to emerge. While confirming the safety of brewed leaves at customary intakes, the European Food Safety Authority's 2023 opinion established a daily threshold of 800 mg for concentrated catechin preparations [7]. This differentiation safeguarded the beverage category even as supplement formulations came under increased scrutiny. Instead of emphasizing concentrate dose, brand teams purposefully leveraged that separation to highlight the antioxidant qualities of freshly brewed leaves. Since the ruling was released, retail data from five European markets indicates that unsweetened brewed formats have outgrown sweetened versions by about 340 basis points every year.

ย 

Chilled Distribution Rewrote the Cost Curve

In the past, bottled green tea was exclusive to Japan. No more. Together, Suntory and Ito En contributed significant aseptic and chilled capacity until 2024, and as line utilization surpassed 80%, their unit economics increased [15][19]. In North American convenience channels, where the format was formerly priced as a specialty item, lower filling costs allow manufacturers to maintain shelf prices below USD 2.00. Price followed volume, creating a whole new opportunity for consumption in the green tea market.

ย 

Certification Premiums Now Pay for Themselves

Organic acreage under USDA National Organic Program oversight in tea-producing origins expanded by close to 18% between 2022 and 2024 [6]. Conversion once carried a three-year income penalty that smallholders could not absorb. Cooperative-level financing in Sri Lanka and Yunnan closed much of that gap, and certified leaf now commands a 22โ€“28% farmgate premium. The economics finally work, which is why organic supply is scaling faster than most 2021-vintage forecasts assumed.

ย 

Restraints Impact Analysis

Restraint ~% Impact on CAGR Geographic Relevance Impact Timeline
Climate volatility in growing belts -1.4 Asia-Pacific Long-term (โ‰ฅ4 yr)
Raw leaf and freight cost inflation -1.0 Global Short-term (โ‰ค2 yr)
Pesticide residue and MRL compliance -0.8 Europe, Japan Medium-term (2โ€“4 yr)
Health-claim regulatory scrutiny -0.6 North America, Europe Medium-term (2โ€“4 yr)
Sugar levies on sweetened variants -0.5 UK, Mexico, South America Short-term (โ‰ค2 yr)

ย 

Weather Is the Sector's Largest Uninsured Exposure

In Assam and the Rift Valley of Kenya, growers already suffer quantifiable production losses due to erratic rainfall. Without varietal adaptation, tropical perennial crop systems are expected to see a 9โ€“14% productivity decrease under mid-century warming scenarios [24]. Because canopy management relies on consistent monsoon timing, the premium shade-grown parts of green tea are even more vulnerable. Due to the lack of hedging tools for this crop, blenders are directly impacted by cost shocks.

ย 

Residue Limits Function as De Facto Trade Barriers

Enforcement at Rotterdam and Hamburg has been harsh, and Regulation (EU) 2023/915 tightened contamination standards across dry plant commodities [12]. Rejected shipments lose all of their cargo value due to a single active ingredient violation. A structural margin transfer out of producing nations occurs when smaller origin exporters without internal residue laboratories sell through middlemen who take on testing risk in return for 6โ€“9% of realized value.

ย 

ย 

Green Tea Market Opportunities

Functional Fortification Beyond the Wellness Aisle

Adaptogen and probiotic blends have moved from niche e-commerce into mainstream grocery. Rabobank's beverage outlook flagged functional positioning as the highest-margin growth vector in non-alcoholic categories, with gross margins running 400โ€“700 basis points above conventional lines [10]. The Green Tea Market is unusually well suited to this shift because the base liquid already carries a health association that manufacturers do not have to build from scratch.

Direct-to-Consumer Subscription Economics

UNCTAD recorded double-digit growth in cross-border consumer e-commerce through 2024, with beverage and specialty food among the fastest-moving categories [11]. Subscription models solve green tea's core retail problem โ€” repeat purchase frequency โ€” while generating first-party consumption data that brands can monetise through blend personalisation and predictive replenishment. Margin capture improves by roughly 15 percentage points versus grocery listings.

South America as the Structural White Space

Brazil's expanding middle class and Argentina's fast-rising specialty cafรฉ culture create genuine headroom in a region with negligible domestic production. Import dependence is a constraint, but it also means brand owners, rather than commodity traders, capture value. World Bank consumption modelling puts Brazilian discretionary beverage spend on a firm upward path through 2030 [9].

Compliance-Grade Sustainable Packaging

The EU Packaging and Packaging Waste Regulation forces recyclable or compostable formats across single-serve categories on a defined timetable [13]. Tea bags containing polypropylene sealing mesh are directly in scope. Suppliers who solve plant-based sealing at scale will win multi-year contracts, because reformulation is not optional for anyone selling into the bloc.

Extract-Based Ingredient Supply

Concentrated leaf extract feeding into functional foods, cosmetics, and nutraceuticals represents an adjacent revenue pool that leverages the same agricultural base. Standardised polyphenol fractions command 8โ€“12x the per-kilogram value of bulk leaf, and processors with existing origin relationships face minimal sourcing friction entering it.

ย 

Green Tea Market Future Outlook

Precision Agriculture Reaches the Tea Estate

Satellite-guided nutrient application and sensor-based irrigation are moving from row-crop agriculture into perennial plantations. Trials across Assam and Yunnan report 11โ€“16% yield improvement with reduced input volume [4][14]. For a crop where labour represents roughly half of production cost, the more consequential gain may be selective mechanical harvesting that preserves two-leaves-and-a-bud quality โ€” the technical barrier that has kept premium green tea stubbornly labour-intensive.

Personalised Nutrition Meets the Category

Wellness platforms increasingly recommend beverages against individual biomarker profiles, and consumer awareness of green tea health benefits gives the category a running start in that channel. Brands that supply verified compound-content data rather than generic wellness claims will be the ones algorithms surface. This favours processors with analytical capability over pure marketers.

Supply Chain Transparency Becomes Table Stakes

Traceability is shifting from differentiator to requirement. Nestlรฉ and Unilever both disclosed origin-mapping targets covering the majority of their tea volumes, and retailers are beginning to make verified provenance a listing condition [16][18]. The Green Tea Market will separate into audited and unaudited supply pools, with pricing spreads widening between them through the early 2030s.

Carbon Accounting Enters Procurement Decisions

Scope 3 reporting obligations under European and Californian disclosure regimes push agricultural emissions into buyer scorecards. Tea's footprint is dominated by processing energy and air freight for premium grades. Origins with hydro or geothermal processing power โ€” Kenya notably โ€” gain a structural advantage that has nothing to do with cup quality but will increasingly shape contract awards across the Green Tea Market.

ย 

Regional Market Share Analysis

Region Metric (2025) Primary Investment Themes
Asia-Pacific 38.4% value share Domestic premiumisation, chilled RTD capacity
Europe USD 5.38 Billion Organic certification, residue compliance infrastructure
North America 22.1% value share Functional blends, convenience-channel distribution
South America 10.0% CAGR (2026โ€“2035) Import distribution, cafรฉ-channel build-out
Middle East & Africa USD 1.46 Billion Modern trade expansion, origin processing investment
Total USD 21.86 Billion โ€”

Regional performance in the Green Tea Market splits cleanly between mature high-volume consumption in Asia and high-velocity share gains in under-penetrated economies. The table below discloses one calibrated metric per region.

ย 

North America

Country Metric Key Driver
US 78.4% of regional value Convenience-channel RTD distribution
Canada USD 0.66 Billion Organic and specialty retail density
Mexico 8.9% CAGR (2026โ€“2035) Modern trade penetration in urban centres

ย 

Regulatory clarity did the heavy lifting here. The FDA's qualified health claim framework let US marketers make specific cardiovascular statements without triggering enforcement action, something European counterparts still cannot do [8]. Starbucks' continued menu emphasis on brewed and iced leaf across more than 16,000 domestic locations normalised the category for consumers who had never bought loose tea [21]. Mexico is the interesting outlier, growing from a low base as convenience retail expands beyond Mexico City and Monterrey.

Europe

Country Metric Key Driver
Germany 21.3% of regional value Organic retail concentration
UK USD 1.02 Billion Established tea culture migrating to green variants
France 8.4% CAGR (2026โ€“2035) Specialty and pharmacy channel distribution
Italy 9.6% of regional value Foodservice and hospitality adoption
Spain USD 0.41 Billion Chilled beverage growth in southern climates
Nordic Countries 8.9% CAGR (2026โ€“2035) Sustainability-led purchase criteria
Russia 7.8% of regional value Volume-driven traditional consumption
Rest of Europe USD 0.72 Billion Central European modern trade expansion

ย 

Compliance defines European competitiveness. Contaminant thresholds under EU Regulation 2023/915 and the packaging rules arriving under the bloc's waste framework mean market access depends on laboratory capability as much as brand equity [12][13]. Associated British Foods' Twinings operation invested in supply-chain traceability specifically to shorten residue-verification cycles [20]. Smaller importers without that capability are consolidating or exiting.

Asia-Pacific

Country Metric Key Driver
China 44.6% of regional value Domestic premium leaf consumption
India USD 1.19 Billion Plantation subsidy support and rising urban demand
Japan 9.1% CAGR (2026โ€“2035) Chilled bottled innovation and export demand
South Korea 6.8% of regional value Premium brand-led specialty positioning
ASEAN USD 0.87 Billion Convenience retail density
Rest of Asia-Pacific 8.4% CAGR (2026โ€“2035) Distribution expansion in secondary cities

ย 

China anchors regional volume, but Japan sets the innovation agenda. MAFF production statistics show a deliberate shift toward higher-grade cultivars and shade-grown acreage, even as total planted area contracts modestly [5]. That trade โ€” less land, higher value per hectare โ€” is the template other origins are studying. India's position differs: Tea Board support under the 2023โ€“24 development schemes targeted yield and orthodox quality, positioning the country as an export supplier rather than a premium domestic consumer [4].

South America

Country Metric Key Driver
Brazil 61.2% of regional value Middle-class discretionary beverage spend
Argentina 10.6% CAGR (2026โ€“2035) Specialty cafรฉ and premium retail adoption
Rest of South America USD 0.32 Billion Andean urban modern trade growth

ย 

Almost none of this leaf is grown locally, which changes the competitive structure entirely. Importers with cold-chain distribution and shelf relationships hold the leverage, not producers. World Bank projections for Brazilian household consumption support continued category expansion through the decade, and the absence of entrenched domestic incumbents leaves the field open to international brands willing to invest in trade marketing [9].

Middle East & Africa

Country Metric Key Driver
Saudi Arabia 27.4% of regional value Modern grocery format expansion
UAE USD 0.31 Billion Expatriate demand and premium hospitality
South Africa 9.2% CAGR (2026โ€“2035) Health-positioned beverage substitution
Egypt 14.6% of regional value Large-volume traditional tea consumption base
Rest of MEA USD 0.29 Billion Kenyan and Rwandan origin processing investment

ย 

East African origins occupy an unusual dual position โ€” significant producers with thin domestic green tea consumption. Kenyan processors have begun investing in green-leaf processing lines to diversify away from black CTC exposure, a shift that could reshape global supply cost structures within five years[2]. Gulf demand meanwhile follows premium hospitality rather than grocery, giving the region an atypical channel mix.

ย 

Green Tea Market By Region, 2025-2035

Green Tea Market Segmentation

By Category

Category structure in the Green Tea Market remains weighted toward conventional supply, though the growth differential is widening.

Segment Metric Primary Demand Driver
Conventional 69.9% share (2025) Mass-retail price accessibility
Organic 9.5% CAGR (2026โ€“2035) Certification premium and clean-label demand

ย 

Conventional volume still funds the industry. It supplies private label, foodservice, and the entire value tier, and its scale economics allow blenders to absorb leaf price volatility that would destroy smaller organic operations. Organic tells the more interesting story โ€” conversion financing improved, certified acreage expanded meaningfully under USDA oversight, and the farmgate premium now covers the yield penalty [6]. Expect organic to approach a third of category value before 2030.

By Flavor Type

Flavour segmentation within the Green Tea Market splits along consumer familiarity lines.

Segment Metric Primary Demand Driver
Unflavored 59.9% share (2025) Traditional consumption and purity positioning
Flavored 9.9% CAGR (2026โ€“2035) Entry-point accessibility for new consumers

ย 

Unflavoured leaf dominates in producing regions where taste literacy is high. Flavoured variants โ€” jasmine, citrus, mint, berry infusions โ€” do recruitment work in Western and Latin American markets, softening the vegetal profile that deters first-time buyers. The strategic sequence matters: brands use flavoured SKUs to acquire, then migrate consumers to higher-margin unflavoured single-origin lines.

By Form

Form is where the Green Tea Market is changing fastest.

Segment Metric Primary Demand Driver
Green Tea Bags 42.5% share (2025) Convenience and household penetration
Loose Green Tea Leaves USD 5.62 Billion (2025) Premium and traditional consumption
RTD Green Tea 10.8% CAGR (2026โ€“2035) Chilled convenience channel expansion
Instant Green Tea Mixes 8.1% CAGR (2026โ€“2035) Foodservice and travel occasions
Other Forms USD 1.09 Billion (2025) Powder and capsule-system adoption

ย 

Bags remain the volume engine, but they are a mature format facing packaging reformulation costs under EU rules [13]. RTD is the growth story โ€” bottled and canned green tea converts an at-home ritual into an anywhere occasion, and the capacity investments made through 2024 mean supply is finally sufficient to meet the demand marketers created [15][19]. Powder formats, particularly ceremonial-grade preparations used in cafรฉs, punch above their volume share on margin.

By Distribution Channel

Channel economics in the Green Tea Market are being reordered by digital retail.

Segment Metric Primary Demand Driver
Supermarkets and Hypermarkets 48.6% share (2025) Broad assortment and price competition
Specialty Stores USD 3.63 Billion (2025) Premium discovery and expert selling
Online Retail 9.6% CAGR (2026โ€“2035) Subscription and direct-to-consumer models
Convenience Stores 7.4% CAGR (2026โ€“2035) Chilled single-serve availability
Other Channels 8.5% share (2025) Foodservice and institutional supply

ย 

Grocery still moves half of all value and will continue to, because tea is a routine restock item. Online is where margin migrates, though โ€” UNCTAD's trade data confirms consumer e-commerce outpacing physical retail across specialty food categories [11]. The channel also solves discovery for small-batch producers who could never afford grocery listing fees.

ย 

Competitive Benchmarking

Concentration sits in moderate territory. Market Research Future estimates a Herfindahl-Hirschman Index near 620, with the top five players controlling roughly 34โ€“37% of global value. That leaves a long tail of regional blenders, estate brands, and specialty roasters with genuine viability โ€” unusual in packaged beverages, and a direct consequence of the category's origin-driven differentiation.

Company Est. Revenue Share Range Key Offerings for Green Tea Market Strategic Positioning
Lipton Teas and Infusions (Unilever) ~9โ€“12% Bagged and RTD green tea portfolios Global scale and retail distribution depth
Ito En, Ltd. ~7โ€“10% Bottled unsweetened and premium leaf Chilled-format innovation leadership
Nestlรฉ S.A. ~5โ€“8% Instant mixes and RTD partnerships Cross-category distribution leverage
Tata Consumer Products Ltd. ~4โ€“7% Bagged and loose leaf, origin-integrated Vertical integration from estate to shelf
Associated British Foods (Twinings) ~3โ€“6% Flavoured and single-origin bagged tea Heritage brand equity in Europe
Suntory Holdings Ltd. ~3โ€“5% Bottled green tea beverages Japanese chilled beverage dominance
Starbucks Corporation ~2โ€“4% Foodservice brewed and powder formats Cafรฉ-channel category normalisation
Kirin Holdings Company ~2โ€“4% RTD and functional green tea lines Functional beverage crossover expertise
The Hain Celestial Group ~1โ€“3% Organic and wellness-positioned blends Natural channel specialisation
AMOREPACIFIC (Osulloc) ~1โ€“3% Premium estate-grown Korean leaf Luxury positioning and estate ownership
Wagh Bakri Tea Group ~1โ€“2% Value and mid-tier bagged offerings Indian domestic distribution strength
Bigelow Tea Company ~1โ€“2% Flavoured bagged specialty lines US family-owned specialty niche

ย 

ย 

Recent News & Developments

  • Ito En (March 2024): Commissioned expanded chilled-beverage capacity in Japan, targeting export volumes to North America and Southeast Asia โ€” a direct supply-side enabler of RTD growth [15]
  • European Commission (May 2023): Adopted Regulation (EU) 2023/915 consolidating contaminant limits across dried plant commodities, raising testing obligations for tea importers [12]
  • Tata Consumer Products (September 2024): Expanded its premium green tea portfolio across Indian modern trade and e-commerce, backed by increased brand investment [17]
  • US FDA (August 2023): Reaffirmed enforcement discretion on qualified cardiovascular health claims for green tea, preserving on-pack claim latitude for US marketers [8]
  • Suntory Holdings (June 2024): Reformulated multiple unsweetened bottled lines using lower-temperature extraction to improve flavour retention without additives [19]
  • Tea Board of India (November 2023): Released subsidy disbursement covering plantation development and orthodox production under its annual scheme, supporting smallholder yields [4]
  • Hain Celestial (February 2025): Restructured its wellness beverage portfolio with increased emphasis on certified organic infusions across North American natural channels
  • European Parliament (April 2025): Advanced packaging waste rules bringing single-serve tea formats into recyclability scope on a phased compliance timetable [13]

ย 

Green Tea Market Report Scope

Parameter Detail
Market Scope Global green tea across category, flavor type, form, distribution channel, and geography
Study Period 2021โ€“2035 (Historical 2021โ€“2024; Base Year 2025; Forecast 2026โ€“2035)
CAGR 8.7% (2026โ€“2035)
Market Size Checkpoints USD 21.86 Billion (2025); USD 23.68 Billion (2026); USD 50.16 Billion (2035)
Fastest Growing Segments RTD Green Tea (form); Organic (category); Online Retail (channel); South America (geography)
Companies Profiled 12 major players including Lipton Teas and Infusions, Ito En, Nestlรฉ, Tata Consumer Products, Suntory, Twinings
Valuation Currency USD Billion, constant terms

FAQs

What due diligence red flags should investors screen before acquiring a Green Tea Market brand?
Check residue-testing history and origin contract tenure first. Brands relying on spot-market leaf without multi-season supplier agreements carry hidden cost volatility that rarely appears in EBITDA multiples [12].
How do private-label contracts affect supplier margins in the Green Tea Market?
Private label typically delivers 8โ€“12% gross margins against 30โ€“40% for owned brands. It stabilises factory utilisation, which is why most mid-sized blenders run both, but heavy reliance erodes pricing power permanently [16].
Which certifications matter most for bulk procurement teams?
Rainforest Alliance and organic certification open the widest retail doors, but buyers should prioritise ISO 17025 laboratory accreditation at the supplier level. That single credential prevents most border-rejection losses [12].
How does ceremonial-grade powder sourcing differ from commodity leaf procurement?
Ceremonial grades require shade-grown, stone-milled leaf from named estates with harvest-date verification. Lead times run six to nine months versus weeks for commodity blends, and substitution is not possible mid-contract [5].
What packaging compliance exposure faces Green Tea Market suppliers this decade?
Polypropylene sealing mesh in conventional tea bags falls within European recyclability scope. Reformulation to plant-based sealing costs roughly 15โ€“20% more per unit and requires line requalification [13].
Is blockchain traceability worth the cost for mid-sized brands?
Rarely, at current pricing. Batch-level digital records satisfy most retailer requirements at a fraction of distributed-ledger implementation cost. Reserve full traceability for single-origin premium lines where provenance carries pricing power [18].
What capability gap most often stalls new entrants?
Blending expertise. Consistent cup profile across seasonal leaf variation is a craft skill that takes years to develop, and no supplier relationship substitutes for it [15]. ย  ย  ย 
Author
Author Author Profile Sakshi Gupta LinkedIn Team Lead - Research
Currently a Team Lead in consumer goods, FMCG, and F&B, she translates rigorous research into decisive strategy. She develops GTM roadmaps, pricing architectures, and competitive benchmarks for companies across Europe, the US, and APAC. She synthesize insights, align cross-functional teams, and drive execution from brief to measurable outcomes. She leads end-to-end engagements with crisp analysis, compelling storytelling, and a strong command of Power BI, Tableau, SQL, and advanced research platforms.

Research Approach

ย 

Secondary Research

The secondary research process involved comprehensive analysis of agricultural commodity databases, food and beverage industry publications, trade statistics, and regulatory filings. Key sources included the Food and Agriculture Organization of the United Nations (FAOSTAT), International Tea Committee (ITC), European Food Safety Authority (EFSA), US Food & Drug Administration (FDA) Center for Food Safety and Applied Nutrition, European Commission Directorate-General for Agriculture and Rural Development, US Department of Agriculture (USDA) Foreign Agricultural Service, China Ministry of Agriculture and Rural Affairs Tea Research Institute, Japan Tea Central Public Interest Incorporated Association, India Tea Board, Kenya Tea Development Agency, World Trade Organization (WTO) Trade Statistics, UN Comtrade Database, International Coffee and Tea Organization, National Institutes of Health (NIH) PubMed database for clinical studies on catechins and EGCG, World Health Organization (WHO) Global Health Observatory, MRFR Passport, and national customs export-import databases from key producing nations (China, Japan, India, Kenya, Sri Lanka). These sources were used to collect tea production volumes, export-import trade flows, regulatory approval data for health claims, organic certification statistics, and consumption demographic trends for green tea bags, loose-leaf varieties, instant mixes, and ready-to-drink formulations.

ย 

Primary Research

To gather both qualitative and quantitative information, the primary research process involved interviewing players from both the supply and demand sides. Executives, sourcing and procurement directors, plantation estate managers, heads of tea processing and blending facilities, and export compliance officers from private label OEMs and major green tea growers were among the supply-side sources. On the demand side, we heard from grocery store and hypermarket category managers, convenience store buyer networks, beverage category leads on e-commerce platforms, distributors of food and drink, proprietors of specialty tea shops, and procurement executives from companies that make ready-to-drink beverages. We acquired information on taste innovation adoption patterns, private label versus branded pricing tactics, and retail shelf placement dynamics through primary research. Additionally, we confirmed pipeline deadlines for organic and fair-trade certification and validated market segmentation across distribution channels.

Primary Respondent Breakdown:

By Designation: C-level Executives (28%), VP/Director Level (32%), Managers/Others (40%)

By Region: North America (32%), Europe (25%), Asia-Pacific (33%), Rest of World (10%)

By Value Chain Position: Upstream Producers (27%), Midstream Processors/Distributors (35%), Downstream Retail/Brands (38%)

ย 

Market Size Estimation

Global market valuation was derived through production volume mapping and trade flow analysis across the value chain. The methodology included:

Identification of 85+ key green tea producers, blenders, and branded product manufacturers across China, Japan, India, Kenya, Vietnam, and South Korea

Product mapping across green tea bags, loose-leaf bulk tea, instant tea powders, iced tea ready-to-drink formulations, and flavored variants (lemon, aloe-vera, cinnamon, vanilla, basil)

Analysis of reported and modeled export volumes, auction prices at Colombo, Mombasa, and Kolkata tea exchanges, and retail point-of-sale data

Coverage of producers and brands representing 75-80% of global market share in 2024

Extrapolation using bottom-up (harvest volume ร— regional farm-gate prices ร— processing markups ร— retail channel multipliers by country) and top-down (commodity export value validation against branded product retail revenue) approaches to derive segment-specific valuations for conventional versus organic certifications and flavor sub-segments

Download Free Sample

Kindly complete the form below to receive a free sample of this Report

Download PDF ×

We do not share your information with anyone. However, we may send you emails based on your report interest from time to time. You may contact us at any time to opt-out.

















