Green Tea Market (2026 - 2035)

ID: MRFR/FnB/2273-HCR 110 Pages Sakshi Gupta Last Updated: September 15, 2026
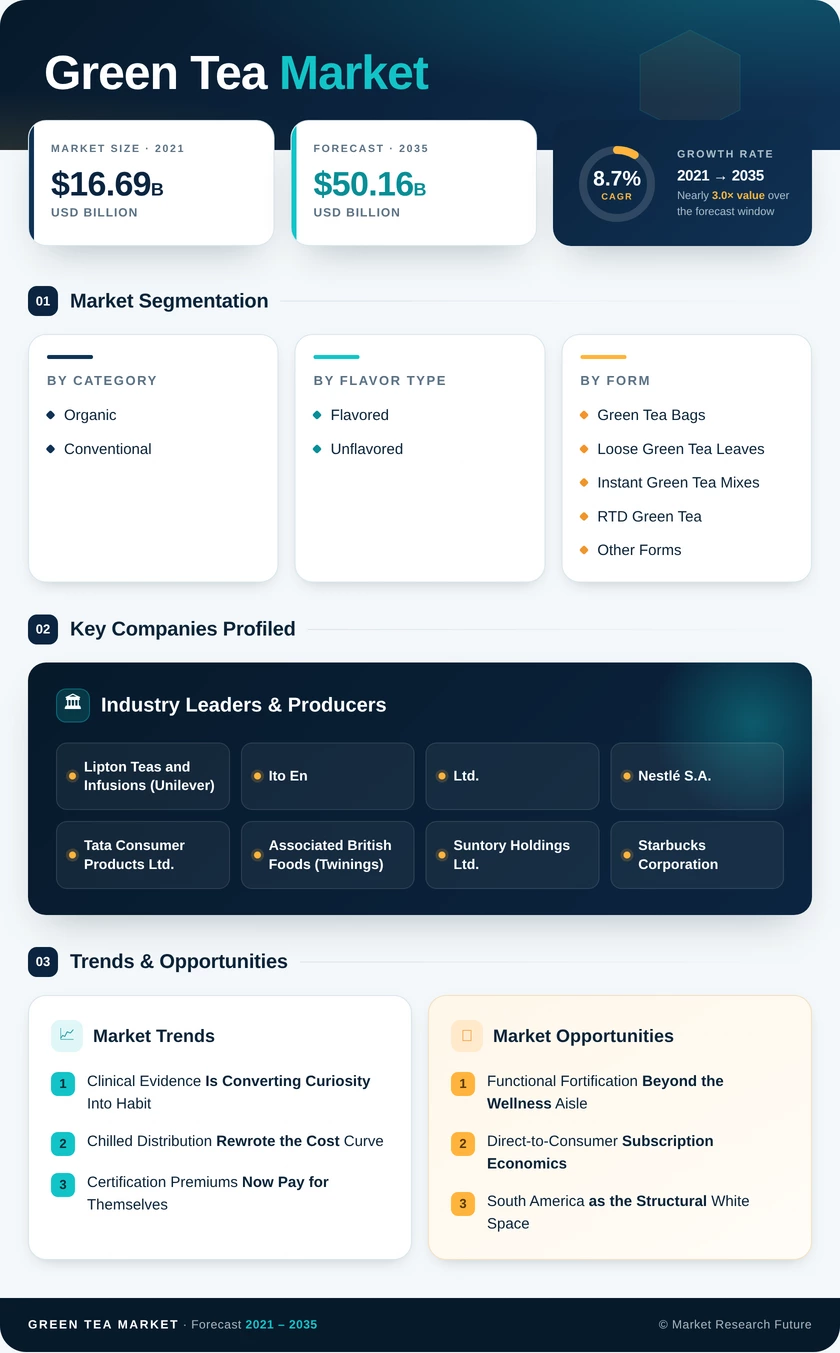
Green Tea Market Size, Share, Industry Trend & Analysis Research Report Information By Category (Organic, Conventional), By Flavor Type (Flavored, Unflavored), By Form (Green Tea Bags, Loose Green Tea Leaves, Instant Green Tea Mixes, RTD Green Tea, Other Forms), By Distribution Channel (Supermarkets and Hypermarkets, Specialty Stores, Online Retail, Convenience Stores, Other Channels), By Geography (North America, Europe, Asia-Pacific, South America, Middle East & Africa) – Forecast Till 2035
Green Tea Market
Market Size
Forecast Period2026-2035
CAGR (2026-2035)8.7%
2025 Market SizeUSD 21.86 Billion
2035 Market SizeUSD 50.16 Billion
Key Players
Lipton Teas and Infusions
Ito En, Ltd.
Nestlé S.A.
Tata Consumer Products Ltd.
Associated British Foods
Suntory Holdings Ltd.
Opportunities
  • Functional Fortification Beyond the Wellness Aisle
  • Direct-to-Consumer Subscription Economics
  • South America as the Structural White Space
  1. 1 Market Overview |
    1. 1.1 Study Assumptions & Market Definition |
    2. 1.2 Scope of the Study |
    3. 1.3 Research Methodology
  2. 2 Market Summary & Key Takeaways |
    1. 2.1 Key Takeaways by Category |
    2. 2.2 Key Takeaways by Product Form |
    3. 2.3 Key Takeaways by Geography
  3. 3 Global Market Size & Forecast (2021–2035) |
    1. 3.1 Historical Market Size (2021–2024) |
    2. 3.2 Base Year Estimate (2025) |
    3. 3.3 Forecast Market Size (2026–2035) |
    4. 3.4 Year-over-Year Growth Analysis
  4. 4 Market Drivers Analysis |
    1. 4.1 Wellness-Led Beverage Substitution |
    2. 4.2 RTD Chilled-Format Expansion |
    3. 4.3 Organic and Clean-Label Certification |
    4. 4.4 E-Commerce and Direct-to-Consumer Growth |
    5. 4.5 Functional Fortification with Botanicals |
    6. 4.6 Emerging-Market Middle-Class Formation |
    7. 4.7 Specialty Foodservice Menu Adoption
  5. 5 Market Restraints Analysis |
    1. 5.1 Climate Volatility in Growing Belts |
    2. 5.2 Raw Leaf and Freight Cost Inflation |
    3. 5.3 Pesticide Residue and MRL Compliance |
    4. 5.4 Health-Claim Regulatory Scrutiny |
    5. 5.5 Sugar Levies on Sweetened Variants
  6. 6 Market Opportunity Analysis |
    1. 6.1 Functional Fortification Beyond the Wellness Aisle |
    2. 6.2 Direct-to-Consumer Subscription Economics |
    3. 6.3 South America as Structural White Space |
    4. 6.4 Compliance-Grade Sustainable Packaging |
    5. 6.5 Extract-Based Ingredient Supply |
    6. 6.6 Industry Value Chain Analysis |
    7. 6.7 Porter's Five Forces Analysis
  7. 7 Regional Analysis |
    1. 7.1 North America | |
      1. 7.1.1 US | |
      2. 7.1.2 Canada | |
      3. 7.1.3 Mexico |
    2. 7.2 Europe | |
      1. 7.2.1 Germany | |
      2. 7.2.2 UK | |
      3. 7.2.3 France | |
      4. 7.2.4 Italy | |
      5. 7.2.5 Spain | |
      6. 7.2.6 Nordic Countries | |
      7. 7.2.7 Russia | |
      8. 7.2.8 Rest of Europe |
    3. 7.3 Asia-Pacific | |
      1. 7.3.1 China | |
      2. 7.3.2 India | |
      3. 7.3.3 Japan | |
      4. 7.3.4 South Korea | |
      5. 7.3.5 ASEAN | |
      6. 7.3.6 Rest of Asia-Pacific |
    4. 7.4 South America | |
      1. 7.4.1 Brazil | |
      2. 7.4.2 Argentina | |
      3. 7.4.3 Rest of South America |
    5. 7.5 Middle East & Africa | |
      1. 7.5.1 Saudi Arabia | |
      2. 7.5.2 UAE | |
      3. 7.5.3 South Africa | |
      4. 7.5.4 Egypt | |
      5. 7.5.5 Rest of Middle East & Africa
  8. 8 Future Outlook (2026–2035) |
    1. 8.1 Precision Agriculture on the Tea Estate |
    2. 8.2 Personalised Nutrition Integration |
    3. 8.3 Supply Chain Transparency |
    4. 8.4 Carbon Accounting in Procurement
  9. 9 Segmentation Analysis |
    1. 9.1 By Category | |
      1. 9.1.1 Organic | |
      2. 9.1.2 Conventional |
    2. 9.2 By Flavor Type | |
      1. 9.2.1 Flavored | |
      2. 9.2.2 Unflavored |
    3. 9.3 By Form | |
      1. 9.3.1 Green Tea Bags | |
      2. 9.3.2 Loose Green Tea Leaves | |
      3. 9.3.3 RTD Green Tea | |
      4. 9.3.4 Instant Green Tea Mixes | |
      5. 9.3.5 Other Forms |
    4. 9.4 By Distribution Channel | |
      1. 9.4.1 Supermarkets and Hypermarkets | |
      2. 9.4.2 Specialty Stores | |
      3. 9.4.3 Online Retail | |
      4. 9.4.4 Convenience Stores | |
      5. 9.4.5 Other Channels
  10. 10 Competitive Landscape |
    1. 10.1 Market Concentration Analysis (2026) |
    2. 10.2 Competitive Benchmarking Matrix |
    3. 10.3 Company Profiles | |
      1. 10.3.1 Lipton Teas and Infusions (Unilever) | |
      2. 10.3.2 Ito En, Ltd. | |
      3. 10.3.3 Nestlé S.A. | |
      4. 10.3.4 Tata Consumer Products Ltd. | |
      5. 10.3.5 Associated British Foods (Twinings) | |
      6. 10.3.6 Suntory Holdings Ltd. | |
      7. 10.3.7 Starbucks Corporation | |
      8. 10.3.8 Kirin Holdings Company | |
      9. 10.3.9 The Hain Celestial Group | |
      10. 10.3.10 AMOREPACIFIC (Osulloc) | |
      11. 10.3.11 Wagh Bakri Tea Group | |
      12. 10.3.12 Bigelow Tea Company
  11. 11 Recent Developments & News
  12. 12 Report Scope & Methodology |
    1. 12.1 Study Period & Base Year |
    2. 12.2 Valuation Currency & Units |
    3. 12.3 Forecast Assumptions
  13. 13 Detailed Sources & Citations
  14. 14 Frequently Asked Questions
  15. 15 LIST OF TABLES |
  16. TABLE 1 Global Green Tea Market Size & Forecast, by Revenue (USD Billion), 2021–2035 |
  17. TABLE 2 Global Green Tea Market – Year-over-Year Growth Analysis, 2021–2035 |
  18. TABLE 3 Driver Impact Analysis – Global Green Tea Market, 2026–2035 |
  19. TABLE 4 Restraint Impact Analysis – Global Green Tea Market, 2026–2035 |
  20. TABLE 5 Global Green Tea Market Size, by Region, 2021–2035 (USD Billion) |
  21. TABLE 6 North America Green Tea Market Size, by Country, 2021–2035 (USD Billion) |
  22. TABLE 7 Europe Green Tea Market Size, by Country, 2021–2035 (USD Billion) |
  23. TABLE 8 Asia-Pacific Green Tea Market Size, by Country, 2021–2035 (USD Billion) |
  24. TABLE 9 South America Green Tea Market Size, by Country, 2021–2035 (USD Billion) |
  25. TABLE 10 Middle East & Africa Green Tea Market Size, by Country, 2021–2035 (USD Billion) |
  26. TABLE 11 Global Green Tea Market Size, by Category, 2021–2035 (USD Billion) |
  27. TABLE 12 Global Green Tea Market Size, by Flavor Type, 2021–2035 (USD Billion) |
  28. TABLE 13 Global Green Tea Market Size, by Form, 2021–2035 (USD Billion) |
  29. TABLE 14 Global Green Tea Market Size, by Distribution Channel, 2021–2035 (USD Billion) |
  30. TABLE 15 North America Green Tea Market Size, by Form, 2021–2035 (USD Billion) |
  31. TABLE 16 Europe Green Tea Market Size, by Category, 2021–2035 (USD Billion) |
  32. TABLE 17 Asia-Pacific Green Tea Market Size, by Distribution Channel, 2021–2035 (USD Billion) |
  33. TABLE 18 South America Green Tea Market Size, by Form, 2021–2035 (USD Billion) |
  34. TABLE 19 Middle East & Africa Green Tea Market Size, by Flavor Type, 2021–2035 (USD Billion) |
  35. TABLE 20 Competitive Benchmarking Matrix – Global Green Tea Market, 2026 |
  36. TABLE 21 Company Profiles – Key Players, Global Green Tea Market |
  37. TABLE 22 Recent Developments & Strategic Announcements, 2023–2025 |
  38. TABLE 23 Report Scope & Methodology Summary |
  39. TABLE 24 Detailed Sources & Citations Index
  40. 16 LIST OF FIGURES |
  41. FIGURE 1 Global Green Tea Market – Market Dynamics Overview (Drivers, Restraints, Opportunities) |
  42. FIGURE 2 Global Green Tea Market – Industry Value Chain Analysis |
  43. FIGURE 3 Global Green Tea Market – Porter's Five Forces Analysis |
  44. FIGURE 4 Global Green Tea Market Size Trend & Forecast, 2021–2035 (USD Billion) |
  45. FIGURE 5 Global Green Tea Market – Year-over-Year Growth Trajectory, 2022–2035 |
  46. FIGURE 6 Market Share by Category, 2025 vs 2035 (%) |
  47. FIGURE 7 Market Share by Flavor Type, 2025 vs 2035 (%) |
  48. FIGURE 8 Market Share by Form, 2025 vs 2035 (%) |
  49. FIGURE 9 Market Share by Distribution Channel, 2025 vs 2035 (%) |
  50. FIGURE 10 Regional Value Share Distribution, 2025 (%) |
  51. FIGURE 11 Regional CAGR Comparison, 2026–2035 (%) |
  52. FIGURE 12 Country-Level Growth Heat Map, 2026–2035 |
  53. FIGURE 13 Competitive Landscape – Estimated Revenue Share Positioning, 2026 |
  54. FIGURE 14 Strategic Positioning Matrix – Scale vs Premiumisation |
  55. FIGURE 15 Organic vs Conventional Growth Divergence, 2021–2035

Segmentation Quick Reference

DimensionSub-SegmentsDominant SegmentFastest Growing Segment
By CategoryOrganic, ConventionalConventionalOrganic
By Flavor TypeFlavored, UnflavoredUnflavoredFlavored
By FormGreen Tea Bags, Loose Green Tea Leaves, Instant Green Tea Mixes, RTD Green Tea, Other FormsGreen Tea BagsRTD Green Tea
By Distribution ChannelSupermarkets and Hypermarkets, Specialty Stores, Online Retail, Convenience Stores, Other ChannelsSupermarkets and HypermarketsOnline Retail
By GeographyNorth America, Europe, Asia-Pacific, South America, Middle East & AfricaAsia-PacificSouth America


Market Segmentation Overview

By Category

Sub-SegmentKey Trend
ConventionalScale economics absorb leaf price volatility; anchors private label and foodservice supply
OrganicCooperative conversion financing has closed the yield-penalty gap, accelerating certified acreage


Category dynamics hinge on financing rather than consumer demand. Certified supply has historically lagged appetite because three-year conversion periods stranded smallholder income; that constraint is now easing across Sri Lankan and Chinese origins.

By Flavor Type

Sub-SegmentKey Trend
UnflavoredPreferred in producing regions and among experienced consumers; carries higher single-origin margin
FlavoredFunctions as a recruitment format in Western and Latin American markets, softening vegetal profiles


Brands increasingly treat flavour as a funnel stage rather than a permanent segment. Acquisition happens through jasmine and citrus infusions; retention and margin come from migrating those buyers toward unflavoured estate lines.

By Form

Sub-SegmentKey Trend
Green Tea BagsMature volume base now facing packaging reformulation costs under European recyclability rules
Loose Green Tea LeavesPremium and traditional consumption anchor; strongest in China, Japan, and specialty retail
RTD Green TeaFastest-expanding form as chilled capacity investments convert marketing demand into shipped volume
Instant Green Tea MixesTravel, hospitality, and institutional channels drive steady incremental uptake
Other FormsCeremonial powder and capsule systems deliver outsized margin relative to volume share


Form migration is the defining structural shift of this decade. Bagged tea will not decline in absolute terms, but nearly all incremental value creation is moving toward chilled and powder presentations that command higher price points per serving.

By Distribution Channel

Sub-SegmentKey Trend
Supermarkets and HypermarketsRetains half of global value through routine restock behaviour and assortment breadth
Specialty StoresExpert selling supports premium discovery and single-origin trial
Online RetailSubscription and direct-to-consumer models capture materially higher margin per unit
Convenience StoresChilled single-serve availability drives impulse consumption occasions
Other ChannelsFoodservice, hospitality, and institutional contracts provide volume stability


Channel strategy now determines profitability more than product formulation does. Grocery delivers reach; digital delivers margin and first-party consumption data that increasingly informs blend development and replenishment forecasting.


 

Download PDF ×

We do not share your information with anyone. However, we may send you emails based on your report interest from time to time. You may contact us at any time to opt-out.