• Cat-intel
  • MedIntelliX
  • Resources
  • About Us
  • Request Free Sample ×

    Kindly complete the form below to receive a free sample of this Report

    Leading companies partner with us for data-driven Insights

    clients tt-cursor
    Hero Background

    Graph Technology Market

    ID: MRFR/ICT/29905-HCR
    100 Pages
    Aarti Dhapte
    October 2025

    Graph Technology Market Research Report By Graph Database Types (RDF Stores, Property Graphs, Graph Analytics Databases, Multi-Model Databases), By Deployment Model (On-Premises, Cloud-Based, Hybrid), By Application Areas (Social Networks, Fraud Detection, Recommendation Engines, Network and IT Operations, Knowledge Graphs), By End User Industry (IT and Telecommunications, Banking, Financial Services and Insurance (BFSI), Retail and E-commerce, Healthcare, Transportation and Logistics), By Scalability Type (Vertical Scaling, Horizontal Scali...

    Share:
    Download PDF ×

    We do not share your information with anyone. However, we may send you emails based on your report interest from time to time. You may contact us at any time to opt-out.

    Graph Technology Market Infographic
    Purchase Options

    Graph Technology Market Summary

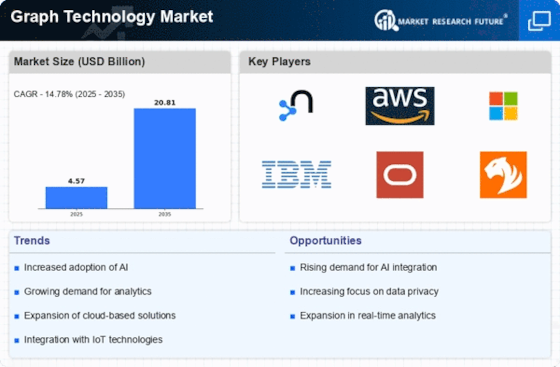
    As per MRFR analysis, the Graph Technology Market Size was estimated at 4.567 USD Billion in 2024. The Graph Technology industry is projected to grow from 5.242 USD Billion in 2025 to 20.81 USD Billion by 2035, exhibiting a compound annual growth rate (CAGR) of 14.78 during the forecast period 2025 - 2035.

    Key Market Trends & Highlights

    <p>The Graph Technology Market is experiencing robust growth driven by diverse applications and technological advancements.</p>

    • The adoption of graph databases is increasing significantly, particularly in North America, which remains the largest market.
    • Integration with artificial intelligence is becoming a pivotal trend, enhancing the capabilities of graph technologies across various sectors.
    • Real-time analytics is gaining traction, especially in the Asia-Pacific region, which is recognized as the fastest-growing market.
    • Rising demand for data connectivity and advancements in graph algorithms are key drivers propelling the expansion of property graphs and cloud-based solutions.

    Market Size & Forecast

    2024 Market Size 4.567 (USD Billion)
    2035 Market Size 20.81 (USD Billion)
    CAGR (2025 - 2035) 14.78%

    Major Players

    Neo4j (US), Amazon Web Services (US), Microsoft (US), IBM (US), Oracle (US), TigerGraph (US), DataStax (US), ArangoDB (DE), SAP (DE), Cytoscape (US)

    Graph Technology Market Trends

    The Graph Technology Market is currently experiencing a notable evolution, driven by the increasing demand for advanced data management solutions. Organizations are recognizing the value of graph databases in handling complex relationships and interconnected data. This shift is largely attributed to the growing need for real-time analytics and insights, which traditional databases often struggle to provide. As businesses seek to enhance their decision-making processes, the adoption of graph technology appears to be gaining momentum across various sectors, including finance, healthcare, and telecommunications. Furthermore, the integration of artificial intelligence and machine learning with graph databases is likely to enhance their capabilities, enabling more sophisticated data analysis and visualization. In addition, the Graph Technology Market is witnessing a surge in interest from startups and established companies alike, as they explore innovative applications of graph technology. This trend suggests a vibrant ecosystem where collaboration and knowledge sharing are becoming increasingly prevalent. As organizations continue to invest in digital transformation initiatives, the role of graph technology in facilitating seamless data integration and enhancing operational efficiency is expected to expand. Overall, the Graph Technology Market seems poised for substantial growth, driven by technological advancements and evolving business needs.

    Increased Adoption of Graph Databases

    Organizations are increasingly recognizing the advantages of graph databases for managing complex data relationships. This trend indicates a shift from traditional database systems to more flexible and efficient graph-based solutions.

    Integration with Artificial Intelligence

    The convergence of graph technology with artificial intelligence is becoming more pronounced. This integration enhances data analysis capabilities, allowing organizations to derive deeper insights and make informed decisions.

    Focus on Real-Time Analytics

    There is a growing emphasis on real-time analytics within the Graph Technology Market. Businesses are seeking solutions that provide immediate insights, enabling them to respond swiftly to changing market conditions.

    The increasing complexity of data relationships in various sectors appears to drive a growing demand for graph technology, which may enhance data connectivity and analytical capabilities.

    U.S. Department of Commerce

    Graph Technology Market Drivers

    Advancements in Graph Algorithms

    The Graph Technology Market is benefiting from continuous advancements in graph algorithms, which enhance the capabilities of graph databases. These algorithms enable more efficient data processing and analysis, allowing organizations to extract valuable insights from complex data structures. Innovations in machine learning and artificial intelligence are further propelling the development of sophisticated graph algorithms. As these technologies evolve, they are likely to improve the performance and scalability of graph databases, making them more appealing to businesses. This trend suggests a promising future for the graph technology market as organizations seek to harness the power of advanced algorithms.

    Rising Demand for Data Connectivity

    The Graph Technology Market is experiencing a notable surge in demand for enhanced data connectivity solutions. Organizations are increasingly recognizing the value of interconnected data, which allows for more comprehensive insights and decision-making. This trend is driven by the need to manage complex relationships within data sets, particularly in sectors such as finance and healthcare. As businesses strive to leverage their data assets, the market for graph technology is projected to grow at a compound annual growth rate of approximately 25 percent over the next five years. This growth indicates a robust shift towards graph databases that facilitate better data relationships and connectivity.

    Expansion of Use Cases Across Industries

    The Graph Technology Market is witnessing an expansion of use cases across various sectors, including telecommunications, retail, and cybersecurity. Companies are increasingly adopting graph technologies to address specific challenges such as fraud detection, recommendation systems, and network analysis. For instance, in the telecommunications sector, graph databases are utilized to optimize network performance and customer experience. The versatility of graph technology allows organizations to tailor solutions to their unique needs, thereby driving market growth. As more industries recognize the potential of graph technology, the market is expected to see a significant increase in adoption rates.

    Integration with Cloud Computing Solutions

    The Graph Technology Market is experiencing a significant shift towards integration with cloud computing solutions. As businesses increasingly migrate their operations to the cloud, the demand for cloud-based graph databases is on the rise. This integration allows organizations to leverage the scalability and flexibility of cloud environments while utilizing the advanced capabilities of graph technology. The market for cloud-based graph solutions is projected to grow substantially, as companies seek to enhance their data management strategies. This trend indicates a strong alignment between cloud computing and graph technology, suggesting a promising trajectory for the market.

    Growing Emphasis on Data Privacy and Security

    The Graph Technology Market is increasingly influenced by the growing emphasis on data privacy and security. As organizations face mounting regulatory pressures and consumer expectations regarding data protection, the need for secure data management solutions becomes paramount. Graph databases offer unique advantages in this regard, as they can provide enhanced security features and better compliance with data protection regulations. This focus on security is likely to drive the adoption of graph technology, as businesses seek to safeguard sensitive information while maintaining data accessibility. Consequently, the market is expected to expand as organizations prioritize secure data practices.

    Market Segment Insights

    By Type: Property Graphs (Largest) vs. RDF Stores (Fastest-Growing)

    In the Graph Technology Market, Property Graphs hold the largest market share, primarily due to their ease of use and capability to represent complex relationships among data efficiently. This dominance is reflected in their widespread adoption across various industries, including finance, telecommunications, and social media. Meanwhile, RDF Stores are emerging rapidly, gaining traction for their ability to manage large volumes of semantic data, thus appealing to organizations focusing on data interoperability and comprehensive data integration strategies. The growth trends within this segment are largely driven by the increasing demand for advanced analytics and the need for businesses to leverage their data for competitive advantage. The rise of AI and machine learning applications is also propelling both Property Graphs and RDF Stores, as organizations seek sophisticated tools to manage and analyze massive datasets. Additionally, the ongoing digital transformation across industries solidifies the graph technology framework as a vital component in modern data architectures.

    Property Graphs (Dominant) vs. RDF Stores (Emerging)

    Property Graphs are characterized by their versatile data modeling capabilities, allowing users to represent entities and relationships intuitively. This dominant segment benefits from a strong presence in various sectors, thanks to their efficiency in storing and querying complex, interconnected data. Organizations leveraging property graphs find them especially useful for use cases like recommendation systems and fraud detection. Conversely, RDF Stores are gaining recognition as an emerging technology in the graph database landscape, especially among data-driven organizations requiring robust frameworks for semantic data representation. They emphasize relationships defined by shared vocabularies, making them particularly advantageous for overcoming challenges related to data silos and interoperability in large data ecosystems.

    By Deployment Model: Cloud-Based (Largest) vs. Hybrid (Fastest-Growing)

    In the Graph Technology Market, the deployment model segment showcases a diverse landscape characterized by three main models: On-Premises, Cloud-Based, and Hybrid. The Cloud-Based deployment model holds the largest market share, driven by the increasing demand for scalable solutions and reduced infrastructural costs. In contrast, Hybrid models are gaining traction as organizations seek to leverage both on-premise and cloud resources effectively, highlighting a dynamic shift in deployment preferences within the industry. The growth trends in the deployment model segment are largely influenced by the evolution of digital transformation strategies among enterprises. As businesses continue to modernize their IT infrastructure, the focus on Cloud-Based solutions has intensified, catering to the needs for flexibility and remote accessibility. Hybrid models are emerging rapidly, attributed to their adaptive nature which allows organizations to transition smoothly between on-premise and cloud environments, responding effectively to varying operational requirements.

    Deployment: Cloud-Based (Dominant) vs. Hybrid (Emerging)

    The Cloud-Based deployment model in the Graph Technology Market represents a dominant force, primarily due to its inherent advantages in scalability and cost-effectiveness. Businesses are increasingly adopting this model to streamline operations and harness real-time data processing capabilities without the burden of extensive physical infrastructure. In contrast, the Hybrid model is emerging as a popular choice among organizations that require a blended approach, enabling them to maintain sensitive workloads on-site while leveraging cloud resources for analytics and innovation. This duality allows for greater control and security, making Hybrid an attractive option for industries facing stringent compliance requirements. The interplay between these models illustrates a significant trend towards flexibility and responsiveness in the deployment of graph technologies.

    By Application Areas: Social Networks (Largest) vs. Recommendation Engines (Fastest-Growing)

    Within the Graph Technology Market, the application areas exhibit distinct market share distributions. Social Networks hold the largest share due to their inherent need for expansive and interconnected data manipulation. This segment is heavily used for user engagement strategies, while Recommendation Engines, though smaller, are rapidly gaining traction as businesses seek personalized customer experiences. Other areas like Fraud Detection, Network and IT Operations, and Knowledge Graphs also play essential roles, but they cater to niche requirements and are growing at different rates.

    Social Networks (Dominant) vs. Recommendation Engines (Emerging)

    Social Networks represent a dominant force within the Graph Technology Market, leveraging vast amounts of user data to enhance connectivity and engagement. This sector thrives on the ability to visualize relationships and patterns in user behavior. In contrast, Recommendation Engines, though emerging, are becoming increasingly significant as companies recognize the value of personalized recommendations, driven by data insights. As machine learning algorithms become more sophisticated, the effectiveness of these engines in predicting user preferences will drive their market expansion. Both segments are essential, each serving distinct needs in a data-driven world.

    By End User Industry: IT and Telecommunications (Largest) vs. Banking, Financial Services and Insurance (BFSI) (Fastest-Growing)

    The Graph Technology Market is predominantly driven by the IT and Telecommunications sector, which holds a significant portion of the market shares. This sector's rigorous demand for enhanced data management and analytics capabilities fuels the adoption of graph technologies, leading to substantial investments and innovations. Other notable segments include Banking, Financial Services, and Insurance (BFSI), which is rapidly growing as institutions strive to leverage complex data relationships for fraud detection and risk management. The robust competition among these sectors underscores their pivotal role in advancing graph technology solutions.

    Transportation and Logistics (Dominant) vs. Retail and E-commerce (Emerging)

    Transportation and Logistics is emerging as a dominant player in the Graph Technology Market, utilizing advanced graph algorithms to optimize routes and enhance supply chain efficiencies. This sector benefits from real-time data analytics, enabling stakeholders to make informed decisions and streamline operations. In contrast, Retail and E-commerce represents an emerging sector that is increasingly adopting graph technology to personalize customer experiences and improve inventory management. While Retail integrates graph solutions to understand consumer behavior better, Transportation focuses on logistics optimization, showcasing the versatile applications of graph technologies across varied end-user industries.

    By Scalability Type: Vertical Scaling (Largest) vs. Horizontal Scaling (Fastest-Growing)

    In the Graph Technology Market, both Vertical and Horizontal Scaling are pivotal, yet their market share distribution highlights distinct preferences among users. Vertical Scaling, recognized for its robust capabilities and single-node performance enhancements, holds a significant share, serving enterprises that prioritize traditional scalability methods. On the other hand, Horizontal Scaling, characterized by its ability to distribute workloads across multiple nodes, is increasingly attracting attention for its flexibility and efficiency in handling large datasets, thus claiming a growing share of the market.

    Scalability Type: Vertical Scaling (Dominant) vs. Horizontal Scaling (Emerging)

    Vertical Scaling in the Graph Technology Market is often seen as the dominant choice for organizations looking for high-performance solutions within existing hardware. This approach enhances processing power by upgrading individual machines, making it suitable for businesses focused on stability and control. Conversely, Horizontal Scaling is emerging rapidly, appealing to companies requiring scalable solutions that can seamlessly integrate additional nodes as demand grows. This adaptability is driving its adoption among tech-savvy firms that prioritize innovation and efficiency in data management. The shift towards distributed systems is shaping a competitive landscape where Horizontal Scaling is becoming an essential option for modern businesses.

    Get more detailed insights about Graph Technology Market

    Regional Insights

    North America : Innovation and Leadership Hub

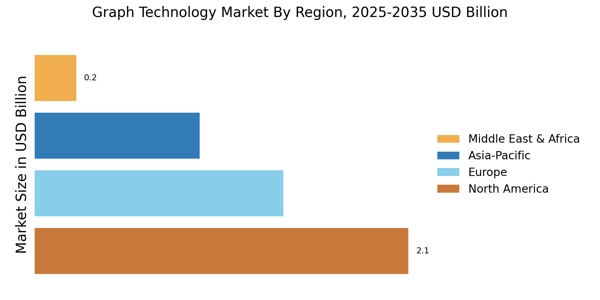
    North America is the largest market for graph technology, holding approximately 45% of the global share. The region's growth is driven by increasing demand for data analytics, AI integration, and cloud computing solutions. Regulatory support for technology innovation and data privacy laws further catalyze market expansion. The U.S. government’s initiatives to promote digital transformation are also significant growth drivers. The competitive landscape is robust, with key players like Neo4j, Amazon Web Services, and Microsoft leading the charge. The presence of major tech companies fosters innovation and collaboration, enhancing the region's market position. Additionally, the U.S. is home to numerous startups focusing on niche applications of graph technology, further diversifying the market offerings.

    Europe : Emerging Market with Potential

    Europe is the second-largest market for graph technology, accounting for about 30% of the global share. The region's growth is fueled by increasing investments in digital infrastructure and a rising focus on data-driven decision-making across various sectors. Regulatory frameworks like the GDPR promote responsible data usage, which indirectly boosts the demand for graph technologies that enhance data management and analytics capabilities. Leading countries in this region include Germany, the UK, and France, where companies are increasingly adopting graph databases for complex data relationships. Key players such as ArangoDB and SAP are pivotal in driving innovation. The competitive landscape is characterized by a mix of established firms and emerging startups, creating a dynamic environment for growth and collaboration.

    Asia-Pacific : Rapid Growth and Adoption

    Asia-Pacific is witnessing rapid growth in the graph technology market, holding approximately 20% of the global share. The region's expansion is driven by increasing digital transformation initiatives, a surge in data generation, and the adoption of advanced analytics. Countries like China and India are leading this growth, supported by government policies that encourage technology adoption and innovation in various sectors. China is at the forefront, with significant investments in AI and big data analytics, while India is emerging as a hub for tech startups focusing on graph technologies. The competitive landscape features both local and international players, with companies like DataStax and TigerGraph making significant inroads. The region's diverse market dynamics present unique opportunities for growth and collaboration.

    Middle East and Africa : Untapped Market Potential

    The Middle East and Africa region is gradually emerging in the graph technology market, currently holding about 5% of the global share. The growth is primarily driven by increasing digitalization efforts and investments in technology infrastructure. Governments in countries like the UAE and South Africa are implementing initiatives to enhance their digital economies, which is expected to boost the adoption of graph technologies in the coming years. Leading countries in this region include the UAE and South Africa, where there is a growing interest in data analytics and management solutions. The competitive landscape is still developing, with a mix of local startups and international players beginning to establish a presence. As awareness of graph technology increases, the market is poised for significant growth in the near future.

    Key Players and Competitive Insights

    The Graph Technology Market is currently characterized by a dynamic competitive landscape, driven by the increasing demand for advanced data management solutions and the growing complexity of data relationships. Key players such as Neo4j (US), Amazon Web Services (US), and Microsoft (US) are at the forefront, each adopting distinct strategies to enhance their market positioning. Neo4j (US) focuses on innovation through continuous product development, particularly in graph databases, while Amazon Web Services (US) leverages its extensive cloud infrastructure to offer scalable graph solutions. Microsoft (US) emphasizes integration with its existing software ecosystem, thereby enhancing user accessibility and functionality. Collectively, these strategies contribute to a competitive environment that is both collaborative and competitive, as companies seek to differentiate themselves through technological advancements and customer-centric solutions.

    In terms of business tactics, companies are increasingly localizing their operations to better serve regional markets, optimizing supply chains to enhance efficiency, and investing in partnerships to expand their service offerings. The market structure appears moderately fragmented, with a mix of established players and emerging startups. This fragmentation allows for diverse approaches to graph technology, fostering innovation while also intensifying competition among key players.

    In September 2025, Neo4j (US) announced a strategic partnership with a leading AI firm to integrate machine learning capabilities into its graph database solutions. This move is likely to enhance the analytical power of Neo4j's offerings, enabling clients to derive deeper insights from their data. The integration of AI into graph technology could potentially redefine how organizations leverage their data, positioning Neo4j as a leader in this evolving landscape.

    In August 2025, Amazon Web Services (US) launched a new suite of graph analytics tools designed to simplify the process of data visualization and relationship mapping. This initiative is indicative of AWS's commitment to enhancing user experience and accessibility, which may attract a broader customer base. By streamlining complex data interactions, AWS could solidify its position as a go-to provider for businesses seeking to harness the power of graph technology.

    In July 2025, Microsoft (US) unveiled an upgraded version of its Azure Cosmos DB, incorporating advanced graph capabilities that allow for more sophisticated data modeling. This enhancement is strategically significant as it aligns with the growing trend of integrating graph databases into cloud services, thereby reinforcing Microsoft's competitive edge in the cloud computing space. The ability to offer comprehensive data solutions could enhance customer retention and attract new clients seeking robust graph functionalities.

    As of October 2025, the competitive trends in the Graph Technology Market are increasingly influenced by digitalization, sustainability, and the integration of artificial intelligence. Strategic alliances are becoming more prevalent, as companies recognize the value of collaboration in driving innovation and expanding market reach. Looking ahead, it is anticipated that competitive differentiation will evolve, shifting from traditional price-based competition to a focus on innovation, technological advancements, and supply chain reliability. This transition underscores the importance of adaptability and forward-thinking strategies in maintaining a competitive advantage in the rapidly evolving graph technology landscape.

    Key Companies in the Graph Technology Market market include

    Industry Developments

    Recent developments in the Graph Technology Market indicate a surge in adoption across various sectors, driven by the increasing need for advanced data analytics and insights. Organizations are increasingly leveraging graph databases to enhance data connectivity, improve customer experiences, and streamline operations. Notably, significant investments are being made in research and development to enhance the scalability and functionality of graph technologies. Moreover, partnerships between tech companies and startups are fostering innovation, leading to the creation of sophisticated graph-based solutions.

    Emerging trends, such as the integration of artificial intelligence with graph technology, are also gaining traction as enterprises seek to unlock deeper insights from complex datasets. Additionally, the growing focus on real-time data processing and the rise of cloud-based graph solutions are further propelling market growth. Government initiatives aimed at promoting digital transformation are expected to bolster the adoption of graph technologies in various industries, including healthcare, finance, and logistics. As organizations continue to recognize the strategic advantages of graph technology, its market presence is poised for significant expansion in the years ahead.

    Future Outlook

    Graph Technology Market Future Outlook

    The Graph Technology Market is projected to grow at a 14.78% CAGR from 2024 to 2035, driven by increasing data complexity, demand for real-time analytics, and enhanced connectivity.

    New opportunities lie in:

    • Development of advanced graph databases for enterprise applications.
    • Integration of AI-driven analytics in graph solutions.
    • Expansion into IoT data management using graph technology.

    By 2035, the Graph Technology Market is expected to be a pivotal component of data management strategies.

    Market Segmentation

    Graph Technology Market Type Outlook

    • Property Graphs
    • RDF Stores
    • Graph Analytics Databases
    • Multi-Model Databases

    Graph Technology Market Deployment Model Outlook

    • On-Premises
    • Cloud-Based
    • Hybrid

    Graph Technology Market Scalability Type Outlook

    • Vertical Scaling
    • Horizontal Scaling

    Graph Technology Market Application Areas Outlook

    • Social Networks
    • Fraud Detection
    • Recommendation Engines
    • Network and IT Operations
    • Knowledge Graphs

    Graph Technology Market End User Industry Outlook

    • IT and Telecommunications
    • Banking, Financial Services and Insurance (BFSI)
    • Retail and E-commerce
    • Healthcare
    • Transportation and Logistics

    Report Scope

    Report Attribute/Metric Details
    Market Size 2024 4.56 (USD Billion)
    Market Size 2025 5.24 (USD Billion)
    Market Size 2035 20.81 (USD Billion)
    Compound Annual Growth Rate (CAGR) 14.78% (2025 - 2035)
    Report Coverage Revenue Forecast, Competitive Landscape, Growth Factors, and Trends
    Base Year 2024
    Market Forecast Period 2025 - 2035
    Historical Data 2019 - 2023
    Market Forecast Units USD Billion
    Key Companies Profiled Microsoft, Amazon Web Services, DataStax, TigerGraph, Tibco Software, GraphDB, Snowflake, SAP, IBM, Redis Labs, Couchbase, Oracle, ArangoDB, Google, Neo4j
    Segments Covered Graph Database Types, Deployment Model, Application Areas, End User Industry, Scalability Type, Regional
    Key Market Opportunities Increased demand for data analytics Rise of AI and machine learning Growing need for real-time processing Expansion of IoT applications Enhanced cybersecurity solutions
    Key Market Dynamics Increased data connectivity demands Growing adoption of AI technologies Enhanced fraud detection capabilities Rising need for real-time analytics Expansion of IoT applications
    Countries Covered North America, Europe, APAC, South America, MEA

    FAQs

    What is the expected market size of the Graph Technology Market in 2034?

    The Graph Technology Market is expected to reach a value of 18.12 USD Billion by 2034.

    What is the projected compound annual growth rate (CAGR) for the Graph Technology Market from 2025 to 2034?

    The CAGR for the Graph Technology Market is projected to be 14.78% from 2025 to 2034.

    Which region is anticipated to have the largest market share in the Graph Technology Market by 2034?

    2032? North America is anticipated to have the largest market share, reaching an estimated value of 4.8 USD Billion by 2034.

    How much is the Graph Technology Market in Europe expected to be valued in 2034?

    The market in Europe is expected to be valued at 3.5 USD Billion by 2034.

    What is the market size of the RDF Stores segment in the Graph Technology Market by 2032?

    The RDF Stores segment is projected to be valued at 3.0 USD Billion by 2032.

    What will be the value of the Property Graphs segment in the Graph Technology Market by 2034?

    The Property Graphs segment is expected to reach a value of 4.5 USD Billion by 2034.

    What is the expected value of the Graph Analytics Databases segment in 2032?

    The Graph Analytics Databases segment is expected to be valued at 2.6 USD Billion by 2032.

    Which key players dominate the Graph Technology Market?

    Major players in the market include Microsoft, Amazon Web Services, DataStax, TigerGraph, and Tibco Software.

    What is the market size for South America in the Graph Technology Market by 2032?

    The market size for South America is expected to reach 0.5 USD Billion by 2032.

    How much of the Graph Technology Market is expected to be captured by the APAC region by 2032?

    The APAC region is projected to be valued at 2.8 USD Billion by 2032.

    Download Free Sample

    Kindly complete the form below to receive a free sample of this Report

    Case Study
    Chemicals and Materials