ID: MRFR/F-B & N/6106-HCR | February 2021 | Region: Global | 90 pages
Market Scenario
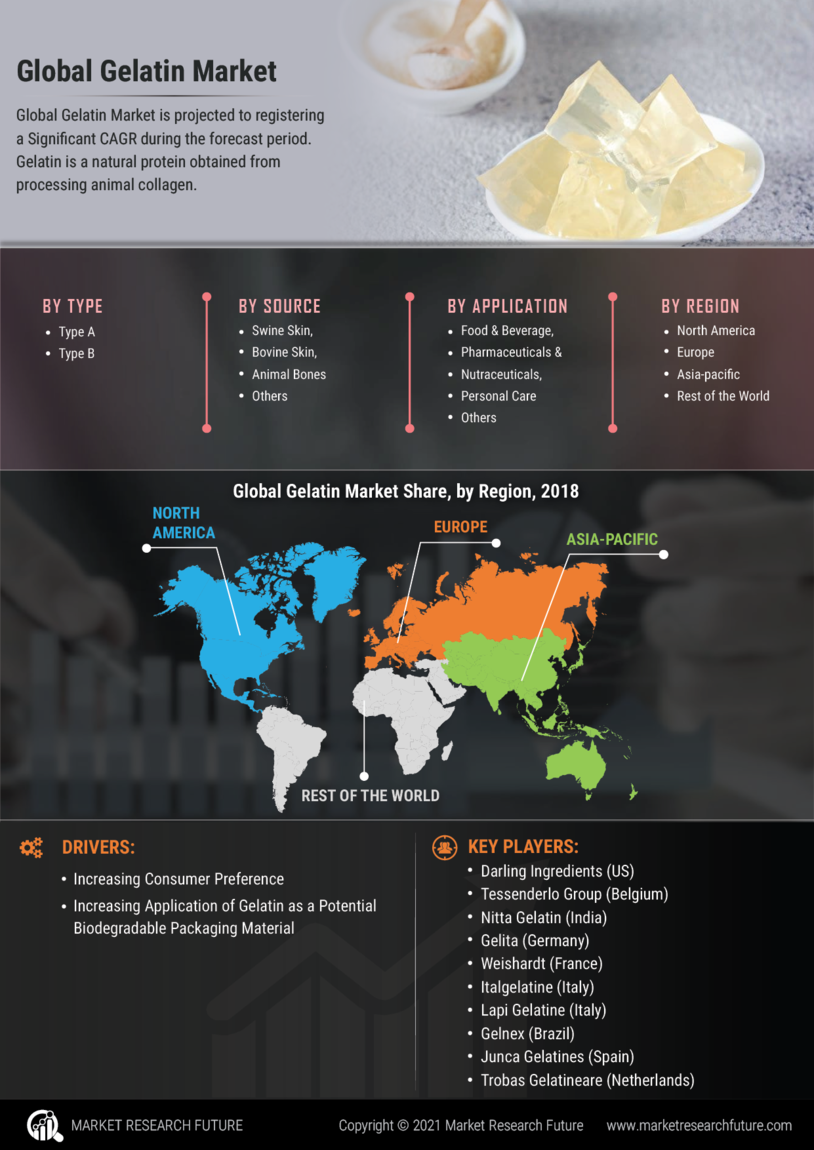
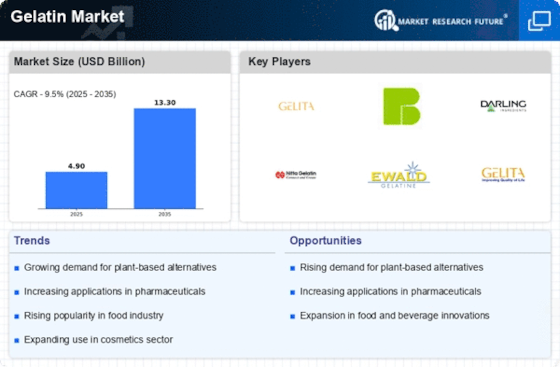
Gelatin is a natural protein obtained from processing animal collagen. It is produced by boiling the connective tissue, bones, and skin of animals, especially pigs and cows. Gelatin is most commonly used as a gelling agent in the food & beverage, pharmaceuticals, and personal care industries. The growth of the end-use industries and increasing demand for natural ingredients is driving the market for gelatin. Increasing application of gelatin as a potential biodegradable packaging material for food products has created new opportunities for players in the global gelatin market. However, the high availability of substitute products such as guar gum, carrageenan, and gum arabic is a major restraint for the growth of the market.
Segmentation
The global gelatin market has been segmented based on type, source, application, and region.
By type, the global market has been classified as type A and type B.
On the basis of source, the global market has been segmented into swine skin, bovine skin, animal bones, and others.
The global gelatin market has also been segregated, on the basis of application, into food & beverage, pharmaceuticals and nutraceuticals, personal care, and others. The food & beverage segment has further been classified as bakery and confectionery, dairy and frozen desserts, beverages, sweet and savory snacks, and others.
The global market has been studied with regard to four key regions—North America, Europe, Asia-Pacific, and the rest of the world.
The North American gelatin market has further been segmented into the US, Canada, and Mexico. The European gelatin market has been classified as Germany, France, Italy, Spain, the UK, and the rest of Europe. The gelatin market in Asia-Pacific has been divided into China, India, Japan, Australia and New Zealand, and the rest of Asia-Pacific. The gelatin industry in the rest of the world has been segmented into South America, the Middle East, and Africa.
Regional Market Summary
Global Gelatin Market Share (%), by Region, 2017
Source: Secondary Sources and MRFR Analysis
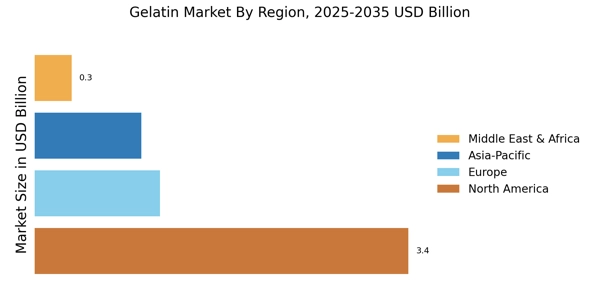
Europe is expected to dominate the market for gelatin during the forecast period owing to the increased consumption of gelatin as a functional and low-calorie diet alternative. However, the market in Asia-Pacific is projected to register the highest CAGR during the forecast period with China and India being the largest country-level markets for gelatin in the region. Increasing consumer preference for high protein products is boosting the demand for gelatin in the region.
Global Market, by Type
Global Market, by Source
Global Market, by Application
Global Market, by Region
Intended Audience
TABLE OF CONTENTS
1 Executive Summary
2 Scope of the Report
2.1 Market Definition
2.2 Scope of the Study
2.2.1 Research Objectives
2.2.2 Assumptions & Limitations
2.3 Market Structure
3 Market Research Methodology
3.1 Research Process
3.2 Secondary Research
3.3 Primary Research
3.4 Forecast Model
4 Market Landscape
4.1 Supply Chain Analysis
4.1.1 Raw Material Suppliers
4.1.2 Manufacturers/Producers
4.1.3 Distributors/Retailers/Wholesalers/E-Commerce
4.1.4 End Users
4.2 Porter’s Five Forces Analysis
4.2.1 Threat of New Entrants
4.2.2 Bargaining Power of Buyers
4.2.3 Bargaining Power of Suppliers
4.2.4 Threat of Substitutes
4.2.5 Internal Rivalry
5 Market Dynamics of the Global Gelatin Market
5.1 Introduction
5.2 Drivers
5.3 Restraints
5.4 Opportunities
5.5 Challenges
6. Global Gelatin Market, by Type
6.1 Introduction
6.2 Type A
6.2.1 Market Estimates & Forecast, 2018–2023
6.2.2 Market Estimates & Forecast, by Region, 2018–2023
6.3 Type B
6.3.1 Market Estimates & Forecast, 2018–2023
6.3.2 Market Estimates & Forecast, by Region, 2018–2023
7. Global Gelatin Market, by Source
7.1 Introduction
7.2 Swine Skin
7.2.1 Market Estimates & Forecast, 2017–2023
7.2.2 Market Estimates & Forecast, by Region, 2017–2023
7.3 Bovine Skin
7.3.1 Market Estimates & Forecast, 2018–2023
7.3.2 Market Estimates & Forecast, by Region, 2018–2023
7.4 Animal Bones
7.4.1 Market Estimates & Forecast, 2018–2023
7.4.2 Market Estimates & Forecast, by Region, 2018–2023
7.5 Others
7.5.1 Market Estimates & Forecast, 2018–2023
7.5.2 Market Estimates & Forecast, by Region, 2018–2023
8. Global Gelatin Market, by Application
8.1 Introduction
8.2 Food & Beverage
8.2.1 Market Estimates & Forecast, 2017–2023
8.2.2 Market Estimates & Forecast, by Region, 2017–2023
8.2.3 Bakery & Confectionery
8.2.3.1 Market Estimates & Forecast, 2018–2023
8.2.3.2 Market Estimates & Forecast, by Region, 2018–2023
8.2.4 Dairy & Frozen Desserts
8.2.4.1 Market Estimates & Forecast, 2018–2023
8.2.4.2 Market Estimates & Forecast, by Region, 2018–2023
8.2.5 Beverages
8.2.5.1 Market Estimates & Forecast, 2018–2023
8.2.5.2 Market Estimates & Forecast, by Region, 2018–2023
8.2.6 Sweet & Savory Snacks
8.2.6.1 Market Estimates & Forecast, 2018–2023
8.2.6.2 Market Estimates & Forecast, by Region, 2018–2023
8.2.7 Others
8.2.7.1 Market Estimates & Forecast, 2018–2023
8.2.7.2 Market Estimates & Forecast, by Region, 2018–2023
8.3 Pharmaceuticals & Nutraceuticals
8.3.1 Market Estimates & Forecast, 2017–2023
8.3.2 Market Estimates & Forecast, by Region, 2017–2023
8.4 Personal Care
8.4.1 Market Estimates & Forecast, 2017–2023
8.4.2 Market Estimates & Forecast, by Region, 2017–2023
8.5 Others
8.5.1 Market Estimates & Forecast, 2017–2023
8.5.2 Market Estimates & Forecast, by Region, 2017–2023
10. Global Gelatin Market, by Region
10.1 Introduction
10.2 North America
10.2.1 Market Estimates & Forecast, 2018–2023
10.2.2 Market Estimates & Forecast, by Type, 2018–2023
10.2.3 Market Estimates & Forecast, by Source, 2018–2023
10.2.4 Market Estimates & Forecast, by Application, 2018–2023
10.2.5 US
10.2.5.1 Market Estimates & Forecast, 2018–2023
10.2.5.2 Market Estimates & Forecast, by Type, 2018–2023
10.2.5.3 Market Estimates & Forecast, by Source, 2018–2023
10.2.5.4 Market Estimates & Forecast, by Application, 2018–2023
10.2.6 Canada
10.2.6.1 Market Estimates & Forecast, 2018–2023
10.2.6.2 Market Estimates & Forecast, by Type, 2018–2023
10.2.6.3 Market Estimates & Forecast, by Source, 2018–2023
10.2.6.4 Market Estimates & Forecast, by Application, 2018–2023
10.2.7 Mexico
10.2.7.1 Market Estimates & Forecast, 2018–2023
10.2.7.2 Market Estimates & Forecast, by Type, 2018–2023
10.2.7.3 Market Estimates & Forecast, by Source, 2018–2023
10.2.7.4 Market Estimates & Forecast, by Application, 2018–2023
10.3 Europe
10.3.1 Market Estimates & Forecast, 2018–2023
10.3.2 Market Estimates & Forecast, by Type, 2018–2023
10.3.3 Market Estimates & Forecast, by Source, 2018–2023
10.3.4 Market Estimates & Forecast, by Application, 2018–2023
10.3.5 Germany
10.3.5.1 Market Estimates & Forecast, 2018–2023
10.3.5.2 Market Estimates & Forecast, by Type, 2018–2023
10.3.5.3 Market Estimates & Forecast, by Source, 2018–2023
10.3.5.4 Market Estimates & Forecast, by Application, 2018–2023
10.3.6 France
10.3.6.1 Market Estimates & Forecast, 2018–2023
10.3.6.2 Market Estimates & Forecast, by Type, 2018–2023
10.3.6.3 Market Estimates & Forecast, by Source, 2018–2023
10.3.6.4 Market Estimates & Forecast, by Application, 2018–2023
10.3.7 Italy
10.3.7.1 Market Estimates & Forecast, 2018–2023
10.3.7.2 Market Estimates & Forecast, by Type, 2018–2023
10.3.7.3 Market Estimates & Forecast, by Source, 2018–2023
10.3.7.4 Market Estimates & Forecast, by Application, 2018–2023
10.3.8 Spain
10.3.8.1 Market Estimates & Forecast, 2018–2023
10.3.7.2 Market Estimates & Forecast, by Type, 2018–2023
10.3.8.3 Market Estimates & Forecast, by Source, 2018–2023
10.3.8.4 Market Estimates & Forecast, by Application, 2018–2023
10.3.9 UK
10.3.9.1 Market Estimates & Forecast, 2018–2023
10.3.9.2 Market Estimates & Forecast, by Type, 2018–2023
10.3.9.3 Market Estimates & Forecast, by Source, 2018–2023
10.3.9.4 Market Estimates & Forecast, by Application, 2018–2023
10.3.10 Rest of Europe
10.3.10.1 Market Estimates & Forecast, 2018–2023
10.3.10.2 Market Estimates & Forecast, by Type, 2018–2023
10.3.10.3 Market Estimates & Forecast, by Source, 2018–2023
10.3.10.4 Market Estimates & Forecast, by Application, 2018–2023
10.4 Asia-Pacific
10.4.1 Market Estimates & Forecast, 2018–2023
10.4.2 Market Estimates & Forecast, by Type, 2018–2023
10.4.3 Market Estimates & Forecast, by Source, 2018–2023
10.4.4 Market Estimates & Forecast, by Application, 2018–2023
10.4.5 China
10.4.5.1 Market Estimates & Forecast, 2018–2023
10.4.5.2 Market Estimates & Forecast, by Type, 2018–2023
10.4.5.3 Market Estimates & Forecast, by Source, 2018–2023
10.4.5.4 Market Estimates & Forecast, by Application, 2018–2023
10.4.6 India
10.4.6.1 Market Estimates & Forecast, 2018–2023
10.4.6.2 Market Estimates & Forecast, by Type, 2018–2023
10.4.6.3 Market Estimates & Forecast, by Source, 2018–2023
10.4.6.4 Market Estimates & Forecast, by Application, 2018–2023
10.4.7 Japan
10.4.7.1 Market Estimates & Forecast, 2018–2023
10.4.7.2 Market Estimates & Forecast, by Type, 2018–2023
10.4.7.3 Market Estimates & Forecast, by Source, 2018–2023
10.4.7.4 Market Estimates & Forecast, by Application, 2018–2023
10.4.8 Australia & New Zealand
10.4.8.1 Market Estimates & Forecast, 2018–2023
10.4.8.2 Market Estimates & Forecast, by Type, 2018–2023
10.4.8.3 Market Estimates & Forecast, by Source, 2018–2023
10.4.8.4 Market Estimates & Forecast, by Application, 2018–2023
10.4.9 Rest of Asia-Pacific
10.4.9.1 Market Estimates & Forecast, 2018–2023
10.4.9.2 Market Estimates & Forecast, by Type, 2018–2023
10.4.9.3 Market Estimates & Forecast, by Source, 2018–2023
10.4.9.4 Market Estimates & Forecast, by Application, 2018–2023
10.5 Rest of the World (RoW)
10.5.1 Market Estimates & Forecast, 2018–2023
10.5.2 Market Estimates & Forecast, by Type, 2018–2023
10.5.3 Market Estimates & Forecast, by Source, 2018–2023
10.5.4 Market Estimates & Forecast, by Application, 2018–2023
10.5.5 South America
10.5.5.1 Market Estimates & Forecast, 2018–2023
10.5.5.2 Market Estimates & Forecast, by Type, 2018–2023
10.5.5.3 Market Estimates & Forecast, by Source, 2018–2023
10.5.5.4 Market Estimates & Forecast, by Application, 2018–2023
10.5.6 Middle East
10.5.6.1 Market Estimates & Forecast, 2018–2023
10.5.6.2 Market Estimates & Forecast, by Type, 2018–2023
10.5.6.3 Market Estimates & Forecast, by Source, 2018–2023
10.5.6.4 Market Estimates & Forecast, by Application, 2018–2023
10.5.7 Africa
10.5.7.1 Market Estimates & Forecast, 2018–2023
10.5.7.2 Market Estimates & Forecast, by Type, 2018–2023
10.5.7.3 Market Estimates & Forecast, by Source, 2018–2023
10.5.7.4 Market Estimates & Forecast, by Application, 2018–2023
11. Company Landscape
11.1 Introduction
11.2 Market Strategy
11.3 Key Development Analysis
(Expansions/Mergers and Acquisitions/Joint Ventures/New Product Developments/Agreements/Investments
12. Company Profiles
12.1 Darling Ingredients
12.1.1 Company Overview
12.1.2 Financial Updates
12.1.3 Product/Business Segment Overview
12.1.4 Strategy
12.1.5 Key Developments
12.1.6 SWOT Analysis
12.2 Tessenderlo Group
12.2.1 Company Overview
12.2.2 Financial Updates
12.2.3 Product/Business Segment Overview
12.2.4 Strategy
12.2.5 Key Developments
12.2.6 SWOT Analysis
12.3 Nitta Gelatin
12.3.1 Company Overview
12.3.2 Financial Updates
12.3.3 Product/Business Segment Overview
12.3.4 Strategy
12.3.5 Key Developments
12.3.6 SWOT Analysis
12.4 Gelita
12.4.1 Company Overview
12.4.2 Financial Updates
12.4.3 Product/Business Segment Overview
12.4.4 Strategy
12.4.5 Key Developments
12.4.6 SWOT Analysis
12.5 Weishardt
12.5.1 Company Overview
12.5.2 Financial Updates
12.5.3 Product/Business Segment Overview
12.5.4 Strategy
12.5.5 Key Developments
12.5.6 SWOT Analysis
12.6 Italgelatine
12.6.1 Company Overview
12.6.2 Financial Updates
12.6.3 Product/Business Segment Overview
12.6.4 Strategy
12.6.5 Key Developments
12.6.6 SWOT Analysis
12.7 Lapi Gelatine
12.7.1 Company Overview
12.7.2 Financial Updates
12.7.3 Product/Business Segment Overview
12.7.4 Strategy
12.7.5 Key Developments
12.7.6 SWOT Analysis
12.8 Gelnex
12.8.1 Company Overview
12.8.2 Financial Updates
12.8.3 Product/Business Segment Overview
12.8.4 Strategy
12.8.5 Key Developments
12.8.6 SWOT Analysis
12.9 Junca Gelatines
12.9.1 Company Overview
12.9.2 Financial Updates
12.9.3 Product/Business Segment Overview
12.9.4 Strategy
12.9.5 Key Developments
12.9.6 SWOT Analysis
12.10 Trobas Gelatine
12.10.1 Company Overview
12.10.2 Financial Updates
12.10.3 Product/Business Segment Overview
12.10.4 Strategy
12.10.5 Key Developments
12.10.6 SWOT Analysis
13. Conclusion
LIST OF TABLES
Table 1 Global Gelatin Market, by Region, 2018–2023 (USD Million)
Table 2 Global Gelatin Market, by Type, 2018–2023 (USD Million)
Table 3 Global Gelatin Market, by Application, 2018–2023 (USD Million)
Table 4 Global Gelatin Market, by Source, 2018–2023 (USD Million)
Table 5 North America: Gelatin Market, by Country, 2018–2023 (USD Million)
Table 6 North America: Gelatin Market, by Type, 2018–2023 (USD Million)
Table 7 North America: Gelatin Market, by Application, 2018–2023 (USD Million)
Table 8 North America: Gelatin Market, by Source, 2018–2023 (USD Million)
Table 9 US: Gelatin Market, by Type, 2018–2023 (USD Million)
Table 10 US: Gelatin Market, by Application, 2018–2023 (USD Million)
Table 11 US: Gelatin Market, by Source, 2018–2023 (USD Million)
Table 12 Canada: Gelatin Market, by Type, 2018–2023 (USD Million)
Table 13 Canada: Gelatin Market, by Application, 2018–2023 (USD Million)
Table 14 Canada: Gelatin Market, by Source, 2018–2023 (USD Million)
Table 15 Mexico: Gelatin Market, by Type, 2018–2023 (USD Million)
Table 16 Mexico: Gelatin Market, by Application, 2018–2023 (USD Million)
Table 17 Mexico: Gelatin Market, by Source, 2018–2023 (USD Million)
Table 18 Europe: Gelatin Market, by Country, 2018–2023 (USD Million)
Table 19 Europe: Gelatin Market, by Type, 2018–2023 (USD Million)
Table 20 Europe: Gelatin Market, by Application, 2018–2023 (USD Million)
Table 21 Europe: Gelatin Market, by Source, 2018–2023 (USD Million)
Table 22 Germany: Gelatin Market, by Type, 2018–2023 (USD Million)
Table 23 Germany: Gelatin Market, by Application, 2018–2023 (USD Million)
Table 24 Germany: Gelatin Market, by Source, 2018–2023 (USD Million)
Table 25 France: Gelatin Market, by Type, 2018–2023 (USD Million)
Table 26 France: Gelatin Market, by Application, 2018–2023 (USD Million)
Table 27 France: Gelatin Market, by Source, 2018–2023 (USD Million)
Table 28 Italy: Gelatin Market, by Type, 2018–2023 (USD Million)
Table 29 Italy: Gelatin Market, by Application, 2018–2023 (USD Million)
Table 30 Italy: Gelatin Market, by Source, 2018–2023 (USD Million)
Table 31 Spain: Gelatin Market, by Type, 2018–2023 (USD Million)
Table 32 Spain: Gelatin Market, by Application, 2018–2023 (USD Million)
Table 33 Spain: Gelatin Market, by Source, 2018–2023 (USD Million)
Table 34 UK: Gelatin Market, by Type, 2018–2023 (USD Million)
Table 35 UK: Gelatin Market, by Application, 2018–2023 (USD Million)
Table 36 UK: Gelatin Market, by Source, 2018–2023 (USD Million)
Table 37 Rest of Europe: Gelatin Market, by Type, 2018–2023 (USD Million)
Table 38 Rest of Europe: Gelatin Market, by Application, 2018–2023 (USD Million)
Table 39 Rest of Europe: Gelatin Market, by Source, 2018–2023 (USD Million)
Table 40 Asia-Pacific: Gelatin Market, by Country, 2018–2023 (USD Million)
Table 41 Asia-Pacific: Gelatin Market, by Type, 2018–2023 (USD Million)
Table 42 Asia-Pacific: Gelatin Market, by Application, 2018–2023 (USD Million)
Table 43 Asia-Pacific: Gelatin Market, by Source, 2018–2023 (USD Million)
Table 44 China: Gelatin Market, by Type, 2018–2023 (USD Million)
Table 45 China: Gelatin Market, by Application, 2018–2023 (USD Million)
Table 46 China: Gelatin Market, by Source, 2018–2023 (USD Million)
Table 47 India: Gelatin Market, by Type, 2018–2023 (USD Million)
Table 48 India: Gelatin Market, by Application, 2018–2023 (USD Million)
Table 49 India: Gelatin Market, by Source, 2018–2023 (USD Million)
Table 50 Japan: Gelatin Market, by Type, 2018–2023 (USD Million)
Table 51 Japan: Gelatin Market, by Application, 2018–2023 (USD Million)
Table 52 Japan: Gelatin Market, by Source, 2018–2023 (USD Million)
Table 53 Australia & New Zealand: Gelatin Market, by Type, 2018–2023 (USD Million)
Table 54 Australia & New Zealand: Gelatin Market, by Application, 2018–2023 (USD Million)
Table 55 Australia & New Zealand: Gelatin Market, by Source, 2018–2023 (USD Million)
Table 56 Rest of Asia-Pacific: Gelatin Market, by Type, 2018–2023 (USD Million)
Table 57 Rest of Asia-Pacific: Gelatin Market, by Application, 2018–2023 (USD Million)
Table 58 Rest of Asia-Pacific: Gelatin Market, by Source, 2018–2023 (USD Million)
Table 59 Rest of the World (RoW): Gelatin Market, by Country, 2018–2023 (USD Million)
Table 60 Rest of the World (RoW): Gelatin Market, by Type, 2018–2023 (USD Million)
Table 61 Rest of the World (RoW): Gelatin Market, by Application, 2018–2023 (USD Million)
Table 62 Rest of the World (RoW): Gelatin Market, by Source, 2018–2023 (USD Million)
Table 63 South America: Gelatin Market, by Type, 2018–2023 (USD Million)
Table 64 South America: Gelatin Market, by Application, 2018–2023 (USD Million)
Table 65 South America: Gelatin Market, by Source, 2018–2023 (USD Million)
Table 66 Middle East: Gelatin Market, by Type, 2018–2023 (USD Million)
Table 67 Middle East: Gelatin Market, by Application, 2018–2023 (USD Million)
Table 68 Middle East: Gelatin Market, by Source, 2018–2023 (USD Million)
Table 69 Africa: Gelatin Market, by Type, 2018–2023 (USD Million)
Table 70 Africa: Gelatin Market, by Application, 2018–2023 (USD Million)
Table 71 Africa: Gelatin Market, by Source, 2018–2023 (USD Million)
LIST OF FIGURES
FIGURE 1 Global Gelatin Market Segmentation
FIGURE 2 Forecast Research Methodology
FIGURE 3 Five Forces Analysis of the Global Gelatin Market
FIGURE 4 Value Chain of the Global Gelatin Market
FIGURE 5 Share of the Global Gelatin Market in 2018, by Country (%)
FIGURE 6 Global Gelatin Market, by Region, 2018–2023,
FIGURE 7 Global Gelatin Market Size, by Type, 2018
FIGURE 8 Share of the Global Gelatin Market, by Type, 2018–2023 (%)
FIGURE 9 Global Gelatin Market Size, by Application, 2018
FIGURE 10 Share of the Global Gelatin Market, by Application, 2018–2023 (%)
FIGURE 11 Global Gelatin Market Size, by Source, 2018
FIGURE 12 Share of the Global Gelatin Market, by Source, 2018–2023 (%)