Request Free Sample ×

Kindly complete the form below to receive a free sample of this Report

* Please use a valid business email

Leading companies partner with us for data-driven Insights

clients tt-cursor
Hero Background

GCC E Sports Market

ID: MRFR/ICT/44869-HCR
200 Pages
Apoorva Priyadarshi
Last Updated: April 06, 2026

GCC E-sports Market Size, Share and Research Report: By Revenue Stream (Sponsorship, Media Rights, Merchandise and Tickets, Publisher Fees, Digital Platforms, Streaming) and By Genres (Player vs. player (PVP), First Person Shooter, Sports Games, Real-Time Strategy, Multiplayer Online Battle Arena, Fighting)- Industry Forecast to 2035

Share:
Download PDF ×

We do not share your information with anyone. However, we may send you emails based on your report interest from time to time. You may contact us at any time to opt-out.

GCC E Sports Market Infographic
Purchase Options
  1. 1 SECTION I: EXECUTIVE SUMMARY AND KEY HIGHLIGHTS
    1. 1.1 EXECUTIVE SUMMARY
      1. 1.1.1 Market Overview
      2. 1.1.2 Key Findings
      3. 1.1.3 Market Segmentation
      4. 1.1.4 Competitive Landscape
      5. 1.1.5 Challenges and Opportunities
      6. 1.1.6 Future Outlook
  2. 2 SECTION II: SCOPING, METHODOLOGY AND MARKET STRUCTURE
    1. 2.1 MARKET INTRODUCTION
      1. 2.1.1 Definition
      2. 2.1.2 Scope of the study
        1. 2.1.2.1 Research Objective
        2. 2.1.2.2 Assumption
        3. 2.1.2.3 Limitations
    2. 2.2 RESEARCH METHODOLOGY
      1. 2.2.1 Overview
      2. 2.2.2 Data Mining
      3. 2.2.3 Secondary Research
      4. 2.2.4 Primary Research
        1. 2.2.4.1 Primary Interviews and Information Gathering Process
        2. 2.2.4.2 Breakdown of Primary Respondents
      5. 2.2.5 Forecasting Model
      6. 2.2.6 Market Size Estimation
        1. 2.2.6.1 Bottom-Up Approach
        2. 2.2.6.2 Top-Down Approach
      7. 2.2.7 Data Triangulation
      8. 2.2.8 Validation
  3. 3 SECTION III: QUALITATIVE ANALYSIS
    1. 3.1 MARKET DYNAMICS
      1. 3.1.1 Overview
      2. 3.1.2 Drivers
      3. 3.1.3 Restraints
      4. 3.1.4 Opportunities
    2. 3.2 MARKET FACTOR ANALYSIS
      1. 3.2.1 Value chain Analysis
      2. 3.2.2 Porter's Five Forces Analysis
        1. 3.2.2.1 Bargaining Power of Suppliers
        2. 3.2.2.2 Bargaining Power of Buyers
        3. 3.2.2.3 Threat of New Entrants
        4. 3.2.2.4 Threat of Substitutes
        5. 3.2.2.5 Intensity of Rivalry
      3. 3.2.3 COVID-19 Impact Analysis
        1. 3.2.3.1 Market Impact Analysis
        2. 3.2.3.2 Regional Impact
        3. 3.2.3.3 Opportunity and Threat Analysis
  4. 4 SECTION IV: QUANTITATIVE ANALYSIS
    1. 4.1 Information and Communications Technology, BY Game Type (USD Billion)
      1. 4.1.1 First-Person Shooter
      2. 4.1.2 Multiplayer Online Battle Arena
      3. 4.1.3 Real-Time Strategy
      4. 4.1.4 Sports
      5. 4.1.5 Battle Royale
    2. 4.2 Information and Communications Technology, BY Revenue Source (USD Billion)
      1. 4.2.1 Sponsorship
      2. 4.2.2 Media Rights
      3. 4.2.3 Merchandising
      4. 4.2.4 Ticket Sales
      5. 4.2.5 In-Game Purchases
    3. 4.3 Information and Communications Technology, BY Platform (USD Billion)
      1. 4.3.1 PC
      2. 4.3.2 Console
      3. 4.3.3 Mobile
    4. 4.4 Information and Communications Technology, BY Participant Type (USD Billion)
      1. 4.4.1 Professional Players
      2. 4.4.2 Amateur Players
      3. 4.4.3 Spectators
  5. 5 SECTION V: COMPETITIVE ANALYSIS
    1. 5.1 Competitive Landscape
      1. 5.1.1 Overview
      2. 5.1.2 Competitive Analysis
      3. 5.1.3 Market share Analysis
      4. 5.1.4 Major Growth Strategy in the Information and Communications Technology
      5. 5.1.5 Competitive Benchmarking
      6. 5.1.6 Leading Players in Terms of Number of Developments in the Information and Communications Technology
      7. 5.1.7 Key developments and growth strategies
        1. 5.1.7.1 New Product Launch/Service Deployment
        2. 5.1.7.2 Merger & Acquisitions
        3. 5.1.7.3 Joint Ventures
      8. 5.1.8 Major Players Financial Matrix
        1. 5.1.8.1 Sales and Operating Income
        2. 5.1.8.2 Major Players R&D Expenditure. 2023
    2. 5.2 Company Profiles
      1. 5.2.1 Tencent (CN)
        1. 5.2.1.1 Financial Overview
        2. 5.2.1.2 Products Offered
        3. 5.2.1.3 Key Developments
        4. 5.2.1.4 SWOT Analysis
        5. 5.2.1.5 Key Strategies
      2. 5.2.2 Activision Blizzard (US)
        1. 5.2.2.1 Financial Overview
        2. 5.2.2.2 Products Offered
        3. 5.2.2.3 Key Developments
        4. 5.2.2.4 SWOT Analysis
        5. 5.2.2.5 Key Strategies
      3. 5.2.3 Riot Games (US)
        1. 5.2.3.1 Financial Overview
        2. 5.2.3.2 Products Offered
        3. 5.2.3.3 Key Developments
        4. 5.2.3.4 SWOT Analysis
        5. 5.2.3.5 Key Strategies
      4. 5.2.4 Epic Games (US)
        1. 5.2.4.1 Financial Overview
        2. 5.2.4.2 Products Offered
        3. 5.2.4.3 Key Developments
        4. 5.2.4.4 SWOT Analysis
        5. 5.2.4.5 Key Strategies
      5. 5.2.5 Valve Corporation (US)
        1. 5.2.5.1 Financial Overview
        2. 5.2.5.2 Products Offered
        3. 5.2.5.3 Key Developments
        4. 5.2.5.4 SWOT Analysis
        5. 5.2.5.5 Key Strategies
      6. 5.2.6 Nexon (KR)
        1. 5.2.6.1 Financial Overview
        2. 5.2.6.2 Products Offered
        3. 5.2.6.3 Key Developments
        4. 5.2.6.4 SWOT Analysis
        5. 5.2.6.5 Key Strategies
      7. 5.2.7 Bandai Namco Entertainment (JP)
        1. 5.2.7.1 Financial Overview
        2. 5.2.7.2 Products Offered
        3. 5.2.7.3 Key Developments
        4. 5.2.7.4 SWOT Analysis
        5. 5.2.7.5 Key Strategies
      8. 5.2.8 Electronic Arts (US)
        1. 5.2.8.1 Financial Overview
        2. 5.2.8.2 Products Offered
        3. 5.2.8.3 Key Developments
        4. 5.2.8.4 SWOT Analysis
        5. 5.2.8.5 Key Strategies
      9. 5.2.9 Ubisoft (FR)
        1. 5.2.9.1 Financial Overview
        2. 5.2.9.2 Products Offered
        3. 5.2.9.3 Key Developments
        4. 5.2.9.4 SWOT Analysis
        5. 5.2.9.5 Key Strategies
    3. 5.3 Appendix
      1. 5.3.1 References
      2. 5.3.2 Related Reports
  6. 6 LIST OF FIGURES
    1. 6.1 MARKET SYNOPSIS
    2. 6.2 GCC MARKET ANALYSIS BY GAME TYPE
    3. 6.3 GCC MARKET ANALYSIS BY REVENUE SOURCE
    4. 6.4 GCC MARKET ANALYSIS BY PLATFORM
    5. 6.5 GCC MARKET ANALYSIS BY PARTICIPANT TYPE
    6. 6.6 KEY BUYING CRITERIA OF INFORMATION AND COMMUNICATIONS TECHNOLOGY
    7. 6.7 RESEARCH PROCESS OF MRFR
    8. 6.8 DRO ANALYSIS OF INFORMATION AND COMMUNICATIONS TECHNOLOGY
    9. 6.9 DRIVERS IMPACT ANALYSIS: INFORMATION AND COMMUNICATIONS TECHNOLOGY
    10. 6.10 RESTRAINTS IMPACT ANALYSIS: INFORMATION AND COMMUNICATIONS TECHNOLOGY
    11. 6.11 SUPPLY / VALUE CHAIN: INFORMATION AND COMMUNICATIONS TECHNOLOGY
    12. 6.12 INFORMATION AND COMMUNICATIONS TECHNOLOGY, BY GAME TYPE, 2024 (% SHARE)
    13. 6.13 INFORMATION AND COMMUNICATIONS TECHNOLOGY, BY GAME TYPE, 2024 TO 2035 (USD Billion)
    14. 6.14 INFORMATION AND COMMUNICATIONS TECHNOLOGY, BY REVENUE SOURCE, 2024 (% SHARE)
    15. 6.15 INFORMATION AND COMMUNICATIONS TECHNOLOGY, BY REVENUE SOURCE, 2024 TO 2035 (USD Billion)
    16. 6.16 INFORMATION AND COMMUNICATIONS TECHNOLOGY, BY PLATFORM, 2024 (% SHARE)
    17. 6.17 INFORMATION AND COMMUNICATIONS TECHNOLOGY, BY PLATFORM, 2024 TO 2035 (USD Billion)
    18. 6.18 INFORMATION AND COMMUNICATIONS TECHNOLOGY, BY PARTICIPANT TYPE, 2024 (% SHARE)
    19. 6.19 INFORMATION AND COMMUNICATIONS TECHNOLOGY, BY PARTICIPANT TYPE, 2024 TO 2035 (USD Billion)
    20. 6.20 BENCHMARKING OF MAJOR COMPETITORS
  7. 7 LIST OF TABLES
    1. 7.1 LIST OF ASSUMPTIONS
  8. 7.1.1
    1. 7.2 GCC MARKET SIZE ESTIMATES; FORECAST
      1. 7.2.1 BY GAME TYPE, 2025-2035 (USD Billion)
      2. 7.2.2 BY REVENUE SOURCE, 2025-2035 (USD Billion)
      3. 7.2.3 BY PLATFORM, 2025-2035 (USD Billion)
      4. 7.2.4 BY PARTICIPANT TYPE, 2025-2035 (USD Billion)
    2. 7.3 PRODUCT LAUNCH/PRODUCT DEVELOPMENT/APPROVAL
  9. 7.3.1
    1. 7.4 ACQUISITION/PARTNERSHIP
  10. 7.4.1

GCC Information and Communications Technology Market Segmentation

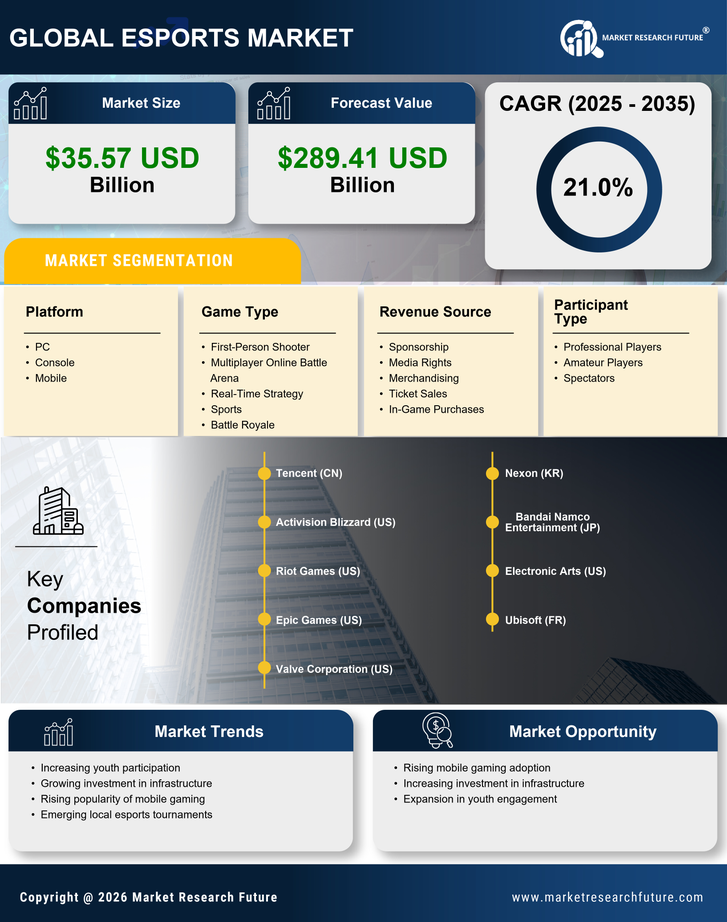
Information and Communications Technology By Game Type (USD Billion, 2025-2035)

  • First-Person Shooter
  • Multiplayer Online Battle Arena
  • Real-Time Strategy
  • Sports
  • Battle Royale

Information and Communications Technology By Revenue Source (USD Billion, 2025-2035)

  • Sponsorship
  • Media Rights
  • Merchandising
  • Ticket Sales
  • In-Game Purchases

Information and Communications Technology By Platform (USD Billion, 2025-2035)

  • PC
  • Console
  • Mobile

Information and Communications Technology By Participant Type (USD Billion, 2025-2035)

  • Professional Players
  • Amateur Players
  • Spectators

Compare Licence

×
Features License Type
Single User Multiuser License Enterprise User
Price $4,950 $5,950 $7,250
Maximum User Access Limit 1 User Upto 10 Users Unrestricted Access Throughout the Organization
Free Customization
Direct Access to Analyst
Deliverable Format
Platform Access
Discount on Next Purchase 10% 15% 15%
Printable Versions