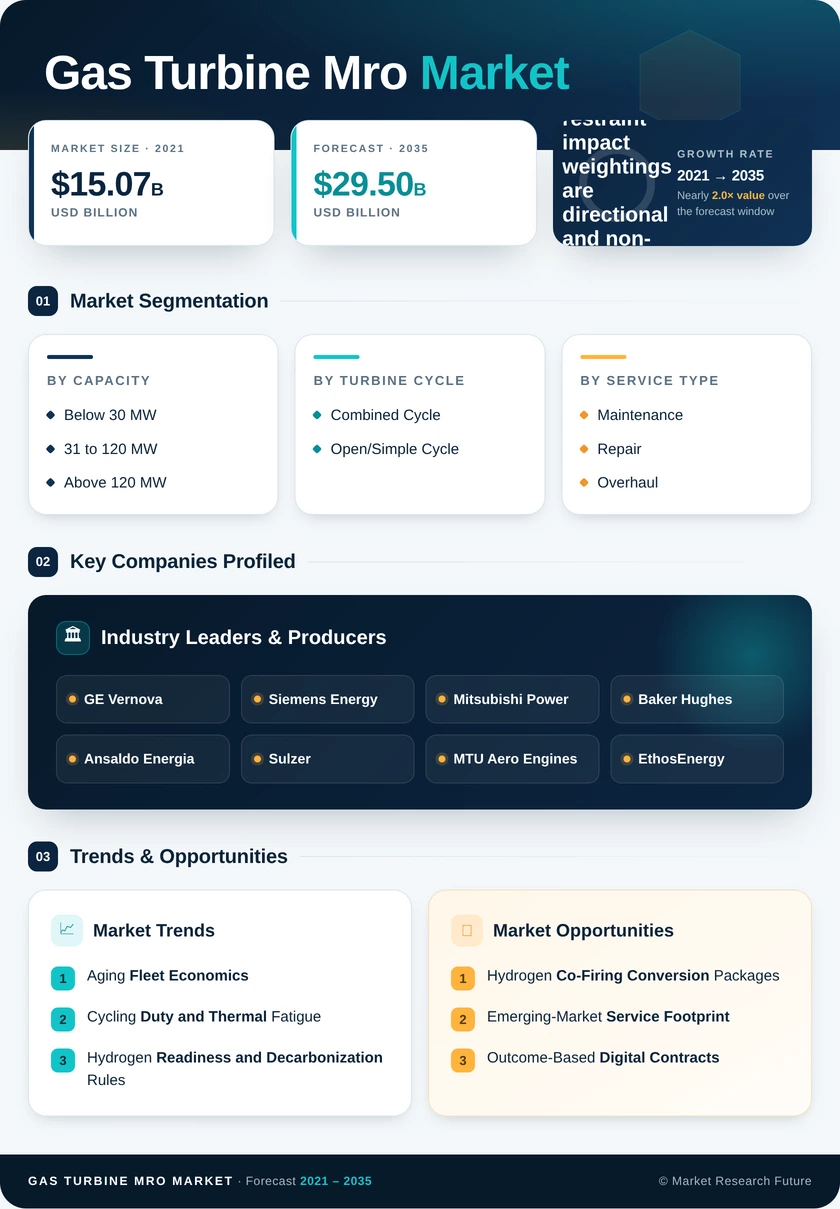
Gas Turbine MRO Market (2026 - 2035)

ID: MRFR/EnP/33240-HCR 100 Pages Chitranshi Jaiswal Last Updated: October 17, 2026
Gas Turbine MRO Market Research Report By Capacity (Below 30 MW, 31 to 120 MW, Above 120 MW), By Turbine Cycle (Combined Cycle, Open/Simple Cycle), By Service Type (Maintenance, Repair, Overhaul), By End-User Industry (Power Generation, Oil and Gas, Industrial and Other) - Forecast to 2035
Gas Turbine MRO Market
Market Size
Forecast Period2026-2035
CAGR (2026-2035)5.22%
2025 Market SizeUSD 17.79 Billion
2035 Market SizeUSD 29.50 Billion
Key Players
GE Vernova
Siemens Energy
Mitsubishi Power
Baker Hughes
Ansaldo Energia
Sulzer
Opportunities
  • Hydrogen Co-Firing Conversion Packages
  • Emerging-Market Service Footprint
  • Outcome-Based Digital Contracts
  1. 1 Market Summary | |
    1. 1.1 Study Assumptions & Market Definition | |
    2. 1.2 Scope of the Study | |
    3. 1.3 Research Methodology | |
  2. 2 Key Report Takeaways | |
    1. 2.1 By Capacity | |
    2. 2.2 By Sector | |
    3. 2.3 By Geography | |
  3. 3 Market Size & Forecast (2021–2035) | |
    1. 3.1 Historical Market Size (2021–2025) | |
    2. 3.2 Current & Forecast Market Size (2026–2035) | |
    3. 3.3 Year-over-Year Growth Analysis | |
  4. 4 Driver Impact Analysis | |
    1. 4.1 Aging Fleet Economics | |
    2. 4.2 Cycling Duty and Thermal Fatigue | |
    3. 4.3 Hydrogen Readiness and Decarbonization Rules | |
    4. 4.4 Digital Diagnostics Penetration | |
  5. 5 Restraints Impact Analysis | |
    1. 5.1 Hot-Gas-Path Material Bottlenecks | |
    2. 5.2 Workforce Scarcity | |
    3. 5.3 Aftermarket Access Friction | |
  6. 6 Opportunities | |
    1. 6.1 Hydrogen Co-Firing Conversion Packages | |
    2. 6.2 Emerging-Market Service Footprint | |
    3. 6.3 Outcome-Based Digital Contracts | |
    4. 6.4 Additive Manufacturing for Legacy Parts | |
    5. 6.5 Mechanical Drive in LNG Expansion | |
    6. 6.6 Industry Value Chain Analysis | |
    7. 6.7 Porter's Five Forces Analysis | |
  7. 7 Regional Market Share & Country-Level Analysis | |
    1. 7.1 North America | | |
      1. 7.1.1 US | | |
      2. 7.1.2 Canada | | |
      3. 7.1.3 Mexico | |
    2. 7.2 Europe | | |
      1. 7.2.1 Germany | | |
      2. 7.2.2 UK | | |
      3. 7.2.3 France | | |
      4. 7.2.4 Italy | | |
      5. 7.2.5 Spain | | |
      6. 7.2.6 Nordic Countries | | |
      7. 7.2.7 Russia | | |
      8. 7.2.8 Rest of Europe | |
    3. 7.3 Asia-Pacific | | |
      1. 7.3.1 China | | |
      2. 7.3.2 India | | |
      3. 7.3.3 Japan | | |
      4. 7.3.4 South Korea | | |
      5. 7.3.5 ASEAN | | |
      6. 7.3.6 Rest of Asia-Pacific | |
    4. 7.4 South America | | |
      1. 7.4.1 Brazil | | |
      2. 7.4.2 Argentina | | |
      3. 7.4.3 Rest of South America | |
    5. 7.5 Middle East & Africa | | |
      1. 7.5.1 Saudi Arabia | | |
      2. 7.5.2 UAE | | |
      3. 7.5.3 South Africa | | |
      4. 7.5.4 Egypt | | |
      5. 7.5.5 Rest of MEA | |
  8. 8 Future Outlook (2026–2035) | |
    1. 8.1 Autonomous Outage Planning | |
    2. 8.2 Service Platform Economics | |
    3. 8.3 Firming the Electrification Supercycle | |
    4. 8.4 Emissions Reporting and Asset Disclosure | |
  9. 9 Segmentation Analysis | |
    1. 9.1 By Capacity | | |
      1. 9.1.1 Below 30 MW | | |
      2. 9.1.2 31 to 120 MW | | |
      3. 9.1.3 Above 120 MW | |
    2. 9.2 By Turbine Cycle | | |
      1. 9.2.1 Combined Cycle | | |
      2. 9.2.2 Open/Simple Cycle | |
    3. 9.3 By Service Type | | |
      1. 9.3.1 Maintenance | | |
      2. 9.3.2 Repair | | |
      3. 9.3.3 Overhaul | |
    4. 9.4 By End-User Industry | | |
      1. 9.4.1 Power Generation | | |
      2. 9.4.2 Oil and Gas | | |
      3. 9.4.3 Industrial and Other | |
  10. 10 Competitive Landscape | |
    1. 10.1 Market Share Analysis (2026) | |
    2. 10.2 Competitive Benchmarking Matrix | |
    3. 10.3 Company Profiles | | |
      1. 10.3.1 GE Vernova | | |
      2. 10.3.2 Siemens Energy | | |
      3. 10.3.3 Mitsubishi Power | | |
      4. 10.3.4 Baker Hughes | | |
      5. 10.3.5 Ansaldo Energia | | |
      6. 10.3.6 Sulzer | | |
      7. 10.3.7 MTU Aero Engines | | |
      8. 10.3.8 EthosEnergy | | |
      9. 10.3.9 Wood Group | | |
      10. 10.3.10 Chromalloy | | |
      11. 10.3.11 PSM (Hanwha) | |
  11. 11 Recent News & Developments | |
  12. 12 Report Scope & Methodology | |
    1. 12.1 Study Period & Base Year | |
    2. 12.2 Data Sources & Citations | |
    3. 12.3 Abbreviations | |
  13. 13 Detailed Sources & Citations | |
  14. 14 Frequently Asked Questions | | LIST OF TABLES | |
  15. TABLE 1 Global Gas Turbine MRO Market Size & Forecast, by Revenue (USD Billion), 2021–2035 | |
  16. TABLE 2 Global Gas Turbine MRO Market – Year-over-Year Growth Analysis, 2021–2035 | |
  17. TABLE 3 Driver Impact Analysis Matrix, 2026–2035 | |
  18. TABLE 4 Restraint Impact Analysis Matrix, 2026–2035 | |
  19. TABLE 5 Global Gas Turbine MRO Market Size, by Region, 2021–2035 (USD Billion) | |
  20. TABLE 6 North America Gas Turbine MRO Market Size, by Country, 2021–2035 (USD Billion) | |
  21. TABLE 7 Europe Gas Turbine MRO Market Size, by Country, 2021–2035 (USD Billion) | |
  22. TABLE 8 Asia-Pacific Gas Turbine MRO Market Size, by Country, 2021–2035 (USD Billion) | |
  23. TABLE 9 South America Gas Turbine MRO Market Size, by Country, 2021–2035 (USD Billion) | |
  24. TABLE 10 Middle East & Africa Gas Turbine MRO Market Size, by Country, 2021–2035 (USD Billion) | |
  25. TABLE 11 Global Gas Turbine MRO Market Size, by Capacity, 2021–2035 (USD Billion) | |
  26. TABLE 12 Global Gas Turbine MRO Market Size, by Turbine Cycle, 2021–2035 (USD Billion) | |
  27. TABLE 13 Global Gas Turbine MRO Market Size, by Service Type, 2021–2035 (USD Billion) | |
  28. TABLE 14 Global Gas Turbine MRO Market Size, by End-User Industry, 2021–2035 (USD Billion) | |
  29. TABLE 15 North America Gas Turbine MRO Market Size, by Capacity, 2021–2035 (USD Billion) | |
  30. TABLE 16 North America Gas Turbine MRO Market Size, by Service Type, 2021–2035 (USD Billion) | |
  31. TABLE 17 Europe Gas Turbine MRO Market Size, by Turbine Cycle, 2021–2035 (USD Billion) | |
  32. TABLE 18 Europe Gas Turbine MRO Market Size, by End-User Industry, 2021–2035 (USD Billion) | |
  33. TABLE 19 Asia-Pacific Gas Turbine MRO Market Size, by Capacity, 2021–2035 (USD Billion) | |
  34. TABLE 20 Asia-Pacific Gas Turbine MRO Market Size, by Service Type, 2021–2035 (USD Billion) | |
  35. TABLE 21 South America Gas Turbine MRO Market Size, by End-User Industry, 2021–2035 (USD Billion) | |
  36. TABLE 22 Middle East & Africa Gas Turbine MRO Market Size, by Service Type, 2021–2035 (USD Billion) | |
  37. TABLE 23 Competitive Benchmarking Matrix – Global Gas Turbine MRO Market, 2026 | |
  38. TABLE 24 Company Profiles – Key Players, Global Gas Turbine MRO Market | |
  39. TABLE 25 Recent Developments & Strategic Announcements, 2023–2025 | |
  40. TABLE 26 Report Scope & Methodology Summary | |
  41. TABLE 27 Detailed Sources & Citations Index | | LIST OF FIGURES | |
  42. FIGURE 1 Global Gas Turbine MRO Market – Market Dynamics Overview (Drivers, Restraints, Opportunities) | |
  43. FIGURE 2 Industry Value Chain Analysis – Gas Turbine MRO Market | |
  44. FIGURE 3 Porter's Five Forces Analysis – Gas Turbine MRO Market | |
  45. FIGURE 4 Global Market Size Trend Line, 2021–2035 (USD Billion) | |
  46. FIGURE 5 Year-over-Year Growth Curve, 2022–2035 (%) | |
  47. FIGURE 6 Market Share by Capacity Class, 2025 vs 2035 (%) | |
  48. FIGURE 7 Market Share by Turbine Cycle, 2025 vs 2035 (%) | |
  49. FIGURE 8 Market Share by Service Type, 2025 vs 2035 (%) | |
  50. FIGURE 9 Market Share by End-User Industry, 2025 vs 2035 (%) | |
  51. FIGURE 10 Regional Share Distribution, 2025 (%) | |
  52. FIGURE 11 Regional CAGR Comparison, 2026–2035 (%) | |
  53. FIGURE 12 Country-Level Contribution Heat Map, 2025 | |
  54. FIGURE 13 Competitive Landscape – Revenue Share Positioning, 2026 | |
  55. FIGURE 14 Strategic Positioning Matrix – OEM vs Independent Service Providers | |
  56. FIGURE 15 Driver Impact Weighting Chart, 2026–2035

Segmentation Quick Reference

DimensionSub-SegmentsDominant SegmentFastest Growing Segment
By CapacityBelow 30 MW; 31 to 120 MW; Above 120 MWAbove 120 MW31 to 120 MW
By Turbine CycleCombined Cycle; Open/Simple CycleCombined CycleOpen/Simple Cycle
By Service TypeMaintenance; Repair; OverhaulMaintenanceOverhaul
By End-User IndustryPower Generation; Oil and Gas; Industrial and OtherPower GenerationIndustrial and Other
By GeographyNorth America; Europe; Asia-Pacific; South America; Middle East and AfricaAsia-PacificAsia-Pacific


Market Segmentation Overview

By Capacity

Sub-SegmentKey Trend
Below 30 MWDistributed generation and offshore platform duty sustain steady replacement-parts demand.
31 to 120 MWIndustrial cogeneration expansion drives the fastest service-event frequency growth.
Above 120 MWAdvanced-class parts value concentration keeps revenue weighting heavily skewed.


Capacity class determines both parts economics and outage complexity. Larger frames deliver higher revenue per event because component pricing scales with firing temperature and material sophistication, while mid-range units compensate through shorter intervals and rising installation counts across industrial estates.

By Turbine Cycle

Sub-SegmentKey Trend
Combined CycleHigher annual fired hours and multi-equipment sites anchor recurring revenue
Open/Simple CycleStart-heavy peaking duty accelerates component life consumption.


Cycle configuration increasingly predicts wear mode. Combined-cycle assets accumulate hours; simple-cycle assets accumulate starts, and the second pattern degrades combustion hardware far faster per operating hour.

By Service Type

Sub-SegmentKey Trend
MaintenanceCondition-based scheduling gradually replaces fixed calendar intervals
RepairAdditive and advanced coating processes extend component service life.
OverhaulAging pre-2008 fleet cohort drives the steepest growth trajectory.


Service mix is shifting as diagnostics mature. Predictive monitoring trims unnecessary routine work while surfacing genuine defects earlier, which redistributes spend from scheduled maintenance toward targeted repair and full overhaul scopes.

By End-User Industry

Sub-SegmentKey Trend
Power GenerationGrid firming and renewable balancing reshape outage cadence
Oil and GasLNG liquefaction and pipeline compression sustain mechanical-drive demand
Industrial and OtherCaptive power adoption produces the fastest expansion rate.


End-user profiles diverge sharply on availability tolerance. Utilities schedule around seasonal peaks; LNG operators cannot afford unplanned train shutdowns and therefore purchase deeper spares coverage and premium response commitments.

By Geography

Sub-SegmentKey Trend
North AmericaCycling duty and hydrogen hub investment reshape service scope
EuropeCarbon pricing rewards efficiency, recovery outages and combustion upgrades.
Asia-PacificInstalled-base scale plus localization of repair capability
South AmericaHydrological variability governs thermal utilization and outage timing.
Middle East and AfricaMegaproject fleets entering first major inspection cycles


Geographic demand tracks installed capacity and duty intensity rather than economic output. Regions with young megaproject fleets generate concentrated outage waves, while mature regions produce steadier, more predictable annual service volumes.




Download PDF ×

We do not share your information with anyone. However, we may send you emails based on your report interest from time to time. You may contact us at any time to opt-out.