Segmentation Quick Reference
| Dimension | Sub-Segments | Dominant Segment | Fastest Growing Segment |
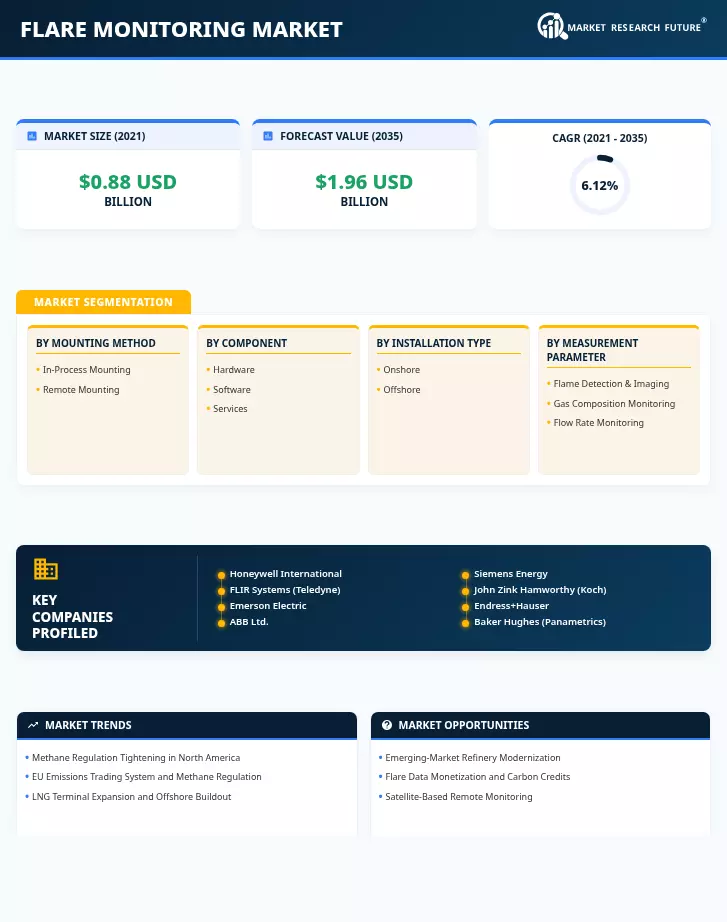
| Mounting Method | In-Process Mounting, Remote Mounting | In-Process Mounting | Remote Mounting |
| Component | Hardware, Flare Monitoring Market, Services | Hardware | Services |
| Installation Type | Onshore, Offshore | Onshore | Offshore |
| Measurement Parameter | Flame Detection & Imaging, Gas Composition Monitoring, Flow Rate Monitoring | Flame Detection & Imaging | Gas Composition Monitoring |
| End-User | Oil Refineries, Petrochemical Plants, Upstream Offshore Operations | Oil Refineries | Upstream Offshore Operations |
| Geography | North America, Europe, Asia-Pacific, South America, Middle East & Africa | North America | Asia-Pacific |
Market Segmentation Overview
By Mounting Method
| Sub-Segment | Key Trend |
| In-Process Mounting | Continued dominance driven by regulatory accuracy requirements for direct-contact sensor installations at refinery flare stacks |
| Remote Mounting | Rapid adoption fueled by satellite-based and drone-mounted monitoring platforms, reducing personnel exposure in hazardous zones |
In-process mounting remains the preferred approach for facilities subject to stringent CEMS accuracy thresholds, while remote mounting gains traction as satellite constellations and UAV payloads deliver cost-effective alternatives for geographically dispersed or offshore assets.
By Component
| Sub-Segment | Key Trend |
| Hardware | Infrared cameras, gas analyzers, and flow meters form the capital-intensive foundation of monitoring installations |
| Flare Monitoring Market | Cloud-based analytics platforms and compliance-reporting dashboards accelerate digital transformation |
| Services | Managed monitoring contracts, calibration services, and AI-driven predictive maintenance subscriptions grow fastest |
Hardware spending drives initial project capex, but recurring software and services revenue is shifting the industry toward subscription-based business models that lower adoption barriers for mid-tier operators.
By Installation Type
| Sub-Segment | Key Trend |
| Onshore | Refinery and gas-processing plant compliance spending sustains the largest installed base |
| Offshore | FPSO deployments and deepwater platform construction programs create the fastest growth corridor |
Onshore installations benefit from established regulatory frameworks and easier equipment access, while offshore installations demand ruggedized, remotely operated systems integrated with digital-twin platforms.
By Measurement Parameter
| Sub-Segment | Key Trend |
| Flame Detection & Imaging | Multi-spectral infrared and thermal cameras dominate for real-time combustion visualization |
| Gas Composition Monitoring | Speciated VOC and methane analysis requirements drive fastest adoption growth |
| Flow Rate Monitoring | Ultrasonic and differential-pressure meters support custody-transfer and mass-balance calculations |
Flame detection and imaging serve as the primary compliance tool, but gas composition monitoring is the key growth frontier as regulators shift from aggregate emission estimates to component-level reporting.
By End-User
| Sub-Segment | Key Trend |
| Oil Refineries | Dense flare-stack configurations and mature regulatory mandates sustain the largest market share |
| Petrochemical Plants | Process-safety instrumented system upgrades integrate flare monitoring into broader plant automation |
| Upstream Offshore Operations | Deepwater FPSO fleet expansion and zero-routine-flaring commitments drive the highest growth rates |
Oil refineries will continue to anchor demand, but upstream offshore operations are poised to narrow the gap as new production assets in pre-salt basins, East Africa, and the Eastern Mediterranean come online with integrated monitoring from day one.