Table of Contents
1 Executive Summary 14
1.1 Market Attractiveness Analysis 16
1.1.1 Global Flare Monitoring Market, By Type 16
1.1.2 Global Flare Monitoring Market, By Application 17
1.1.3 Global Flare Monitoring Market, By Region 19
2 Market Introduction 20
2.1 Definition 20
2.2 Scope of the Study 20
2.3 Market Structure 21
2.4 Key Buying Criteria 21
3 Research Methodology 22
3.1 Research Process 22
3.2 Primary Research 23
3.3 Secondary Research 24
3.4 Market Size Estimation 24
3.5 Forecast Model 25
3.6 List of Assumptions 26
4 Market Insights 27
5 Market Dynamics 31
5.1 Introduction 31
5.2 Drivers 32
5.2.1 Increasing Need for Controlling Waste Gas Combustion Parameters Due to Stringent Local and Global Environmental Regulations 32
5.2.2 Drivers Impact Analysis 34
5.3 Restraints 35
5.3.1 Shift in Focus Towards Eliminating Flaring By Major Countries 35
5.3.2 Restraints Impact Analysis 35
5.4 Opportunities 36
5.4.1 Growing Demand From Emerging Economies 36
5.5 Porterβs Five Forces Model 36
5.5.1 Threat of New Entrants 37
5.5.2 Bargaining Power of Suppliers 37
5.5.3 Bargaining Power of Buyers 38
5.5.4 Threat of Substitutes 38
5.5.5 Intensity of Rivalry 38
5.6 Value Chain Analysis 39
5.6.1 Raw Material Supply 40
5.6.2 Manufacturing and Assembly 40
5.6.3 Fabrication and Testing 40
5.6.4 End-Use 40
6 Global Flare Monitoring Market, by Type 41
6.1 Overview 41
On the basis of Type, the global Flare Monitoring Market is divided into: 41
6.1.1 Type: Market Estimates & Forecast, 2020β2027 42
6.2 In-Process 43
6.2.1 Mass Spectrometers 43
6.2.2 Gas Chromatographs 43
6.2.3 Gas Analyzers 43
6.3 Remote 43
6.3.1 Remote-IR Imagers 43
6.3.2 MSIR Imagers 43
7 Global Flare Monitoring Market, by Application 45
7.1 Overview 45
On the basis of Application, the global Flare Monitoring Market is divided into: 45
7.1.1 Application: Market Estimates & Forecast, 2020β2027 46
7.2 Oil & Gas Production Sites 47
7.3 Petrochemical 47
7.4 Refineries 48
8 Global Flare Monitoring Market, by Region 52
8.1 Overview 52
8.2 North America 53
8.2.1 US 56
8.2.2 Canada 58
8.2.3 Mexico 58
8.3 Europe 61
8.3.1 Germany 63
8.3.2 UK 64
8.3.3 France 66
8.3.4 Italy 67
8.3.5 Rest of Europe 68
8.4 Asia-Pacific 71
8.4.1 China 73
8.4.2 India 75
8.4.3 Japan 76
8.4.4 Rest of Asia-Pacific 77
8.5 Rest of the World 78
8.5.1 Middle East & Africa 81
8.5.2 South America 82
9 Competitive Landscape 85
9.1 Competitive Overview 85
9.2 Competitor Dashboard 86
9.3 Major Growth Strategies of the Global Flare Monitoring Market 87
9.4 Competitive Benchmarking 88
9.5 Market Share Analysis 88
9.6 ABB: The Leading Player in terms of Number of Developments in the Global Flare Monitoring Market 88
10 Company Profiles 80
10.1 ABB 80
10.1.1 Company Overview 80
10.1.2 Financial Overview 80
10.1.3 Products Offered 80
10.1.4 Key Developments 81
10.1.5 SWOT Analysis 82
10.1.6 Key Strategies 82
10.2 Thermo Fisher Scientific Inc. 83
10.2.1 Company Overview 83
10.2.2 Financial Overview 83
10.2.3 Products Offered 83
10.2.4 Key Developments 84
10.2.5 SWOT Analysis 84
10.2.6 Key Strategies 84
10.3 Siemens 85
10.3.1 Company Overview 85
10.3.2 Financial Overview 85
10.3.3 Products Offered 85
10.3.4 Key Developments 86
10.3.5 SWOT Analysis 87
10.3.6 Key Strategies 87
10.4 Honeywell International Inc 88
10.4.1 Company Overview 88
10.4.2 Financial Overview 88
10.4.3 Products Offered 88
10.4.4 Key Developments 88
10.4.5 SWOT Analysis 90
10.4.6 Key Strategies 90
10.5 AMETEK.Inc 91
10.5.1 Company Overview 91
10.5.2 Financial Overview 91
10.5.3 Products Offered 91
10.5.4 Key Developments 91
10.5.5 Key Strategies 91
10.6 Zeeco, Inc 92
10.6.1 Company Overview 92
10.6.2 Financial Overview 93
10.6.3 Products Offered 94
10.6.4 Key Developments 94
10.6.5 SWOT Analysis 95
10.6.6 Key Strategies 95
10.7 FLIR Systems Inc 96
10.7.1 Company Overview 96
10.7.2 Financial Overview 97
10.7.3 Products Offered 97
10.7.4 Key Developments 98
10.7.5 SWOT Analysis 98
10.7.6 Key Strategies 98
10.8 LumaSense Technologies, Inc 19
10.8.1 Company Overview 19
10.8.2 Financial Overview 19
10.8.3 Products Offered 19
10.8.4 Key Developments 19
10.8.5 SWOT Analysis 101
10.8.6 Key Strategies 101
10.8 Fluenta AS 102
10.8.1 Company Overview 102
10.8.2 Financial Overview 102
10.8.3 Products Offered 102
10.8.4 Key Developments 103
10.8.5 SWOT Analysis 103
10.8.6 Key Strategies 103
10.9 Williamson Corporation 104
10.9.1 Company Overview 104
10.9.2 Financial Overview 104
10.9.3 Products Offered 104
10.9.4 Key Developments 105
10.9.5 SWOT Analysis 105
10.9.6 Key Strategies 105
10.10 Extrel CMS, LLC. 106
10.10.1 Company Overview 106
10.10.2 Financial Overview 107
10.10.3 Products Offered 107
10.10.4 Key Developments 107
10.10.5 SWOT Analysis 108
10.10.6 Key Strategies 108
10.12 Providence Photonics, LLC. 106
10.12.1 Company Overview 106
10.12.2 Financial Overview 107
10.12.3 Products Offered 107
10.12.4 Key Developments 107
10.12.5 SWOT Analysis 108
10.10.6 Key Strategies 108
11 Appendix 108
11.1 References 108
11.2 Related Reports 108
11.3 List of Abbreviation 110
β
List of Tables
TABLE 1 LIST OF ASSUMPTIONS 26
TABLE 2 FLARE MONITORING MARKET ESTIMATES & FORECAST, BY TYPE, 2020β2027 (USD MILLION) 42
TABLE 3 FLARE MONITORING MARKET ESTIMATES & FORECAST, BY APPLICATION, 2020β2027 (USD MILLION) 46
TABLE 4 GLOBAL FLARE MONITORING MARKET, BY REGION, 2020-2027 (USD MILLION) 53
TABLE 5 NORTH AMERICA: FLARE MONITORING MARKET, BY COUNTRY, 2017-2024 (USD MILLION) 54
TABLE 6 NORTH AMERICA: FLARE MONITORING MARKET, BY TYPE, 2020-2027 (USD MILLION) 54
TABLE 7 NORTH AMERICA: FLARE MONITORING MARKET, BY APPLICATION, 2020-2027 (USD MILLION) 55
TABLE 8 US: FLARE MONITORING MARKET, BY TYPE, 2020-2027 (USD MILLION) 56
TABLE 9 US: FLARE MONITORING MARKET, BY APPLICATION, 2020-2027 (USD MILLION) 57
TABLE 10 CANADA: FLARE MONITORING MARKET, BY TYPE, 2020-2027 (USD MILLION) 58
TABLE 11 CANADA: FLARE MONITORING MARKET, BY APPLICATION, 2020-2027 (USD MILLION) 58
TABLE 12 MEXICO: FLARE MONITORING MARKET, BY APPLICATION, 2020-2027 (USD MILLION) 59
TABLE 13 MEXICO: FLARE MONITORING MARKET, BY TYPE, 2020-2027 (USD MILLION) 60
TABLE 14 MEXICO: FLARE MONITORING MARKET, BY APPLICATION, 2020-2027 (USD MILLION) 60
TABLE 15 EUROPE: FLARE MONITORING MARKET, BY COUNTRY, 2017-2024 (USD MILLION) 61
TABLE 16 EUROPE: FLARE MONITORING MARKET, BY TYPE, 2020-2027 (USD MILLION) 62
TABLE 17 EUROPE: FLARE MONITORING MARKET, BY APPLICATION, 2020-2027 (USD MILLION) 62
TABLE 18 GERMANY: FLARE MONITORING MARKET, BY TYPE, 2020-2027 (USD MILLION) 63
TABLE 19 GERMANY: FLARE MONITORING MARKET, BY APPLICATION, 2020-2027 (USD MILLION) 64
TABLE 20 UK: FLARE MONITORING MARKET, BY TYPE, 2020-2027 (USD MILLION) 65
TABLE 21 UK: FLARE MONITORING MARKET, BY APPLICATION, 2020-2027 (USD MILLION) 65
TABLE 22 FRANCE: FLARE MONITORING MARKET, BY APPLICATION, 2020-2027 (USD MILLION) 66
TABLE 23 FRANCE: FLARE MONITORING MARKET, BY TYPE, 2020-2027 (USD MILLION) 67
TABLE 24 FRANCE: FLARE MONITORING MARKET, BY APPLICATION, 2020-2027 (USD MILLION) 67
TABLE 25 ITALY: FLARE MONITORING MARKET, BY TYPE, 2020-2027 (USD MILLION) 68
TABLE 26 ITALY: FLARE MONITORING MARKET, BY APPLICATION, 2020-2027 (USD MILLION) 68
TABLE 27 REST OF EUROPE: FLARE MONITORING MARKET, BY TYPE, 2020-2027 (USD MILLION) 69
TABLE 28 REST OF EUROPE: FLARE MONITORING MARKET, BY APPLICATION, 2020-2027 (USD MILLION) 70
TABLE 29 ASIA-PACIFIC: FLARE MONITORING MARKET, BY COUNTRY, 2017-2024 (USD MILLION) 71
TABLE 30 ASIA-PACIFIC: FLARE MONITORING MARKET, BY TYPE, 2020-2027 (USD MILLION) 72
TABLE 31 ASIA-PACIFIC: FLARE MONITORING MARKET, BY APPLICATION, 2020-2027 (USD MILLION) 72
TABLE 32 CHINA: FLARE MONITORING MARKET, BY TYPE, 2020-2027 (USD MILLION) 73
TABLE 33 CHINA: FLARE MONITORING MARKET, BY APPLICATION, 2020-2027 (USD MILLION) 74
TABLE 34 INDIA: FLARE MONITORING MARKET, BY TYPE, 2020-2027 (USD MILLION) 75
TABLE 35 INDIA: FLARE MONITORING MARKET, BY APPLICATION, 2020-2027 (USD MILLION) 75
TABLE 36 JAPAN: FLARE MONITORING MARKET, BY TYPE, 2020-2027 (USD MILLION) 76
TABLE 37 JAPAN: FLARE MONITORING MARKET, BY APPLICATION, 2020-2027 (USD MILLION) 77
TABLE 38 REST OF ASIA-PACIFIC: FLARE MONITORING MARKET, BY TYPE, 2020-2027 (USD MILLION) 78
TABLE 39 REST OF ASIA-PACIFIC: FLARE MONITORING MARKET, BY APPLICATION, 2020-2027 (USD MILLION) 78
TABLE 40 REST OF THE WORLD: FLARE MONITORING MARKET, BY REGION, 2017-2024 (USD MILLION) 79
TABLE 41 REST OF THE WORLD: FLARE MONITORING MARKET, BY TYPE, 2020-2027 (USD MILLION) 80
TABLE 42 REST OF THE WORLD: FLARE MONITORING MARKET, BY APPLICATION, 2020-2027 (USD MILLION) 80
TABLE 43 MIDDLE EAST & AFRICA: FLARE MONITORING MARKET, BY TYPE, 2020-2027 (USD MILLION) 81
TABLE 44 MIDDLE EAST & AFRICA: FLARE MONITORING MARKET, BY APPLICATION, 2020-2027 (USD MILLION) 82
TABLE 45 SOUTH AMERICA: FLARE MONITORING MARKET, BY TYPE, 2020-2027 (USD MILLION) 83
TABLE 46 SOUTH AMERICA: FLARE MONITORING MARKET, BY APPLICATION, 2020-2027 (USD MILLION) 83
TABLE 47 ABB: THE MOST ACTIVE PLAYER IN THE GLOBAL FLARE MONITORING MARKET 89
TABLE 48 ABB: PRODUCTS OFFERED 90
TABLE 49 ABB: KEY DEVELOPMENTS 91
TABLE 50 THERMO FISHER SCIENTIFIC INC: PRODUCTS OFFERED 90
TABLE 51 THERMO FISHER SCIENTIFIC INC: KEY DEVELOPMENTS 94
TABLE 52 SIEMENS: PRODUCTS OFFERED 95
TABLE 53 SIEMENS: KEY DEVELOPMENTS 96
TABLE 54 HONEYWELL INTERNATIONAL INC: PRODUCTS OFFERED 98
TABLE 55 HONEYWELL INTERNATIONAL INC: KEY DEVELOPMENTS 99
TABLE 56 AMETEK.INC: PRODUCTS OFFERED 101
TABLE 57 AMETEK.INC: PRODUCTS OFFERED 117
β
List of Figures
FIGURE 1 MARKET SYNOPSIS 15
FIGURE 2 MARKET ATTRACTIVENESS ANALYSIS: GLOBAL FLARE MONITORING MARKET, 2017 16
FIGURE 3 GLOBAL FLARE MONITORING MARKET ANALYSIS BY TYPE 16
FIGURE 4 GLOBAL FLARE MONITORING MARKET ANALYSIS BY APPLICATION 17
FIGURE 5 GLOBAL FLARE MONITORING MARKET ANALYSIS BY REGION 19
FIGURE 6 GLOBAL FLARE MONITORING MARKET: MARKET STRUCTURE 21
FIGURE 7 KEY BUYING CRITERIA OF FLARE MONITORING 21
FIGURE 8 RESEARCH PROCESS OF MRFR 22
FIGURE 9 TOP DOWN & BOTTOM UP APPROACH 25
FIGURE 10 NORTH AMERICA MARKET SIZE & MARKET SHARE BY COUNTRY (2020 VS 2027) 27
FIGURE 11 EUROPE MARKET SIZE & MARKET SHARE BY COUNTRY (2020 VS 2027) 28
FIGURE 12 ASIA-PACIFIC & MARKET SHARE BY COUNTRY (2020 VS 2027) 29
FIGURE 13 REST OF THE WORLD MARKET SIZE & MARKET SHARE BY COUNTRY (2020 VS 2027) 30
FIGURE 14 DROC ANALYSIS OF GLOBAL FLARE MONITORING MARKET 31
FIGURE 15 GLOBAL AUTOMOTIVE PRODUCTION (2016 VS 2017) 32
FIGURE 16 GLOBAL INFRASTRUCTURE INVESTMENT (2018) 33
FIGURE 17 DRIVERS IMPACT ANALYSIS: FLARE MONITORING MARKET 34
FIGURE 18 RESTRAINTS IMPACT ANALYSIS: FLARE MONITORING MARKET 35
FIGURE 19 PORTER'S FIVE FORCES ANALYSIS OF THE GLOBAL FLARE MONITORING MARKET 37
FIGURE 20 VALUE CHAIN: GLOBAL FLARE MONITORING MARKET 39
FIGURE 21 GLOBAL FLARE MONITORING MARKET, BY TYPE, 2017 (% SHARE) 41
FIGURE 22 GLOBAL FLARE MONITORING MARKET, BY TYPE, 2020β2027 (USD MILLION) 42
FIGURE 23 GLOBAL FLARE MONITORING MARKET, BY APPLICATION, 2017 (% SHARE) 45
FIGURE 24 GLOBAL FLARE MONITORING MARKET, BY APPLICATION, 2020β2027 (USD MILLION) 47
FIGURE 25 GLOBAL FLARE MONITORING MARKET, BY REGION, 2020β2027 (USD MILLION) 52
FIGURE 26 COMPETITOR DASHBOARD: GLOBAL FLARE MONITORING MARKET 86
FIGURE 27 PRODUCT DEVELOPMENT: THE MAJOR STRATEGY ADOPTED BY KEY PLAYERS IN GLOBAL FLARE MONITORING MARKET 87
FIGURE 28 BENCHMARKING OF MAJOR COMPETITORS 88
FIGURE 29 MAJOR MANUFACTURER MARKET SHARE ANALYSIS, 2017 89
FIGURE 30 ABB: FINANCIAL OVERVIEW SNAPSHOT 90
FIGURE 31 ABB: SWOT ANALYSIS 92
FIGURE 32 THERMO FISHER SCIENTIFIC INC.: TOTAL REVENUE VS RESEARCH & DEVELOPMENT AND GEOGRAPHICAL REVENUE (2014β2017) 93
FIGURE 33 THERMO FISHER SCIENTIFIC INC.: SWOT ANALYSIS 94
FIGURE 34 SIEMENS.: SWOT ANALYSIS 97
FIGURE 35 SIEMENS SWOT ANALYSIS 100
FIGURE 36 HONEYWELL INTERNATIONAL INC: TOTAL REVENUE VS RESEARCH & DEVELOPMENT AND GEOGRAPHICAL REVENUE (2020β2027) 103
FIGURE 37 HONEYWELL INTERNATIONAL INC: SWOT ANALYSIS 105
FIGURE 38 AMETEK.INC: TOTAL REVENUE VS RESEARCH & DEVELOPMENT AND GEOGRAPHICAL REVENUE (2020β2027) 107
FIGURE 39 AMETEK.INC: SWOT ANALYSIS 109
FIGURE 40 ZEECO, INC: SWOT ANALYSIS 111
FIGURE 41 FLIR SYSTEMS INC: SWOT ANALYSIS 113
FIGURE 42 LUMASENSE TECHNOLOGIES, INC: SWOT ANALYSIS 115
FIGURE 43 FLUENTA AS: FINANCIAL OVERVIEW SNAPSHOT 117
FIGURE 44 FLUENTA AS: SWOT ANALYSIS 118
$1,314.1 Million
7.83%
North America
2018-2025
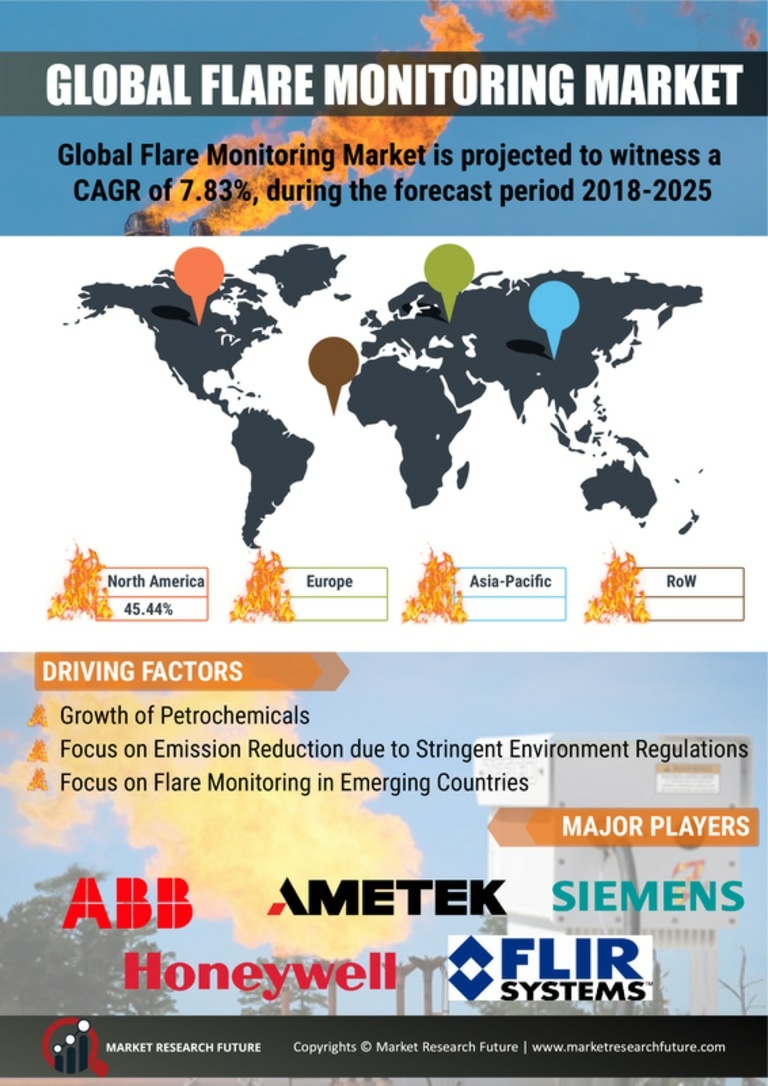
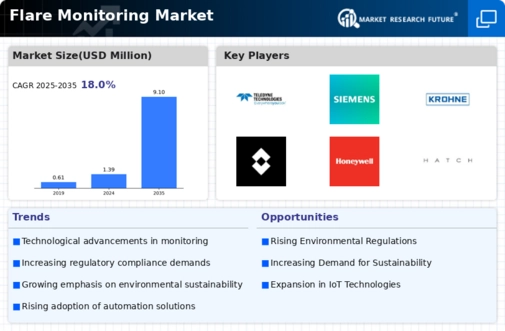
Flare monitoring market is set to exhibit a CAGR of 7.83% between 2018 and 2025 to reach a valuation of USD 1,314.1 Mn.
The flare monitoring market is expected to grow substantially due to the factors such as strict environmental regulations to curb harmful emissions and raise the combustion efficiency of flare systems, followed by the benefits offered by remote flare monitoring systems and the steady expansion of oil gas and petrochemicals industries. Stringent government environmental regulations related to industrial gas emission, the requirement of real time flare monitoring system, and the requirement of enhanced & increased safety norms & global industry standardization are driving the growth of the flare monitoring market. Restricting and controlling the hazardous element's emissions in the environment to withstand the global environment and avoid global warming.
The flare monitoring is used to monitor the characteristics of the flare out of the flames from the industrial sector and restore the gases for environment prevention, for cost-saving which can be reused and also helps maintain the standardized gases footprints according to the Environmental Protection Agency (EPA). The increased focus on safety and enforcement of stringent labor safety continue to drive the adoption of advanced monitoring systems including flare monitoring systems in the oil and gas facilities.
Monitoring the fluctuations in stack flame is the primary function of flare monitoring devices. Integration of leading-edge infrared systems and visual cameras has made these systems extremely effective and credible. The latest versions of the flare monitoring systems are capable of non-contact monitoring and continuous monitoring of emissions. Flare monitoring systems are common in chemical process plants, refineries, petrochemicals industry, oil & gas production sites, and gas distribution infrastructure. With the oil and gas industry striving for more efficiency in both upstream and downstream activities, technologies such as flare monitoring will remain crucial.
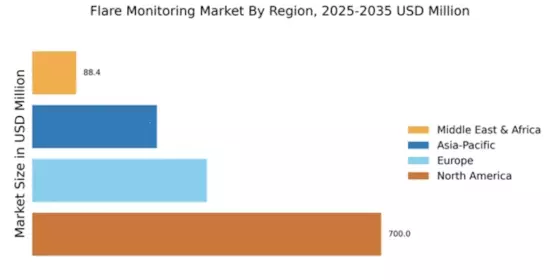
Global Flare Monitoring Market, By Region, 2017
By region, the flare monitoring market is segmented into North America, Asia Pacific (APAC), Europe, Latin America, and the Middle East & Africa (MEA). North America currently accounts for the largest share of the market and is likely to retain its dominant position over 2025. Demand for flare monitoring is expected to remain healthy in North America during the assessment period. The oil and gas industry is undergoing structural reforms where facility upgradation is a key focus area. This is expected to create lucrative opportunities for market players during the forecast period. Meanwhile, Europe has emerged as second largest market for flare monitoring. Currently, the market in Europe stand at more than USD 150 Mn. In addition, it is likely to post a healthy growth rate in the coming years. The APAC market is also expected to exhibit a tremendous growth rate during the review period. This is mainly owing to the substantial growth of the oil and gas sector in APAC. India and China have emerged as two of the largest consumers of oil and gas in the world and present attractive growth opportunities to the global market.
Companies Covered
Providence Photonics, LLC., ABB, Siemens AG, AMETEK.Inc., LumaSense Technologies, Inc., Williamson Corporation, Thermo Fisher Scientific Inc., Extrel CMS, LLC, FLIR Systems Inc., Honeywell International Inc., Fluenta AS., and Zeeco, Inc.
Recent Developments
The growing demand from major oil and gas producing countries across the Middle East & Africa and significant oil refining countries in the Asia Pacific and Europe are offering new growth opportunities to the players in the flare monitoring market. However, governments, oil companies, and development institutions worldwide are encouraged to endorse the Zero Routine Flaring by 2030 Initiative, which is expected to restrict market growth. The flare monitoring system has functions owing to which, it is capable of automatic generation of the signal and flare size tracking so that the hazard can be avoided. It is gaining the pace across Oil & Gas Industry. The United States is recognized as the largest market for oil and gas in North America. The country's newfound shale resources and government policies that aim to make the country the top oil and gas producer in the next few years are expected to drive the demand for the flare monitoring market in the oil and gas industry.
A number of companies are operating in the global flare monitoring market. Growth opportunities for market participants depend on market condition, government policies and industry development. Most of the players are focusing on improving market position, global presence, and expanding product portfolio. In 2017, ABB (Switzerland), Siemens AG (Germany), Thermo Fisher Scientific Inc. (US), AMETEK.Inc (US), and Honeywell International Inc. (US) collectively accounted for major share of the market.
ABB is engaged in the business of electrification products, industrial automation, power grids, utilities services, and transport & infrastructure services. Siemens AG offers products and services for building technologies and drive technology. It caters to sectors such as energy, healthcare, industrial automation, mobility, financing, services, software, and consumer products. Thermo Fisher Scientific Inc. is one of the leading technology providers with expertise in Thermo Scientific, Applied Biosystems, Invitrogen, Fisher Scientific, and Unity Lab Services.
AMETEK.Inc. is a global manufacturer of electronic instruments and electromechanical devices. It operates through two business segments - electronic instruments and electromechanical. Honeywell International Inc. is a diversified technology providing company and operates in sectors such as aerospace, home and building technologies, performance materials and technologies, and safety and productivity solutions.
The report covers the development strategies adopted by the companies between 2015 to 2018. Market players adopted various strategies to retain and/or expand their market share.
Market Segmentation
By Type- In-Process (mass spectrometers, gas chromatographs, gas analyzers), and Remote (remote-IR imagers and MSIR imagers).
By Application- Refineries, Oil & Gas Production Sites, and Petrochemicals.
Type Analysis
The In-process segment holds a significant share of the market. Furthermore, the segment is set to grow at a CAGR of 7.71% during the forecast period. The process instruments used in flare monitoring are intelligent tools that store and analyze data in real time. For accurate measurement, these devices are usually installed near the flare exhaust.
Application Analysis
The oil & gas production sites segment is expected to remain highly attractive during the forecast period. Currently, the segment commands close to 60% market share in terms of value.
Key questions addressed by the report
Report Attribute/Metric | Details |
---|---|
Market Size |
|
CAGR | 7.83%CAGR (2022-2030) |
Base Year | 2021 |
Forecast Period | 2022Β toΒ 2030 |
Historical Data | 2019Β &Β 2020 |
Forecast Units | Value (USD Million) |
Report Coverage | Revenue Forecast, Competitive Landscape, Growth Factors, and Trends |
Segments Covered | Type and Application |
Geographies Covered | North America, Europe, Asia-Pacific, and Rest of the World (RoW) |
Key Vendors | Providence Photonics, LLC., ABB, Siemens AG, AMETEK.Inc., LumaSense Technologies, Inc., Williamson Corporation, Thermo Fisher Scientific Inc., Extrel CMS, LLC, FLIR Systems Inc., Honeywell International Inc., Fluenta AS., and Zeeco, Inc. |
Key Market Opportunities | Government policies and industry development |
Key Market Drivers |
|
Frequently Asked Questions (FAQ) :
The worldwide market of flare monitoring can thrive at 7.83% CAGR from 2018 to 2025.
The flare monitoring market can value at USD 1,314.1 Mn by 2025.
ABB, Siemens AG, LumaSense Technologies, Inc., AMETEK.Inc, and Williamson Corporation are reputed companies that can function in the flare monitoring market.
The growing requirement for monitoring of fluctuations in stack flame can promote the flare monitoring market expansion.
By 2025, the flare monitoring market in North America can strike a high CAGR as the oil and gas industry is experiencing numerous infrastructural developments.