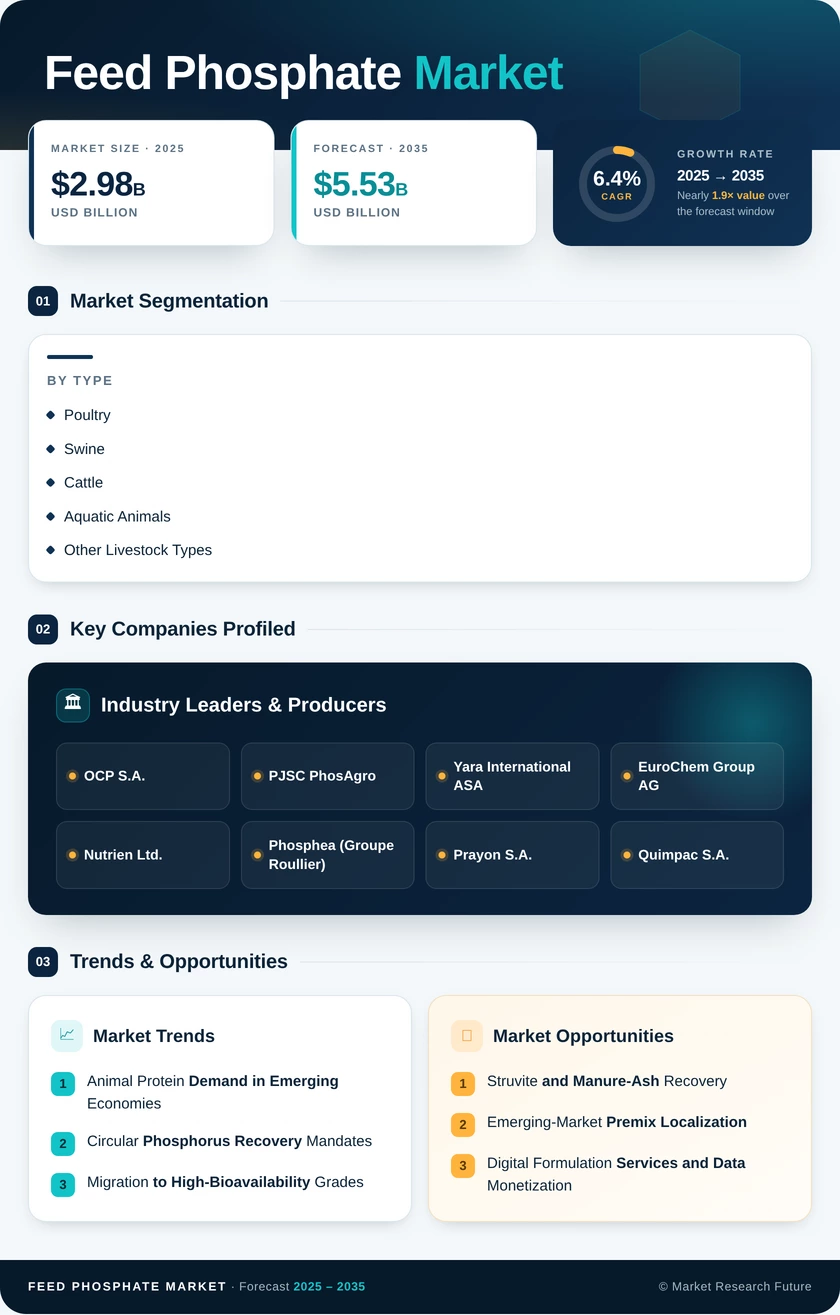
Feed Phosphate Market (2026 - 2035)

ID: MRFR/Agri/40219-HCR 128 Pages Snehal Singh Last Updated: September 17, 2026

Feed Phosphate Market Size, Share, Industry Trend & Analysis Research Report By Feed Type (Monocalcium Phosphate, Dicalcium Phosphate, Mono-Dicalcium Phosphate, Tricalcium Phosphate, Defluorinated Phosphate, Other Feed Types), By Livestock Type (Poultry, Swine, Cattle, Aquatic Animals, Other Livestock Types), By Region (North America, Europe, Asia-Pacific, South America, Middle East & Africa) - Forecast to 2035.

Feed Phosphate Market
Market Size
Forecast Period2026-2035
CAGR (2026-2035)6.4%
2025 Market SizeUSD 2.98 Billion
2035 Market SizeUSD 5.53 Billion
Key Players
OCP S.A.
PJSC PhosAgro
Yara International ASA
EuroChem Group AG
Nutrien Ltd.
Phosphea
Opportunities
  • Struvite and Manure-Ash Recovery
  • Emerging-Market Premix Localization
  • Digital Formulation Services and Data Monetization
  1. 1 Market Summary |
    1. 1.1 Study Assumptions & Market Definition |
    2. 1.2 Scope of the Study |
    3. 1.3 Research Methodology
  2. 2 Key Report Takeaways |
    1. 2.1 By Feed Type |
    2. 2.2 By Livestock Type |
    3. 2.3 By Region
  3. 3 Market Size & Forecast (2021–2035) |
    1. 3.1 Historical Market Size (2021–2024) |
    2. 3.2 Base Year Assessment (2025) |
    3. 3.3 Forecast Market Size (2026–2035) |
    4. 3.4 Year-over-Year Growth Analysis
  4. 4 Driver Impact Analysis |
    1. 4.1 Animal Protein Demand in Emerging Economies |
    2. 4.2 Circular Phosphorus Recovery Mandates |
    3. 4.3 Migration to High-Bioavailability Grades |
    4. 4.4 Aquaculture Intensification
  5. 5 Restraints Impact Analysis |
    1. 5.1 Phytase Enzyme Substitution |
    2. 5.2 Contaminant Ceilings on Imported Grades |
    3. 5.3 Defluorination Energy Economics
  6. 6 Opportunity Analysis |
    1. 6.1 Struvite and Manure-Ash Recovery |
    2. 6.2 Emerging-Market Premix Localization |
    3. 6.3 Digital Formulation Services and Data Monetization |
    4. 6.4 Aquafeed-Specific Grades |
    5. 6.5 Insect-Protein Co-Location
  7. 7 Regional Market Share & Country-Level Analysis |
    1. 7.1 North America | |
      1. 7.1.1 US | |
      2. 7.1.2 Canada | |
      3. 7.1.3 Mexico |
    2. 7.2 Europe | |
      1. 7.2.1 Germany | |
      2. 7.2.2 UK | |
      3. 7.2.3 France | |
      4. 7.2.4 Italy | |
      5. 7.2.5 Spain | |
      6. 7.2.6 Nordic Countries | |
      7. 7.2.7 Russia | |
      8. 7.2.8 Rest of Europe |
    3. 7.3 Asia-Pacific | |
      1. 7.3.1 China | |
      2. 7.3.2 India | |
      3. 7.3.3 Japan | |
      4. 7.3.4 South Korea | |
      5. 7.3.5 ASEAN | |
      6. 7.3.6 Rest of Asia-Pacific |
    4. 7.4 South America | |
      1. 7.4.1 Brazil | |
      2. 7.4.2 Argentina | |
      3. 7.4.3 Rest of South America |
    5. 7.5 Middle East & Africa | |
      1. 7.5.1 Saudi Arabia | |
      2. 7.5.2 UAE | |
      3. 7.5.3 South Africa | |
      4. 7.5.4 Egypt | |
      5. 7.5.5 Rest of Middle East & Africa
  8. 8 Future Outlook (2026–2035) |
    1. 8.1 Algorithmic Dosing Becomes Default |
    2. 8.2 Carbon Accounting Reshapes Sourcing |
    3. 8.3 Supply Chain Regionalization |
    4. 8.4 Enzyme–Mineral Co-Optimization
  9. 9 Market Segmentation Analysis |
    1. 9.1 By Feed Type | |
      1. 9.1.1 Monocalcium Phosphate | |
      2. 9.1.2 Dicalcium Phosphate | |
      3. 9.1.3 Mono-Dicalcium Phosphate | |
      4. 9.1.4 Tricalcium Phosphate | |
      5. 9.1.5 Defluorinated Phosphate | |
      6. 9.1.6 Other Feed Types |
    2. 9.2 By Livestock Type | |
      1. 9.2.1 Poultry | |
      2. 9.2.2 Swine | |
      3. 9.2.3 Cattle | |
      4. 9.2.4 Aquatic Animals | |
      5. 9.2.5 Other Livestock Types
  10. 10 Competitive Landscape |
    1. 10.1 Market Concentration Analysis (2026) |
    2. 10.2 Competitive Benchmarking Matrix |
    3. 10.3 Company Profiles | |
      1. 10.3.1 The Mosaic Company | |
      2. 10.3.2 OCP S.A. | |
      3. 10.3.3 PJSC PhosAgro | |
      4. 10.3.4 Yara International ASA | |
      5. 10.3.5 EuroChem Group AG | |
      6. 10.3.6 Nutrien Ltd. | |
      7. 10.3.7 Phosphea (Groupe Roullier) | |
      8. 10.3.8 J.R. Simplot Company | |
      9. 10.3.9 Prayon S.A. | |
      10. 10.3.10 Quimpac S.A. | |
      11. 10.3.11 Fosfitalia Group
  11. 11 Recent News & Developments
  12. 12 Report Scope & Methodology
  13. 13 Detailed Sources & Citations
  14. 14 Frequently Asked Questions
  15. 15 LIST OF TABLES |
  16. TABLE 1 Global Feed Phosphate Market Size & Forecast, by Revenue (USD Billion), 2021–2035 |
  17. TABLE 2 Global Feed Phosphate Market – Year-over-Year Growth Analysis, 2021–2035 |
  18. TABLE 3 Driver Impact Analysis Matrix, 2026–2035 |
  19. TABLE 4 Restraint Impact Analysis Matrix, 2026–2035 |
  20. TABLE 5 Global Feed Phosphate Market Size, by Region, 2021–2035 (USD Billion) |
  21. TABLE 6 North America Feed Phosphate Market Size, by Country, 2021–2035 (USD Billion) |
  22. TABLE 7 Europe Feed Phosphate Market Size, by Country, 2021–2035 (USD Billion) |
  23. TABLE 8 Asia-Pacific Feed Phosphate Market Size, by Country, 2021–2035 (USD Billion) |
  24. TABLE 9 South America Feed Phosphate Market Size, by Country, 2021–2035 (USD Billion) |
  25. TABLE 10 Middle East & Africa Feed Phosphate Market Size, by Country, 2021–2035 (USD Billion) |
  26. TABLE 11 Global Feed Phosphate Market Size, by Feed Type, 2021–2035 (USD Billion) |
  27. TABLE 12 Global Feed Phosphate Market Size, by Livestock Type, 2021–2035 (USD Billion) |
  28. TABLE 13 North America Feed Phosphate Market Size, by Feed Type, 2021–2035 (USD Billion) |
  29. TABLE 14 Europe Feed Phosphate Market Size, by Livestock Type, 2021–2035 (USD Billion) |
  30. TABLE 15 Asia-Pacific Feed Phosphate Market Size, by Feed Type, 2021–2035 (USD Billion) |
  31. TABLE 16 Competitive Benchmarking Matrix, 2026 |
  32. TABLE 17 Company Profiles – Key Players |
  33. TABLE 18 Recent Developments & Strategic Announcements, 2023–2025 |
  34. TABLE 19 Report Scope & Methodology Summary |
  35. TABLE 20 Detailed Sources & Citations Index
  36. 16 LIST OF FIGURES |
  37. FIGURE 1 Market Dynamics – Drivers, Restraints, Opportunities |
  38. FIGURE 2 Industry Value Chain Analysis |
  39. FIGURE 3 Porter's Five Forces Analysis |
  40. FIGURE 4 Global Market Size Trend, 2021–2035 (USD Billion) |
  41. FIGURE 5 Year-over-Year Growth Curve, 2022–2035 |
  42. FIGURE 6 Market Share by Feed Type, 2025 vs 2035 |
  43. FIGURE 7 Market Share by Livestock Type, 2025 vs 2035 |
  44. FIGURE 8 Regional Share Distribution, 2025 |
  45. FIGURE 9 Regional CAGR Comparison, 2026–2035 |
  46. FIGURE 10 Country-Level Share Heatmap |
  47. FIGURE 11 Competitive Landscape – Revenue Share Positioning, 2026 |
  48. FIGURE 12 Strategic Positioning Quadrant of Leading Suppliers

Segmentation Quick Reference

DimensionSub-SegmentsDominant SegmentFastest Growing Segment
By Feed TypeMonocalcium Phosphate, Dicalcium Phosphate, Mono-Dicalcium Phosphate, Tricalcium Phosphate, Defluorinated Phosphate, Other Feed TypesDicalcium PhosphateMono-Dicalcium Phosphate
By Livestock TypePoultry, Swine, Cattle, Aquatic Animals, Other Livestock TypesPoultryAquatic Animals
By RegionNorth America, Europe, Asia-Pacific, South America, Middle East & AfricaAsia-PacificEurope


Market Segmentation Overview

By Feed Type

Sub-SegmentKey Trend
Monocalcium PhosphatePreferred in monogastric diets for high phosphorus solubility
Dicalcium PhosphateCost leadership sustains volume despite share erosion
Mono-Dicalcium PhosphateFastest adoption on pelleting stability and digestibility balance
Tricalcium PhosphateSteady demand from ruminant and companion-animal nutrition
Defluorinated PhosphateTied to cattle mineral supplementation and block formats
Other Feed TypesEmerging recovered and organically bound phosphorus sources


Chemistry choice increasingly reflects digestibility economics rather than headline price per tonne. Formulators comparing relative bioavailability now accept a premium carrier when inclusion rates fall enough to offset it, which is steadily pulling volume toward monocalcium and mono-dicalcium grades.

By Livestock Type

Sub-SegmentKey Trend
PoultryLargest consuming species on broiler cycle intensity
SwineMost exposed to phytase-led reformulation
CattleDairy productivity programs sustain defluorinated demand
Aquatic AnimalsFastest growth from shrimp and tilapia intensification
Other Livestock TypesNiche equine, pet, and small-ruminant applications


Species mix explains most regional variation in demand intensity. Asia-Pacific's aquaculture weighting and Brazil's broiler concentration produce very different consumption profiles from Europe's dairy-and-swine balance, and suppliers increasingly build regional product portfolios around that divergence.

By Region

Sub-SegmentKey Trend
North AmericaContract-led supply tied to integrated poultry complexes
EuropeCircular recovery and contaminant compliance drive premiumization
Asia-PacificVolume leadership with rapid aquafeed expansion
South AmericaExport-oriented broiler and beef feed demand
Middle East & AfricaUpstream rock strength meeting nascent downstream conversion


Regional strategy now hinges on where regulation, not resource, is tightest. Europe's compliance premium and Asia-Pacific's scale pull investment in opposite directions, leaving mid-sized regional players to compete on service, logistics, and formulation support rather than tonnage alone.




Download PDF ×

We do not share your information with anyone. However, we may send you emails based on your report interest from time to time. You may contact us at any time to opt-out.