Segmentation Quick Reference
| Dimension | Sub-Segments | Dominant Segment | Fastest Growing Segment |
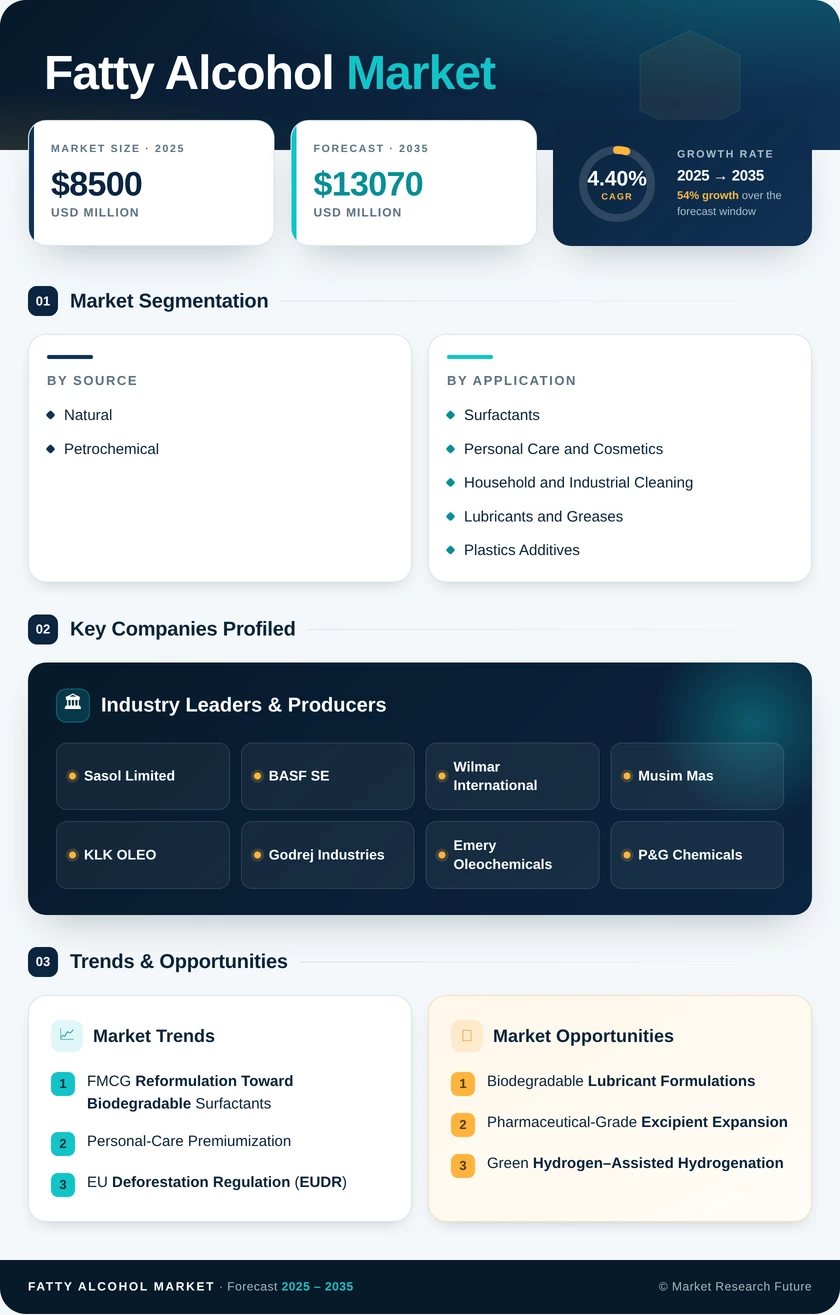
| By Source | Natural, Petrochemical | Natural (72% share, 2025) | Petrochemical (CAGR 4.75%) |
| By Application | Surfactants; Personal Care and Cosmetics; Household and Industrial Cleaning; Lubricants and Greases; Plastics Additives; Fatty Alcohol Market Excipients; Others | Surfactants (52% share, 2025) | Personal Care and Cosmetics (CAGR 5.10%) |
| By Geography | Asia-Pacific; North America; Europe; South America; Middle East & Africa | Asia-Pacific (48% share, 2025) | Asia-Pacific (CAGR 5.50%) |
Market Segmentation Overview
By Source
| Sub-Segment | Key Trend |
| Natural | Palm-kernel and coconut oil–derived production dominates; RSPO/ISCC certification is increasingly required for European and North American supply chains. |
| Petrochemical | Ethylene-based Ziegler and oxo-synthesis routes are gaining share in deforestation-sensitive markets; EUDR exemptions provide regulatory tailwind. |
Natural fatty alcohols remain the foundation of global supply, leveraging Southeast Asia's integrated plantation-to-refinery model. Petrochemical routes offer an alternative pathway that bypasses tropical feedstock volatility and deforestation-compliance complexity, making them increasingly attractive for sustainability-conscious buyers.
By Application
| Sub-Segment | Key Trend |
| Surfactants | Largest volume outlet; reformulation toward biodegradable alcohol ethoxylates and sulfates, accelerating |
| Personal Care and Cosmetics | Fastest growth; premiumization driving demand for high-purity cetyl and cetearyl alcohols |
| Household and Industrial Cleaning | Eco-label mandates shifting formulations from petroleum-based to fatty-alcohol-derived systems. |
| Lubricants and Greases | EU Ecolabel bio-lubricant criteria opening new high-margin applications for C16–C18 grades |
| Plastics Additives | Steady demand for fatty-alcohol-based slip agents and mold-release compounds |
| Fatty Alcohol Market Excipients | USP/EP monograph harmonization expanding addressable market for tablet-coating and emulsion grades |
| Others | Niche applications in textile auxiliaries, agrochemical emulsions, and metal-processing fluids |
Surfactants absorb over half of global fatty alcohol output, serving as the primary interface between oleochemical production and consumer-facing products. Personal care is the growth engine, propelled by rising Asian middle-class spending on premium skincare and haircare formulations that specify certified, traceable fatty alcohol ingredients.
By Geography
| Sub-Segment | Key Trend |
| Asia-Pacific | Production and consumption hub; Indonesia and China drive capacity additions and domestic demand growth |
| Europe | Regulatory-driven reformulation; EUDR reshaping supply-chain requirements for imported fatty alcohols |
| North America | Specialty-grade demand; pharmaceutical excipients and premium personal-care applications anchor value |
| South America | Emerging processing capacity in Brazil; import-substitution dynamics in domestic FMCG supply |
| Middle East & Africa | Petrochemical-route production in Saudi Arabia; nascent palm-kernel processing in West Africa |
Asia-Pacific's dominance reflects both its role as the world's primary oleochemical supply base and the rapid growth of regional end-use demand. Mature western markets increasingly differentiate on sustainability credentials and specialty-grade product portfolios rather than volume growth alone.