• Cat-intel
  • MedIntelliX
  • Resources
  • About Us
  • Hero Background
    English
    Chinese
    French
    Japanese
    Korean
    German
    Spanish

    Extremity Products Market Share

    ID: MRFR/HC/10211-HCR
    128 Pages
    Rahul Gotadki
    October 2025

    Extremity Products Market Research Report Information By Product (Upper Extremity and Lower Extremity), By Material (Metallic Material, Ceramic Material, Polymeric Material, and Natural Material), and By Region (North America, Europe, Asia-Pacific, and Rest of The World) – Market Forecast Till 2035

    Share:
    Download PDF ×

    We do not share your information with anyone. However, we may send you emails based on your report interest from time to time. You may contact us at any time to opt-out.

    Extremity Products Market Infographic
    $ 4,950.0
    $ 5,950.0
    $ 7,250.0

    Market Share

    Extremity Products Market Share Analysis

    Medical equipment for the hands, feet, wrists, and legs dominates the extremity products industry. In this competitive environment, organizations utilize many market share positioning tactics to gain traction. Successful limb companies emphasize distinctive characteristics, technical improvements, and patient advantages. By offering customized replacements, sophisticated joint implants, and more comfortable designs, companies may get a competitive edge and attract a given market segment. Extremity products manufacturers require market segmentation to locate and satisfy client wants. Create targeted marketing programs to reach orthopedic specialists, rehabilitation experts, and buyers searching for hand or foot products. Companies that desire more market share typically expand globally. They may reach more clients by expanding and cooperating with international distributors. Entering new markets through effective alliances with healthcare providers and organizations is another option. These alliances create your presence in important locations. In the extreme products industry, competitive pricing is crucial. Businesses can determine prices using value-based pricing for luxury items and cost leadership for cheaper items. You must balance quality and pricing to serve a wide spectrum of patients. Build a strong brand and control your image to get market share. Companies invest in R&D, clinical investigations, and certifications to establish customer trust in healthcare providers. Positive word-of-mouth and recommendations boost market perception. Agreements, acquisitions, and partnerships can affect market share. Businesses may partner with research institutions or acquire innovative startups to expand their product line. These strategic efforts help us keep ahead of our competitors and give several solutions to difficult circumstances. Companies must invest in R&D to stay ahead in technology. Companies that use the latest materials and production processes to provide better limb products can attract physicians and patients to stay ahead of the competition. Understanding limb advantages is crucial for healthcare practitioners and end users. Offering extensive training, effective tools, and good customer service can help customers trust and remain with you. Business customers that are satisfied typically become brand influencers, giving them market power. New restrictions are constantly enacted to regulate extreme markets. Businesses who react to these developments and meet regulations demonstrate their commitment to client safety. By acquiring consumer and healthcare worker confidence due to their versatility, they can boost their market position.

    Market Summary

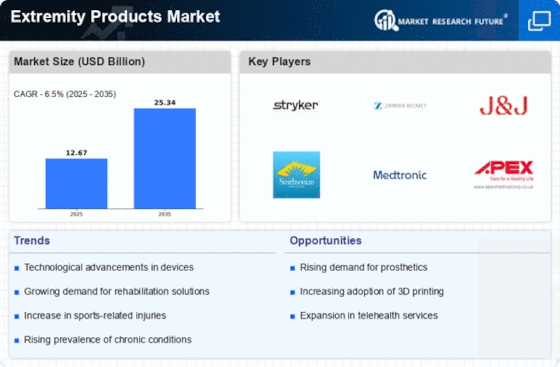
    As per Market Research Future Analysis, the Extremity Products Market was valued at 12.67 USD Billion in 2024 and is projected to grow to 25.34 USD Billion by 2035, with a CAGR of 6.50% from 2025 to 2035. The market is driven by the increasing prevalence of orthopedic diseases, an aging population, and rising incidences of sports-related injuries. The demand for extremity products is further fueled by advancements in materials and technology, including minimally invasive procedures and new product developments.

    Key Market Trends & Highlights

    The market is witnessing significant growth due to various factors.

    • Upper extremity segment led the market in 2022, driven by demand for surgical implants and joint replacements. Metallic materials held the largest market share in 2022, attributed to their strength and durability. North America dominated the market with a 45.80% share in 2022, supported by advanced healthcare infrastructure. Asia-Pacific is expected to register the fastest CAGR from 2023 to 2032, driven by an increasing elderly population.

    Market Size & Forecast

    2024 Market Size USD 12.67 Billion
    2035 Market Size USD 25.34 Billion
    CAGR (2025-2035) 6.50%
    Largest Regional Market Share in 2022 North America.

    Major Players

    <p>Key players include CONMED Corp., Smith &amp; Nephew plc, Stryker Corporation, Zimmer Biomet Holdings, Inc., depuy synthes, Integra LifeSciences Holdings Corporation, Wright Medical Group N.V., Acumed, Inc., Arthrex, Inc., and Skeletal Dynamics LLC.</p>

    Market Trends

    Increasing incidences of orthopedic conditions is driving the market growth

    The prevalence of orthopedic disorders such fractures from sports injuries and falls, spinal deformities, scoliosis, tendon injuries, and disc degeneration in the spine, hip, and shoulder are all on the rise, which is driving up demand for products related to the extremities worldwide. The elderly are more prone to fractures, and osteoporosis, a disorder marked by decreased bone density brought on by aging, is a major contributing cause. During the projected period, the demand for goods for the extremities is anticipated to increase due to the growing number of this population and the rising incidence of osteoporosis.

    Due to their involvement in sports and other physical activities, children are also more likely to get injuries. Orthopedic issues and sports injuries are being treated via the market for extremities items. The global market for extremity products is anticipated to expand as a result of this trend, which is anticipated to contribute to the rising demand for such items.

    The rapid growth in lifestyle-related diseases like obesity and diabetes, which further exacerbate joint problems, as well as the rising prevalence of joint illnesses including osteoarthritis and arthritis, are what are driving the global market for extremities reconstruction. The market for extremities reconstruction is anticipated to continue growing as patients' awareness of better treatment alternatives and their desire for a higher quality of life both rise.

    Demand is rising as a result of the development of new materials, advances in materials, and materials' non-intrusive properties. External fasteners are used to operate the diabetic foot, which increases its prominence. External fixators provide mechanical support to bones with structural flaws, enabling skeleton alignment. The market for trauma and extremities devices would expand as a result of the rising incidence of diabetic foot, which would raise the demand for external fixators.

    The market is also anticipated to be driven by changes in clinical practice patterns and technological advancements such as the use of stemless shoulder implants and minimally invasive procedures like ankle arthroplasty in place of ankle fusion, reversed shoulder implants in place of anatomical shoulders, and ankle arthroplasty as an alternative to ankle fusion. Thus, driving the Extremity Products market revenue.

    <p>The Global Extremity Products Market is poised for growth, driven by advancements in technology and an increasing prevalence of orthopedic conditions, which collectively enhance the demand for innovative solutions in extremity care.</p>

    U.S. Food and Drug Administration (FDA)

    Extremity Products Market Market Drivers

    Rising Incidence of Orthopedic Disorders

    The Global Extremity Products Market Industry is experiencing growth due to the increasing prevalence of orthopedic disorders. Conditions such as arthritis, fractures, and sports injuries are becoming more common, particularly among aging populations. For instance, the World Health Organization indicates that by 2024, the market is projected to reach 12.7 USD Billion, driven by the demand for effective treatment solutions. As the global population ages, the need for extremity products, including joint replacements and orthopedic braces, is likely to rise, further propelling market expansion. This trend suggests a sustained demand for innovative extremity solutions that cater to diverse patient needs.

    Market Segment Insights

    Extremity Products Product Insights

    <p>The market segments of Extremity Products, based on Product, includes upper extremity and lower extremity. In 2022, the upper extremity segment led the market for extremities products globally. External recovery splints, surgical implants, joint replacements, biologics, and external support implants are all options for treating injured or broken sections of the upper extremity. These factors will accelerate segment growth during the course of the forecast.</p>

    Extremity Products Material Insights

    <p>The Extremity Products Market segmentation, based on Material, includes metallic material, ceramic material, polymeric material, and natural material. In 2022, the segment for metallic materials held the biggest market share. This can be ascribed to people's predilection for and desire for strong metallic materials.</p>

    <p>Figure 1: Extremity Products Market, by Material, 2022 &amp; 2032 (USD Billion)</p>

    <p>Source: Secondary Research, Primary Research, Market Research Future Database and Analyst Review</p>

    Get more detailed insights about Extremity Products Market Research Report—Global Forecast till 2034

    Regional Insights

    By region, the study provides the market insights into North America, Europe, Asia-Pacific and Rest of the World. The North America Extremity Products Market dominated the global market in 2022 with 45.80% share. This is explained by a rise in vehicle accidents in the area and technological developments in items for the extremities. The availability of highly qualified personnel, the presence of a developed and well-equipped healthcare infrastructure, and the availability of broad healthcare insurance coverage.

    The expansion of the industry in North America is also being aided by the existence of institutions and organizations that offer educational programs on fractures and potential treatments. Further, the U.S. market of extremity products held the largest market share, and the Canada market of extremity products was the fastest growing market in the North America region.

    Further, the major countries studied in the market report are The US, Canada, German, France, the UK, Italy, Spain, China, Japan, India, Australia, South Korea, and Brazil.

    Figure 2: EXTREMITY PRODUCTS MARKET SHARE BY REGION 2022 (USD Billion)

    EXTREMITY PRODUCTS MARKET SHARE BY REGION

    Source: Secondary Research, Primary Research, Market Research Future Database and Analyst Review

    Europe Extremity Products market accounted for the significant market share in 2022. This can be ascribed to an increase in patients as a result of numerous traffic accidents and massive funding from the European Union. Rising rates of sports injuries, an aging population, and more health awareness are the main contributors to its high proportion. Further, the German market of extremity products held the largest market share, and the U.K market of extremity products was the fastest growing market in the European region

    The Asia Pacific Extremity Products market is expected to register fastest CAGR from 2023 to 2032. The increase in the elderly population, the expansion of the healthcare system, and the expansion of investment projects in the area are all contributing factors to this growth. The primary driver of regional growth is the increase in traffic accidents. High demand is being made possible by economic conditions and improving healthcare reforms. Additionally, it forces the development of less invasive, cost-effective biocompatible implants that are anatomically closer to their natural structure.

    Moreover, China’s market of extremity products held the largest market share, and the Indian market of extremity products was the fastest growing market in the Asia-Pacific region.

    Key Players and Competitive Insights

    Leading market players are investing heavily in research and development in order to expand their product lines, which will help the market of extremity products, grow even more. Market participants are also undertaking a variety of strategic activities to expand their global footprint, with important market developments including new product launches, contractual agreements, mergers and acquisitions, higher investments, and collaboration with other organizations. To expand and survive in a more competitive and rising market climate, Extremity Products industry must offer cost-effective items.

    Manufacturing locally to minimize operational costs is one of the key business tactics used by manufacturers in the global Extremity Products industry to benefit clients and increase the market sector. In recent years, the Extremity Products industry has offered some of the most significant advantages to medicine. Major players in the Extremity Products market, including CONMED Corp., Smith & Nephew plc, Stryker Corporation, Zimmer Biomet Holdings, Inc., depuy synthes, Integra LifeSciences Holdings Corporation, Wright Medical Group N.V., Acumed, Inc., Arthrex, Inc, and Skeletal Dynamics LLC., are attempting to increase market demand by investing in research and development operations.

    ConMed Corp (ConMed) is a manufacturer and seller of surgical tools and equipment for monitoring and minimally invasive operations. Arthroscopes, reconstructive systems, bronchoscopy tools, endoscopic ligator kits, stone-removal balloons, trocars, graspers, and scissors, suction irrigation tools, thermal tissue fusion systems, electrosurgical generators, smoke evacuation pencils, pencil sheaths, saws, and blades, endo mechanical instrumentation, and surgical visualization tools are some of the company's main products. 

    ConMed serves the markets for sports medicine, gastrointestinal, pulmonology, gastroenterology, general surgery, and gynecology. The business offers its goods directly to consumers and through distributors who specialize in the medical industry. It conducts business throughout the Asia-Pacific, Europe, the Middle East, and the Americas. ConMed's U.S. headquarters are in Florida. In August 2022, CONMED Corporation CNMD declared that it had successfully acquired the privately held start-up Biorez in a deal worth USD 85 million that was paid in cash.

    The development, production, and marketing of medical devices for use in orthopedic reconstruction and trauma, sports medicine, ENT, and advanced wound treatment are the main business activities of Smith & Nephew Plc (Smith & Nephew). The business provides robotics-assisted technologies, knee and hip implants to replace sick, worn, or damaged joints, trauma-related items to support fractures, and deformity repair operations. Additionally, it provides items for treating wounds as well as tools and materials for removing and repairing soft tissue. 

    Surgeons, nurses, nurse specialists, doctors, general practitioners, buying staff at hospitals, and health insurers are among the groups to which Smith & Nephew makes its goods available. The company sells its goods across Africa, the Middle East, Asia-Pacific, Europe, and North America. The UK's Hertfordshire county of Watford is home to Smith & Nephew's headquarters. Smith+Nephew stated in September 2020 that it has reached an agreement to pay USD 240 million for Integra LifeSciences Holdings Corporation's Extremity Orthopaedics business. The acquisition will aid Smith+Nephew's plan to invest in markets with faster growth.

    Key Companies in the Extremity Products Market market include

    Industry Developments

    June 2022 In2Bones Global Inc., a privately held company, has been acquired by CONMED Corporation, according to a statement.

    January 2022 The innovative Tornier Perform® Patient-Matched Primary Reversed Glenoid (Patient-Matched Glenoid), from one of the top manufacturers of medical equipment, was utilized in a surgical procedure for the first time, according to a statement from Stryker.

    Future Outlook

    Extremity Products Market Future Outlook

    <p>The Global Extremity Products Market is projected to grow at a 6.50% CAGR from 2025 to 2035, driven by technological advancements, increasing orthopedic procedures, and rising geriatric populations.</p>

    New opportunities lie in:

    • <p>Develop innovative 3D-printed prosthetics to enhance customization and reduce production costs. Expand telehealth services for remote monitoring of extremity rehabilitation. Invest in AI-driven analytics for personalized treatment plans in extremity care.</p>

    <p>By 2035, the market is expected to achieve substantial growth, positioning itself as a leader in orthopedic solutions.</p>

    Market Segmentation

    Extremity Products Product Outlook

    • Upper Extremity
    • Lower Extremity

    Extremity Products Material Outlook

    • Metallic Material
    • Ceramic Material
    • Polymeric Material
    • Natural Material

    Extremity Products Regional Outlook

    • {""=>["US"
    • "Canada"]}
    • {""=>["Germany"
    • "France"
    • "UK"
    • "Italy"
    • "Spain"
    • "Rest of Europe"]}
    • {""=>["China"
    • "Japan"
    • "India"
    • "Australia"
    • "South Korea"
    • "Rest of Asia-Pacific"]}
    • {""=>["Middle East"
    • "Africa"
    • "Latin America"]}

    Report Scope

    Report Attribute/Metric Details
    Market Size 2024   12.67 (USD Billion)
    Market Size 2025   13.50 (USD Billion)
    Market Size 2035 25.34 (USD Billion)
    Compound Annual Growth Rate (CAGR) 6.50% (2025 - 2035)
    Report Coverage Revenue Forecast, Competitive Landscape, Growth Factors, and Trends
    Base Year 2024
    Market Forecast Period 2025 - 2035
    Historical Data 2020 - 2024
    Report Coverage Revenue Forecast, Market Competitive Landscape, Growth Factors, and Trends
    Segments Covered Product, Material, and Region
    Geographies Covered North America, Europe, Asia Pacific, and the Rest of the World
    Countries Covered The US, Canada, German, France, UK, Italy, Spain, China, Japan, India, Australia, South Korea, and Brazil
    Key Companies Profiled CONMED Corp., Smith & Nephew plc, Stryker Corporation, Zimmer Biomet Holdings, Inc., depuy synthes, Integra LifeSciences Holdings Corporation, Wright Medical Group N.V., Acumed, Inc., Arthrex, Inc, and Skeletal Dynamics LLC
    Key Market Opportunities Technological advancements
    Key Market Dynamics Increasing incidence of orthopedic conditions such as fractures caused by sports injuries and falls, spinal deformities, scoliosis, tendon injuries, as well as degeneration of the disc in areas like the spine, hip, and shoulder and growing proportion of ageing population

    Market Highlights

    Author

    Rahul Gotadki
    Assistant Manager

    She holds an experience of about 6+ years in market research and business consulting, working under the spectrum of information communication technology, telecommunications and semiconductor domains. aarti conceptualizes and implements a scalable business strategy and provides strategic leadership to the clients. her expertise lies in market estimation, competitive intelligence, pipeline analysis, customer assessment, etc.

    Leave a Comment

    Latest Comments

    John Doe
    john@example.com

    This is a great article! Really helped me understand the topic better.

    Posted on July 23, 2025, 10:15 AM
    Jane Smith
    jane@domain.com

    Thanks for sharing this. I’ve bookmarked it for later reference.

    Posted on July 22, 2025, 7:45 PM

    FAQs

    How much is the Extremity Products market?

    The Extremity Products Market size was valued at USD 11.2 Billion in 2022.

    What is the growth rate of the Extremity Products market?

    The global market is projected to grow at a CAGR of 6.50% during the forecast period, 2023-2032.

    Which region held the largest market share in the Extremity Products market?

    North America had the largest share in the global market

    Who are the key players in the Extremity Products market?

    The key players in the market are CONMED Corp., Smith &amp; Nephew plc, Stryker Corporation, Zimmer Biomet Holdings, Inc., depuy synthes, Integra LifeSciences Holdings Corporation, Wright Medical Group N.V., Acumed, Inc., Arthrex, Inc, and Skeletal Dynamics LLC

    Which Product led the Extremity Products market?

    The Upper Extremity Product dominated the market in 2022.

    Which Material had the largest market share in the Extremity Products market?

    The Metallic Material had the largest share in the global market.

    1. Table of Contents
    2. Executive Summary
    3. Market Introduction
      1. Definition
      2. Scope of the Study
        1. Research Objective
        2. Assumptions
        3. Limitations 
    4. Research Methodology
      1. Overview
      2. Data Mining
      3. Secondary Research
      4. Primary Research
        1. Primary Interviews and Information Gathering Process
        2. Breakdown of Primary Respondents 
      5. Forecasting Model
      6. Market Size Estimation
        1. Bottom-up Approach
        2. Top-Down Approach
      7. Data Triangulation
      8. Validation
    5. MARKET DYNAMICS
      1. Overview
      2. Drivers
      3. Restraints
      4. Opportunities
    6. MARKET FACTOR ANALYSIS
      1. Value Chain Analysis
      2. Porter’s Five Forces Analysis
        1. Bargaining Power of Suppliers
        2. Bargaining Power of Buyers
        3. Threat of New Entrants
        4. Threat of Substitutes
        5. Intensity of Rivalry
      3. COVID-19 Impact Analysis 
        1. Market Impact Analysis
        2. Regional Impact
        3. Opportunity and Threat Analysis
    7. GLOBAL EXTREMITY PRODUCTS MARKET, BY PRODUCT
      1. Overview
      2. Upper Extremity
      3. Lower Extremity
    8. GLOBAL EXTREMITY PRODUCTS MARKET, BY MATERIAL
      1. Overview
      2. Metallic Material
      3. Ceramic Material
      4. Polymeric Material
      5. Natural Material
    9. GLOBAL EXTREMITY PRODUCTS MARKET, BY REGION
      1. Overview
      2. North America
        1. U.S.
        2. Canada
      3. Europe
        1. Germany
        2. France
        3. U.K
        4. Italy
        5. Spain
        6. Rest of Europe
      4. Asia-Pacific
        1. China
        2. India
        3. Japan
        4. South Korea
        5. Australia
        6. Rest of Asia-Pacific
      5. Rest of the World
        1. Middle East
        2. Africa
        3. Latin America
    10. Competitive Landscape
      1. Overview 
      2. Competitive Analysis
      3. Market Share Analysis
      4. Major Growth Strategy in the Global Extremity Products Market,
      5. Competitive Benchmarking
      6. Leading Players in Terms of Number of Developments in the Global Extremity Products Market,
      7. Key developments and Growth Strategies
        1. New Product Launch/Material Deployment
        2. Merger & Acquisitions
        3. Joint Ventures
      8. Major Players Financial Matrix 
        1. Sales & Operating Income, 2022
        2. Major Players R&D Expenditure. 2022
    11. COMPANY PROFILES
      1. CONMED Corp.
        1. Company Overview
        2. Financial Overview
        3. Products Offered
        4. Key Developments
        5. SWOT Analysis
        6. Key Strategies
      2. SMITH & NEPHEW PLC
        1. Company Overview
        2. Financial Overview
        3. Products Offered
        4. Key Developments
        5. SWOT Analysis
        6. Key Strategies
      3. Stryker Corporation
        1. Company Overview
        2. Financial Overview
        3. Products Offered
        4. Key Developments
        5. SWOT Analysis
        6. Key Strategies
      4. Zimmer Biomet Holdings, Inc.
        1. Company Overview
        2. Financial Overview
        3. Products Offered
        4. Key Developments
        5. SWOT Analysis
        6. Key Strategies
      5. depuy synthes
        1. Company Overview
        2. Financial Overview
        3. Products Offered
        4. Key Developments
        5. SWOT Analysis
        6. Key Strategies
      6. Integra LifeSciences Holdings Corporation
        1. Company Overview
        2. Financial Overview
        3. Products Offered
        4. Key Developments
        5. SWOT Analysis
        6. Key Strategies
      7. Wright Medical Group N.V.
        1. Company Overview
        2. Financial Overview
        3. Products Offered
        4. Key Developments
        5. SWOT Analysis
        6. Key Strategies
      8. Acumed, Inc.
        1. Company Overview
        2. Financial Overview
        3. Products Offered
        4. Key Developments
        5. SWOT Analysis
        6. Key Strategies
      9. Arthrex, Inc
        1. Company Overview
        2. Financial Overview
        3. Products Offered
        4. Key Developments
        5. SWOT Analysis
        6. Key Strategies
    12. APPENDIX
      1. References
      2. Related Reports
    13. List of Tables and Figures
      1. LIST OF TABLES
      2. TABLE 1 GLOBAL EXTREMITY PRODUCTS MARKET, SYNOPSIS, 2018-2032
      3. TABLE 2 GLOBAL EXTREMITY PRODUCTS MARKET, ESTIMATES & FORECAST, 2018-2032 (USD BILLION)
      4. TABLE 3 GLOBAL EXTREMITY PRODUCTS MARKET, BY PRODUCT, 2018-2032 (USD BILLION)
      5. TABLE 4 GLOBAL EXTREMITY PRODUCTS MARKET, BY MATERIAL, 2018-2032 (USD BILLION)
      6. TABLE 5 NORTH AMERICA EXTREMITY PRODUCTS MARKET, BY PRODUCT, 2018-2032 (USD BILLION)
      7. TABLE 6 NORTH AMERICA EXTREMITY PRODUCTS MARKET, BY MATERIAL, 2018-2032 (USD BILLION)
      8. TABLE 7 NORTH AMERICA EXTREMITY PRODUCTS MARKET, BY COUNTRY, 2018-2032 (USD BILLION)
      9. TABLE 8 U.S. EXTREMITY PRODUCTS MARKET, BY PRODUCT, 2018-2032 (USD BILLION)
      10. TABLE 9 U.S. EXTREMITY PRODUCTS MARKET, BY MATERIAL, 2018-2032 (USD BILLION)
      11. TABLE 10 CANADA EXTREMITY PRODUCTS MARKET, BY PRODUCT, 2018-2032 (USD BILLION)
      12. TABLE 11 CANADA EXTREMITY PRODUCTS MARKET, BY MATERIAL, 2018-2032 (USD BILLION)
      13. TABLE 12 EUROPE EXTREMITY PRODUCTS MARKET, BY PRODUCT, 2018-2032 (USD BILLION)
      14. TABLE 13 EUROPE EXTREMITY PRODUCTS MARKET, BY MATERIAL, 2018-2032 (USD BILLION)
      15. TABLE 14 EUROPE EXTREMITY PRODUCTS MARKET, BY COUNTRY, 2018-2032 (USD BILLION)
      16. TABLE 15 GERMANY EXTREMITY PRODUCTS MARKET, BY PRODUCT, 2018-2032 (USD BILLION)
      17. TABLE 16 GERMANY EXTREMITY PRODUCTS MARKET, BY MATERIAL, 2018-2032 (USD BILLION)
      18. TABLE 17 FRANCE EXTREMITY PRODUCTS MARKET, BY PRODUCT, 2018-2032 (USD BILLION)
      19. TABLE 18 FRANCE EXTREMITY PRODUCTS MARKET, BY MATERIAL, 2018-2032 (USD BILLION)
      20. TABLE 19 ITALY EXTREMITY PRODUCTS MARKET, BY PRODUCT, 2018-2032 (USD BILLION)
      21. TABLE 20 ITALY EXTREMITY PRODUCTS MARKET, BY MATERIAL, 2018-2032 (USD BILLION)
      22. TABLE 21 SPAIN EXTREMITY PRODUCTS MARKET, BY PRODUCT, 2018-2032 (USD BILLION)
      23. TABLE 22 SPAIN EXTREMITY PRODUCTS MARKET, BY MATERIAL, 2018-2032 (USD BILLION)
      24. TABLE 23 U.K EXTREMITY PRODUCTS MARKET, BY PRODUCT, 2018-2032 (USD BILLION)
      25. TABLE 24 U.K EXTREMITY PRODUCTS MARKET, BY MATERIAL, 2018-2032 (USD BILLION)
      26. TABLE 25 REST OF EUROPE EXTREMITY PRODUCTS MARKET, BY PRODUCT, 2018-2032 (USD BILLION)
      27. TABLE 26 REST OF EUROPE EXTREMITY PRODUCTS MARKET, BY MATERIAL, 2018-2032 (USD BILLION)
      28. TABLE 27 ASIA PACIFIC EXTREMITY PRODUCTS MARKET, BY PRODUCT, 2018-2032 (USD BILLION)
      29. TABLE 28 ASIA PACIFIC EXTREMITY PRODUCTS MARKET, BY MATERIAL, 2018-2032 (USD BILLION)
      30. TABLE 29 ASIA PACIFIC EXTREMITY PRODUCTS MARKET, BY COUNTRY, 2018-2032 (USD BILLION)
      31. TABLE 30 JAPAN EXTREMITY PRODUCTS MARKET, BY PRODUCT, 2018-2032 (USD BILLION)
      32. TABLE 31 JAPAN EXTREMITY PRODUCTS MARKET, BY MATERIAL, 2018-2032 (USD BILLION)
      33. TABLE 32 CHINA EXTREMITY PRODUCTS MARKET, BY PRODUCT, 2018-2032 (USD BILLION)
      34. TABLE 33 CHINA EXTREMITY PRODUCTS MARKET, BY MATERIAL, 2018-2032 (USD BILLION)
      35. TABLE 34 INDIA EXTREMITY PRODUCTS MARKET, BY PRODUCT, 2018-2032 (USD BILLION)
      36. TABLE 35 INDIA EXTREMITY PRODUCTS MARKET, BY MATERIAL, 2018-2032 (USD BILLION)
      37. TABLE 36 AUSTRALIA EXTREMITY PRODUCTS MARKET, BY PRODUCT, 2018-2032 (USD BILLION)
      38. TABLE 37 AUSTRALIA EXTREMITY PRODUCTS MARKET, BY MATERIAL, 2018-2032 (USD BILLION)
      39. TABLE 38 SOUTH KOREA EXTREMITY PRODUCTS MARKET, BY PRODUCT, 2018-2032 (USD BILLION)
      40. TABLE 39 SOUTH KOREA EXTREMITY PRODUCTS MARKET, BY MATERIAL, 2018-2032 (USD BILLION)
      41. TABLE 40 REST OF ASIA-PACIFIC EXTREMITY PRODUCTS MARKET, BY PRODUCT, 2018-2032 (USD BILLION)
      42. TABLE 41 REST OF ASIA-PACIFIC EXTREMITY PRODUCTS MARKET, BY MATERIAL, 2018-2032 (USD BILLION)
      43. TABLE 42 REST OF WORLD EXTREMITY PRODUCTS MARKET, BY PRODUCT, 2018-2032 (USD BILLION)
      44. TABLE 43 REST OF WORLD EXTREMITY PRODUCTS MARKET, BY MATERIAL, 2018-2032 (USD BILLION)
      45. TABLE 44 REST OF WORLD EXTREMITY PRODUCTS MARKET, BY COUNTRY, 2018-2032 (USD BILLION)
      46. TABLE 45 MIDDLE EAST EXTREMITY PRODUCTS MARKET, BY PRODUCT, 2018-2032 (USD BILLION)
      47. TABLE 46 MIDDLE EAST EXTREMITY PRODUCTS MARKET, BY MATERIAL, 2018-2032 (USD BILLION)
      48. TABLE 47 AFRICA EXTREMITY PRODUCTS MARKET, BY PRODUCT, 2018-2032 (USD BILLION)
      49. TABLE 48 AFRICA EXTREMITY PRODUCTS MARKET, BY MATERIAL, 2018-2032 (USD BILLION)
      50. TABLE 49 LATIN AMERICA EXTREMITY PRODUCTS MARKET, BY PRODUCT, 2018-2032 (USD BILLION)
      51. TABLE 50 LATIN AMERICA EXTREMITY PRODUCTS MARKET, BY MATERIAL, 2018-2032 (USD BILLION)   LIST OF FIGURES
      52. FIGURE 1 RESEARCH PROCESS
      53. FIGURE 2 MARKET STRUCTURE FOR THE GLOBAL EXTREMITY PRODUCTS MARKET
      54. FIGURE 3 MARKET DYNAMICS FOR THE GLOBAL EXTREMITY PRODUCTS MARKET
      55. FIGURE 4 GLOBAL EXTREMITY PRODUCTS MARKET, SHARE (%), BY PRODUCT, 2022
      56. FIGURE 5 GLOBAL EXTREMITY PRODUCTS MARKET, SHARE (%), BY MATERIAL, 2022
      57. FIGURE 6 GLOBAL EXTREMITY PRODUCTS MARKET, SHARE (%), BY REGION, 2022
      58. FIGURE 7 NORTH AMERICA: EXTREMITY PRODUCTS MARKET, SHARE (%), BY REGION, 2022
      59. FIGURE 8 EUROPE: EXTREMITY PRODUCTS MARKET, SHARE (%), BY REGION, 2022
      60. FIGURE 9 ASIA-PACIFIC: EXTREMITY PRODUCTS MARKET, SHARE (%), BY REGION, 2022
      61. FIGURE 10 REST OF THE WORLD: EXTREMITY PRODUCTS MARKET, SHARE (%), BY REGION, 2022 
      62. FIGURE 11 GLOBAL EXTREMITY PRODUCTS MARKET: COMPANY SHARE ANALYSIS, 2022 (%)
      63. FIGURE 12 CONMED CORP.: FINANCIAL OVERVIEW SNAPSHOT
      64. FIGURE 13 CONMED CORP.: SWOT ANALYSIS 
      65. FIGURE 14 SMITH & NEPHEW PLC: FINANCIAL OVERVIEW SNAPSHOT
      66. FIGURE 15 SMITH & NEPHEW PLC: SWOT ANALYSIS
      67. FIGURE 16 STRYKER CORPORATION: FINANCIAL OVERVIEW SNAPSHOT
      68. FIGURE 17 STRYKER CORPORATION: SWOT ANALYSIS
      69. FIGURE 18 ZIMMER BIOMET HOLDINGS, INC.: FINANCIAL OVERVIEW SNAPSHOT
      70. FIGURE 19 ZIMMER BIOMET HOLDINGS, INC.: SWOT ANALYSIS
      71. FIGURE 20 DEPUY SYNTHES.: FINANCIAL OVERVIEW SNAPSHOT
      72. FIGURE 21 DEPUY SYNTHES.: SWOT ANALYSIS 
      73. FIGURE 22 INTEGRA LIFESCIENCES HOLDINGS CORPORATION: FINANCIAL OVERVIEW SNAPSHOT
      74. FIGURE 23 INTEGRA LIFESCIENCES HOLDINGS CORPORATION: SWOT ANALYSIS
      75. FIGURE 24 WRIGHT MEDICAL GROUP N.V.: FINANCIAL OVERVIEW SNAPSHOT
      76. FIGURE 25 WRIGHT MEDICAL GROUP N.V.: SWOT ANALYSIS
      77. FIGURE 26 ACUMED, INC.: FINANCIAL OVERVIEW SNAPSHOT
      78. FIGURE 27 ACUMED, INC.: SWOT ANALYSIS
      79. FIGURE 28 ARTHREX, INC: FINANCIAL OVERVIEW SNAPSHOT
      80. FIGURE 29 ARTHREX, INC: SWOT ANALYSIS

    Extremity Products Market Segmentation

    Extremity Products Product Outlook (USD Billion, 2018-2032)

    Upper Extremity

    Lower Extremity

    Extremity Products Material Outlook (USD Billion, 2018-2032)

    Metallic Material

    Ceramic Material

    Polymeric Material

    Natural Material

    Extremity Products Regional Outlook (USD Billion, 2018-2032)

    North America Outlook (USD Billion, 2018-2032)

    Extremity Products by Product

    Upper Extremity

    Lower Extremity

    Extremity Products by Material

    Metallic Material

    Ceramic Material

    Polymeric Material

    Natural Material

    US Outlook (USD Billion, 2018-2032)

    Extremity Products by Product

    Upper Extremity

    Lower Extremity

    Extremity Products by Material

    Metallic Material

    Ceramic Material

    Polymeric Material

    Natural Material

    Canada Outlook (USD Billion, 2018-2032)

    Extremity Products by Product

    Upper Extremity

    Lower Extremity

    Extremity Products by Material

    Metallic Material

    Ceramic Material

    Polymeric Material

    Natural Material

    Europe Outlook (USD Billion, 2018-2032)

    Extremity Products by Product

    Upper Extremity

    Lower Extremity

    Extremity Products by Material

    Metallic Material

    Ceramic Material

    Polymeric Material

    Natural Material

    Germany Outlook (USD Billion, 2018-2032)

    Extremity Products by Product

    Upper Extremity

    Lower Extremity

    Extremity Products by Material

    Metallic Material

    Ceramic Material

    Polymeric Material

    Natural Material

    France Outlook (USD Billion, 2018-2032)

    Extremity Products by Product

    Upper Extremity

    Lower Extremity

    Extremity Products by Material

    Metallic Material

    Ceramic Material

    Polymeric Material

    Natural Material

    UK Outlook (USD Billion, 2018-2032)

    Extremity Products by Product

    Upper Extremity

    Lower Extremity

    Extremity Products by Material

    Metallic Material

    Ceramic Material

    Polymeric Material

    Natural Material

    Italy Outlook (USD Billion, 2018-2032)

    Extremity Products by Product

    Upper Extremity

    Lower Extremity

    Extremity Products by Material

    Metallic Material

    Ceramic Material

    Polymeric Material

    Natural Material

    Spain Outlook (USD Billion, 2018-2032)

    Extremity Products by Product

    Upper Extremity

    Lower Extremity

    Extremity Products by Material

    Metallic Material

    Ceramic Material

    Polymeric Material

    Natural Material

    Rest Of Europe Outlook (USD Billion, 2018-2032)

    Extremity Products by Product

    Upper Extremity

    Lower Extremity

    Extremity Products by Material

    Metallic Material

    Ceramic Material

    Polymeric Material

    Natural Material

    Asia-Pacific Outlook (USD Billion, 2018-2032)

    Extremity Products by Product

    Upper Extremity

    Lower Extremity

    Extremity Products by Material

    Metallic Material

    Ceramic Material

    Polymeric Material

    Natural Material

    China Outlook (USD Billion, 2018-2032)

    Extremity Products by Product

    Upper Extremity

    Lower Extremity

    Extremity Products by Material

    Metallic Material

    Ceramic Material

    Polymeric Material

    Natural Material

    Japan Outlook (USD Billion, 2018-2032)

    Extremity Products by Product

    Upper Extremity

    Lower Extremity

    Extremity Products by Material

    Metallic Material

    Ceramic Material

    Polymeric Material

    Natural Material

    India Outlook (USD Billion, 2018-2032)

    Extremity Products by Product

    Upper Extremity

    Lower Extremity

    Extremity Products by Material

    Metallic Material

    Ceramic Material

    Polymeric Material

    Natural Material

    Australia Outlook (USD Billion, 2018-2032)

    Extremity Products by Product

    Upper Extremity

    Lower Extremity

    Extremity Products by Material

    Metallic Material

    Ceramic Material

    Polymeric Material

    Natural Material

    Rest of Asia-Pacific Outlook (USD Billion, 2018-2032)

    Extremity Products by Product

    Upper Extremity

    Lower Extremity

    Extremity Products by Material

    Metallic Material

    Ceramic Material

    Polymeric Material

    Natural Material

    Rest of the World Outlook (USD Billion, 2018-2032)

    Extremity Products by Product

    Upper Extremity

    Lower Extremity

    Extremity Products by Material

    Metallic Material

    Ceramic Material

    Polymeric Material

    Natural Material

    Middle East Outlook (USD Billion, 2018-2032)

    Extremity Products by Product

    Upper Extremity

    Lower Extremity

    Extremity Products by Material

    Metallic Material

    Ceramic Material

    Polymeric Material

    Natural Material

    Africa Outlook (USD Billion, 2018-2032)

    Extremity Products by Product

    Upper Extremity

    Lower Extremity

    Extremity Products by Material

    Metallic Material

    Ceramic Material

    Polymeric Material

    Natural Material

    Latin America Outlook (USD Billion, 2018-2032)

    Extremity Products by Product

    Upper Extremity

    Lower Extremity

    Extremity Products by Material

    Metallic Material

    Ceramic Material

    Polymeric Material

    Natural Material

    Infographic

    Free Sample Request

    Kindly complete the form below to receive a free sample of this Report

    Get Free Sample

    Customer Strories

    “I am very pleased with how market segments have been defined in a relevant way for my purposes (such as "Portable Freezers & refrigerators" and "last-mile"). In general the report is well structured. Thanks very much for your efforts.”

    Victoria Milne

    Founder
    Case Study
    Chemicals and Materials