Europe Transformer Market (2026 - 2035)

ID: MRFR/EnP/14637-HCR 128 Pages Garvit Vyas Last Updated: October 07, 2026
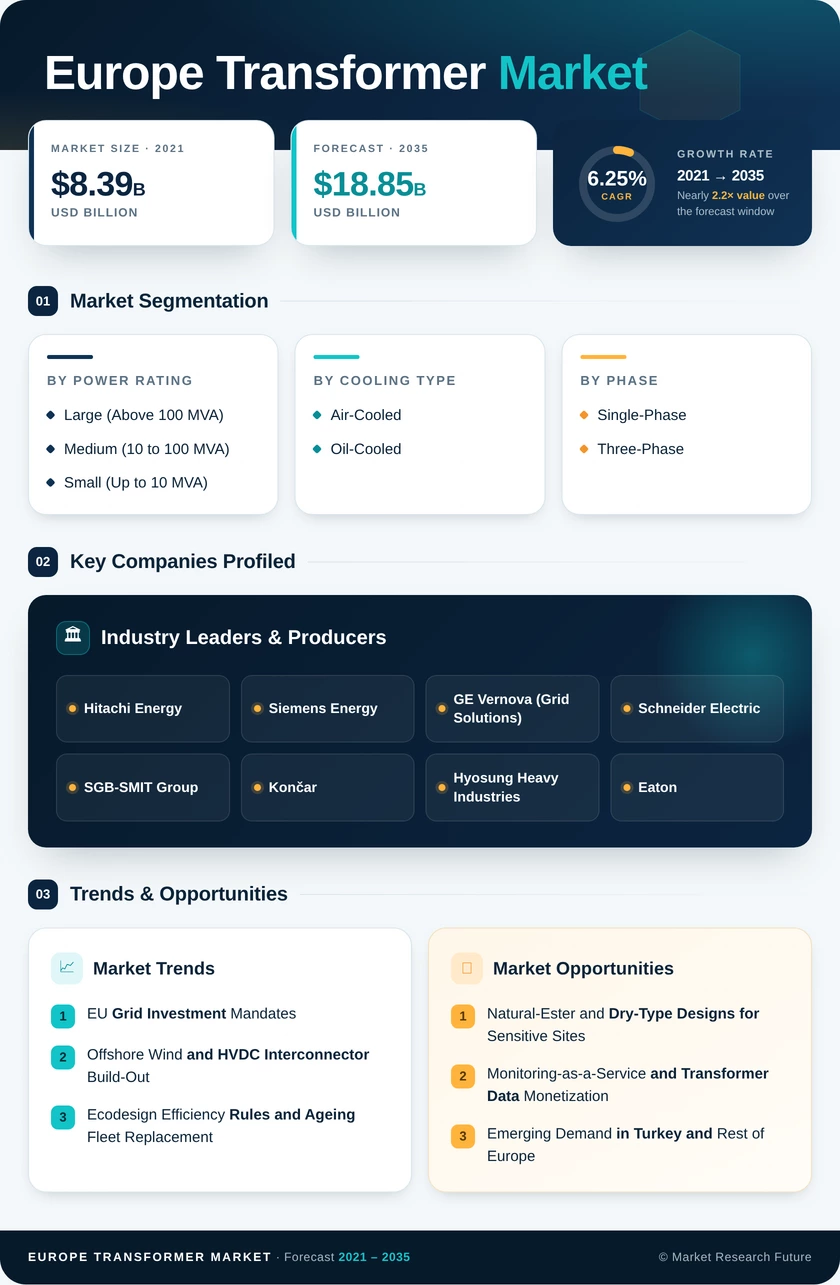
Europe Transformer Market Research Report By Power Rating (Large (Above 100 MVA), Medium (10 to 100 MVA), Small (Up to 10 MVA)), By Cooling Type (Air-Cooled, Oil-Cooled), By Phase (Single-Phase, Three-Phase), By Transformer Type (Power, Distribution), By End-User (Power Utilities, Industrial, Commercial, Residential) - Forecast to 2035
Europe Transformer Market
Market Size
Forecast Period2026-2035
CAGR (2026-2035)6.25%
2025 Market SizeUSD 10.24 Billion
2035 Market SizeUSD 18.85 Billion
Key Players
Hitachi Energy
Siemens Energy
GE Vernova
Schneider Electric
SGB-SMIT Group
Končar
Opportunities
  • Natural-Ester and Dry-Type Designs for Sensitive Sites
  • Monitoring-as-a-Service and Transformer Data Monetization
  • Emerging Demand in Turkey and Rest of Europe
  1. 1 Market Summary | |
  2. 2 Key Report Takeaways | |
    1. 2.1 By Power Rating | |
    2. 2.2 By Cooling Type | |
    3. 2.3 By Phase | |
    4. 2.4 By Transformer Type | |
    5. 2.5 By End-User | |
    6. 2.6 By Region | |
  3. 3 Market Size and Forecast (2021–2035) | |
    1. 3.1 Historical Market Size (2021–2025) | |
    2. 3.2 Forecast Market Size (2026–2035) | |
    3. 3.3 Year-over-Year Growth Analysis | |
  4. 4 Driver Impact Analysis | |
    1. 4.1 EU Grid Investment Mandates | |
    2. 4.2 Offshore Wind and HVDC Interconnector Build-Out | |
    3. 4.3 Ecodesign Efficiency Rules and Ageing Fleet Replacement | |
    4. 4.4 Electrification of Heat and Transport | |
    5. 4.5 Data Center and Industrial Load Growth | |
    6. 4.6 Utility-Scale Solar and Storage Connections | |
    7. 4.7 Cross-Border Interconnection Targets | |
  5. 5 Restraints Impact Analysis | |
    1. 5.1 Factory Capacity and Extended Lead Times | |
    2. 5.2 Electrical Steel and Copper Price Volatility | |
    3. 5.3 Skilled Workforce Shortages | |
    4. 5.4 Grid Permitting Delays | |
    5. 5.5 Sanctions and Trade Fragmentation | |
  6. 6 Opportunities | |
    1. 6.1 Natural-Ester and Dry-Type Designs for Sensitive Sites | |
    2. 6.2 Monitoring-as-a-Service and Transformer Data Monetization | |
    3. 6.3 Emerging Demand in Turkey and Rest of Europe | |
    4. 6.4 Retrofit, Refurbishment and Lifecycle Services | |
    5. 6.5 Localized Capacity under the Net-Zero Industry Act | |
  7. 7 Regional Market Share and Country-Level Analysis | |
    1. 7.1 Germany | |
    2. 7.2 United Kingdom | |
    3. 7.3 France | |
    4. 7.4 Spain | |
    5. 7.5 NORDIC Countries | |
    6. 7.6 Turkey | |
    7. 7.7 Russia | |
    8. 7.8 Rest of Europe | |
  8. 8 Future Outlook (2026–2035) | |
    1. 8.1 Digital, Sensor-Rich Transformer Fleets | |
    2. 8.2 Offshore Grids and HVDC Scale-Up | |
    3. 8.3 The Electrification Supercycle | |
    4. 8.4 Low-Carbon Materials and Sustainability Reporting | |
  9. 9 Segmentation Analysis | |
    1. 9.1 By Power Rating | | |
      1. 9.1.1 Large (Above 100 MVA) | | |
      2. 9.1.2 Medium (10 to 100 MVA) | | |
      3. 9.1.3 Small (Up to 10 MVA) | |
    2. 9.2 By Cooling Type | | |
      1. 9.2.1 Air-Cooled | | |
      2. 9.2.2 Oil-Cooled | |
    3. 9.3 By Phase | | |
      1. 9.3.1 Single-Phase | | |
      2. 9.3.2 Three-Phase | |
    4. 9.4 By Transformer Type | | |
      1. 9.4.1 Power | | |
      2. 9.4.2 Distribution | |
    5. 9.5 By End-User | | |
      1. 9.5.1 Power Utilities | | |
      2. 9.5.2 Industrial | | |
      3. 9.5.3 Commercial | | |
      4. 9.5.4 Residential | |
  10. 10 Competitive Landscape | |
    1. 10.1 Market Concentration Analysis | |
    2. 10.2 Competitive Benchmarking Matrix | |
    3. 10.3 Company Profiles | | |
      1. 10.3.1 Hitachi Energy | | |
      2. 10.3.2 Siemens Energy | | |
      3. 10.3.3 GE Vernova (Grid Solutions) | | |
      4. 10.3.4 Schneider Electric | | |
      5. 10.3.5 SGB-SMIT Group | | |
      6. 10.3.6 Končar | | |
      7. 10.3.7 Hyosung Heavy Industries | | |
      8. 10.3.8 Eaton | | |
      9. 10.3.9 Ormazabal (Velatia) | | |
      10. 10.3.10 Elsewedy Electric | |
  11. 11 Recent News & Developments | |
  12. 12 Report Scope and Methodology | |
  13. 13 Detailed Sources and Citations | |
  14. 14 Frequently Asked Questions (FAQs) | | LIST OF TABLES | |
  15. TABLE 1 Market Snapshot – Key Metrics, 2025–2035 | |
  16. TABLE 2 Market Size & Forecast, by Revenue (USD Billion), 2021–2035 | |
  17. TABLE 3 Driver Impact Analysis | |
  18. TABLE 4 Restraints Impact Analysis | |
  19. TABLE 5 Regional Summary, by Geography, 2025 | |
  20. TABLE 6 Germany – Demand by Segment, 2025 | |
  21. TABLE 7 United Kingdom – Demand by Segment, 2025 | |
  22. TABLE 8 France – Demand by Segment, 2025 | |
  23. TABLE 9 Spain – Demand by Segment, 2025 | |
  24. TABLE 10 NORDIC Countries – Demand by Segment, 2025 | |
  25. TABLE 11 Turkey – Demand by Segment, 2025 | |
  26. TABLE 12 Russia – Demand by Segment, 2025 | |
  27. TABLE 13 Rest of Europe – Demand by Segment, 2025 | |
  28. TABLE 14 Market Size, by Power Rating, 2021–2035 (USD Billion) | |
  29. TABLE 15 Market Size, by Cooling Type, 2021–2035 (USD Billion) | |
  30. TABLE 16 Market Size, by Phase, 2021–2035 (USD Billion) | |
  31. TABLE 17 Market Size, by Transformer Type, 2021–2035 (USD Billion) | |
  32. TABLE 18 Market Size, by End-User, 2021–2035 (USD Billion) | |
  33. TABLE 19 Competitive Benchmarking Matrix, 2025 | |
  34. TABLE 20 Report Scope and Methodology | |
  35. TABLE 21 Detailed Sources and Citations | |
  36. TABLE 22 Segmentation Quick Reference | | LIST OF FIGURES | |
  37. FIGURE 1 Market Dynamics Overview – Drivers, Restraints and Opportunities | |
  38. FIGURE 2 Industry Value Chain Analysis | |
  39. FIGURE 3 Porter's Five Forces Analysis | |
  40. FIGURE 4 Market Size Trend, 2021–2035 (USD Billion) | |
  41. FIGURE 5 Market Share, by Power Rating, 2025 | |
  42. FIGURE 6 Market Share, by Cooling Type, 2025 | |
  43. FIGURE 7 Market Share, by Phase, 2025 | |
  44. FIGURE 8 Market Share, by Transformer Type, 2025 | |
  45. FIGURE 9 Market Share, by End-User, 2025 | |
  46. FIGURE 10 Regional Market Share, by Geography, 2025 | |
  47. FIGURE 11 Regional Growth Comparison, 2026–2035 CAGR | |
  48. FIGURE 12 Competitive Landscape – Estimated Revenue Share Ranges, 2025 | |
  49. FIGURE 13 Company Strategic Positioning Matrix

Segmentation Quick Reference

DimensionSub-SegmentsDominant SegmentFastest Growing Segment
By Power RatingLarge (Above 100 MVA), Medium (10 to 100 MVA), Small (Up to 10 MVA)Medium (10 to 100 MVA) – 41.8% shareLarge (Above 100 MVA) – 8.15% CAGR
By Cooling TypeAir-Cooled, Oil-CooledOil-Cooled – 63.1% shareAir-Cooled – 7.2% CAGR
By PhaseSingle-Phase, Three-PhaseThree-Phase – 71.5% shareThree-Phase – 71.5% share (outpaces Single-Phase at 4.9% CAGR)
By Transformer TypePower, DistributionPower – USD 5.58 BillionDistribution – 6.6% CAGR
By End-UserPower Utilities (Renewables, Non-renewables, T&D), Industrial, Commercial, ResidentialPower Utilities – 61.4% shareCommercial – 7.6% CAGR
By RegionGermany, United Kingdom, France, Spain, NORDIC Countries, Turkey, Russia, Rest of EuropeGermany – 24.6%United Kingdom – 7.35% CAGR


Market Segmentation Overview

By Power Rating

Sub-SegmentKey Trend
Large (Above 100 MVA)±525 kV converter transformers and 500–1,000 MVA autotransformers for HVDC and interconnectors
Medium (10 to 100 MVA)Modular skid-mounted 40 MVA designs for sub-transmission and storage coupling
Small (Up to 10 MVA)Sensor-equipped units for municipal substations and rooftop solar clusters


Medium (10 to 100 MVA) units lead on volume and value because utilities rely on standardized designs for sub-transmission upgrades and wind-farm interties. Large (Above 100 MVA) units grow fastest as offshore export links and cross-border corridors need high-rating converter transformers that only a few factories can build and test. Small (Up to 10 MVA) demand remains steady, tied to municipal and rural network renewal.

By Cooling Type

Sub-SegmentKey Trend
Air-CooledDry-type cast-resin units for buildings, tunnels and hydrogen sites
Oil-CooledShift from mineral oil to biodegradable natural-ester fluids


Oil-Cooled units remain dominant because liquid insulation handles the heat loads of high-rating utility transformers most effectively. Air-Cooled units grow faster since data centers, hospitals and metro operators want to eliminate oil-spill and fire risk indoors. Ester-filled oil-cooled designs are narrowing that safety gap, so suppliers will compete on certifying esters at larger ratings.

By Phase

Sub-SegmentKey Trend
Single-PhasePole-mounted residential supply and Scott-connected traction feeds
Three-PhaseZig-zag harmonic-blocking windings for drive-heavy industrial loads


Three-Phase transformers lead and also grow faster than Single-Phase units, because industrial electrification, data centers and EV charging depots all run on balanced medium-voltage supply. Single-Phase demand is concentrated in dispersed rural networks and railway traction, where line-voltage and cost considerations outweigh power density.

By Transformer Type

Sub-SegmentKey Trend
PowerLong-dated TSO frameworks for HVDC, offshore and interconnector projects
DistributionTier 2 low-loss replacements and reinforcement for bidirectional flows


Power transformers hold the larger revenue pool because each transmission or HVDC unit carries a high price and is procured through multi-year TSO frameworks. Distribution transformers grow faster as DSOs replace older units under Ecodesign loss limits and reinforce secondary substations for heat pumps, EV chargers and rooftop solar.

By End-User

Sub-SegmentKey Trend
Power UtilitiesT&D reinforcement and Renewables connections, with Non-renewables refurbishment
IndustrialArc-furnace, rectifier and electrolyzer transformers for decarbonized processes
CommercialRedundant high-rating supplies for hyperscale data centers
ResidentialFeeder upgrades driven by heat-pump and housing growth


Power Utilities lead end-user demand, with T&D network reinforcement taking the largest slice and Renewables connections growing fastest within the group. Commercial buyers are the fastest-growing end-user category because hyperscale data centers order large, redundant transformer capacity on compressed timelines. Industrial and Residential demand follow process electrification and heat-pump uptake respectively.

7 minutes ago

Download PDF ×

We do not share your information with anyone. However, we may send you emails based on your report interest from time to time. You may contact us at any time to opt-out.