×
  • Cat-intel
  • MedIntelliX
  • Resources
  • About Us
  • Hero Background
    English
    Chinese
    French
    Japanese
    Korean
    German
    Spanish

    Europe Transformer market Trends

    ID: MRFR/E&P/14637-HCR
    128 Pages
    Garvit Vyas
    October 2025

    Europe Transformer Market Research Report Information By Power Rating (Small, Medium, and Large), By Cooling Type (Air-cooled and Oil-cooled), By Transformer Type (Power Transformer and Distribution Transformer) –and Europe Market Forecast Till 2035

    Share:
    Download PDF ×

    We do not share your information with anyone. However, we may send you emails based on your report interest from time to time. You may contact us at any time to opt-out.

    Europe Transformer market Infographic
    Purchase Options

    Market Trends

    Key Emerging Trends in the Europe Transformer market

    Within the dynamic landscape of Europe's transformer market, companies employ various strategies to secure and enhance their market share positioning. Differentiation is a foundational strategy, as companies strive to distinguish their transformers by focusing on specific technologies, features, or applications. Some companies may emphasize the efficiency, reliability, or environmental sustainability of their transformers, aiming to meet the diverse needs of industries and utilities. Through differentiation, companies seek to establish a unique identity in the competitive European transformer market, attracting customers with tailored solutions.

    Strategic collaborations and partnerships play a pivotal role in the transformer sector, given the complexity and interdependence of energy systems. Companies often engage in alliances with energy infrastructure developers, grid operators, or other industry stakeholders to expand their capabilities and offer comprehensive solutions. Collaborative ventures enable companies to address the evolving energy landscape, tap into emerging technologies, and navigate regional regulatory nuances. By forming strategic partnerships, companies not only strengthen their market share but also position themselves as integral contributors to the European energy ecosystem.

    Government policies and regulations significantly shape the landscape of the European transformer market. Companies strategically align their operations with regional energy policies, quality standards, and sustainability targets to gain a competitive edge. Leveraging government incentives, certifications, and compliance with environmental regulations becomes crucial. Staying abreast of evolving policies and adapting strategies accordingly allows companies not only to enhance their market share but also contribute to the broader objectives of sustainable and resilient energy infrastructure in Europe.

    Customer-centric strategies are paramount in the European transformer market, where end-users include utilities, industries, and renewable energy projects. Companies tailor their transformers to meet specific customer requirements, focusing on factors such as size, voltage ratings, and compatibility with renewable energy sources. Providing reliable, efficient, and environmentally friendly solutions is essential for building trust and loyalty in this market. Customer satisfaction and positive relationships contribute significantly to a company's market share growth.

    Investment in research and development (R&D) remains a cornerstone strategy for companies aiming to stay competitive in the rapidly evolving transformer market in Europe. Innovation in transformer design, materials, and smart technologies allows companies to address emerging challenges and capitalize on market trends. By investing in R&D, companies not only differentiate their products but also contribute to the overall advancement of energy infrastructure, positioning themselves as leaders in the dynamic European transformer market.

    Geographic expansion strategies are also pivotal as companies seek to enhance their market share in different regions of Europe. Each region may have unique energy demands, grid requirements, and environmental conditions. By strategically expanding into key markets, companies can tailor their transformer solutions to meet specific regional needs, build relationships with local stakeholders, and navigate diverse regulatory landscapes. This approach enables companies to effectively penetrate different markets and establish a robust presence in the European transformer sector.

    In conclusion, market share positioning strategies in Europe's transformer market involve a multifaceted approach. Companies differentiate their products, engage in strategic collaborations, align with government policies, prioritize customer-centric solutions, invest in R&D, and strategically expand into key geographic markets. As Europe continues to transition towards a more sustainable and interconnected energy infrastructure, these strategies will likely evolve, reflecting the dynamic nature of the transformer market. Companies that can adeptly navigate these complexities will be well-positioned to thrive in this competitive and vital sector of the European energy landscape.

    Author
    Garvit Vyas
    Analyst

    Explore the profile of Garvit Vyas, one of our esteemed authors at Market Research Future, and access their expert research contributions in the field of market research and industry analysis

    Leave a Comment

    FAQs

    How much is the Transformer market?

    The Europe Transformer market size was valued at USD 11.03 Billion in 2024.

    What is the growth rate of the Transformer market?

    The market is projected to grow at a CAGR of 9.50% during the forecast period, 2025-2034.

    Who are the key players in the Transformer market?

    The key players in the market are Siemens AG, ABB Ltd., General Electric Company, Schneider Electric SE, and Emerson Electric Co.

    Which power rating led the Transformer market?

    The small category dominated the market in 2022.

    Which cooling type had the largest market share in the Transformer market?

    The air-cooled category had the largest share of the market.

    Which transformer type had the largest market share in the Transformer market?

    The power transformer had the largest share in the market.

    Market Summary

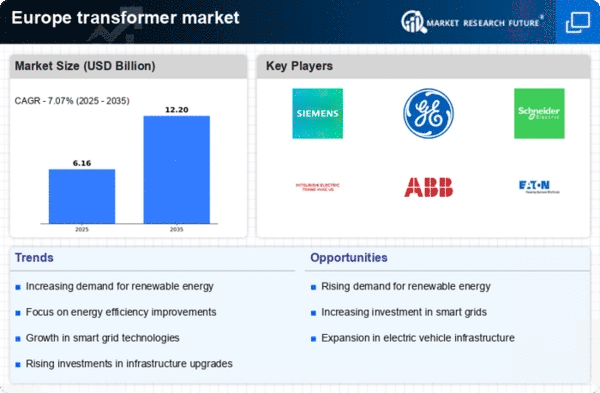
    As per MRFR analysis, the Europe transformer market Size was estimated at 5.76 USD Billion in 2024. The Europe transformer market is projected to grow from 6.16 USD Billion in 2025 to 12.2 USD Billion by 2035, exhibiting a compound annual growth rate (CAGR) of 7.07% during the forecast period 2025 - 2035.

    Key Market Trends & Highlights

    The Europe transformer market is experiencing robust growth driven by technological advancements and sustainability initiatives.

    • Germany remains the largest market for transformers, reflecting a strong demand for modernization and efficiency.
    • The UK is emerging as the fastest-growing region, propelled by increasing investments in renewable energy infrastructure.
    • Technological innovations in transformer design are enhancing efficiency and performance across various applications.
    • Rising demand for renewable energy and government incentives for energy efficiency are key drivers shaping the market landscape.

    Market Size & Forecast

    2024 Market Size 5.76 (USD Billion)
    2035 Market Size 12.2 (USD Billion)
    CAGR (2025 - 2035) 7.07%

    Major Players

    <p>Siemens (DE), General Electric (US), Schneider Electric (FR), Mitsubishi Electric (JP), ABB (CH), Eaton (US), Toshiba (JP), Hitachi (JP), Hyundai Electric (KR)</p>

    Market Trends

    The transformer market in Europe is currently experiencing a dynamic phase characterized by technological advancements and increasing demand for energy efficiency. The shift towards renewable energy sources has prompted a reevaluation of existing infrastructure, leading to a surge in investments aimed at upgrading and modernizing transformer systems. This transition is not merely a response to regulatory pressures but also reflects a broader commitment to sustainability and reducing carbon footprints. As utilities and industries seek to enhance their operational efficiency, the integration of smart technologies into transformer systems appears to be a focal point. Moreover, the regulatory landscape in Europe is evolving, with stricter standards being implemented to ensure that transformers meet higher efficiency criteria. This regulatory push is likely to drive innovation within the transformer market, as manufacturers strive to comply with new requirements while also addressing the growing consumer demand for reliable and efficient energy solutions. The interplay between technological innovation and regulatory frameworks suggests a robust future for the transformer market, with opportunities for growth and development in various sectors, including renewable energy, transportation, and industrial applications.

    Technological Advancements

    The transformer market is witnessing rapid technological innovations, particularly in the realm of smart transformers. These devices incorporate advanced monitoring and control systems, enabling real-time data analysis and improved operational efficiency. As industries increasingly adopt automation, the demand for such intelligent systems is likely to rise.

    Sustainability Initiatives

    There is a growing emphasis on sustainability within the transformer market, driven by both regulatory mandates and consumer preferences. Manufacturers are focusing on developing eco-friendly transformers that minimize environmental impact, aligning with broader European goals for carbon neutrality and energy efficiency.

    Regulatory Changes

    The regulatory environment surrounding the transformer market is becoming more stringent, with new efficiency standards being introduced. These regulations compel manufacturers to innovate and enhance the performance of their products, ensuring compliance while meeting the evolving needs of the energy sector.

    Europe Transformer market Market Drivers

    Rising Demand for Renewable Energy

    The increasing shift towards renewable energy sources in Europe is driving the transformer market. As countries aim to meet their climate goals, investments in wind, solar, and hydroelectric power are surging. This transition necessitates the installation of advanced transformers to manage the variable output from these energy sources. In 2025, the renewable energy sector is projected to account for over 50% of the total energy mix in several European nations. Consequently, the transformer market is likely to experience substantial growth, as these systems are essential for integrating renewable energy into existing grids.

    Infrastructure Modernization Initiatives

    Europe's aging electrical infrastructure is prompting significant modernization efforts, which are crucial for enhancing efficiency and reliability. Governments and utility companies are investing heavily in upgrading transmission and distribution networks, which directly impacts the transformer market. In 2025, it is estimated that investments in infrastructure upgrades will exceed €100 billion across Europe. This modernization includes the deployment of smart transformers that can improve grid management and reduce losses, thereby fostering a more resilient energy system. The ongoing infrastructure initiatives are expected to create a robust demand for transformers.

    Increased Urbanization and Electrification

    The rapid urbanization in Europe is leading to heightened demand for electricity, which in turn influences the transformer market. As urban areas expand, the need for reliable power supply becomes critical. By 2025, urban populations in Europe are projected to reach approximately 75% of the total population, necessitating enhanced electrical infrastructure. This urban growth drives the installation of transformers to support new residential, commercial, and industrial developments. The transformer market is likely to benefit from this trend, as utilities strive to meet the rising electricity demand in densely populated areas.

    Government Incentives for Energy Efficiency

    European governments are increasingly implementing incentives aimed at promoting energy efficiency, which significantly impacts the transformer market. Programs that encourage the adoption of energy-efficient technologies, including transformers, are becoming more prevalent. By 2025, it is expected that these incentives will lead to a 15% increase in the adoption of high-efficiency transformers across various sectors. Such initiatives not only support environmental goals but also help reduce operational costs for businesses and utilities. The favorable regulatory environment is likely to stimulate growth in the transformer market as stakeholders seek to capitalize on these opportunities.

    Technological Innovations in Transformer Design

    Innovations in transformer technology are reshaping the landscape of the transformer market in Europe. Developments such as the introduction of high-efficiency transformers and digital monitoring systems are enhancing performance and reliability. These advancements not only reduce energy losses but also extend the lifespan of transformers. In 2025, it is anticipated that the market for smart transformers will grow by over 20%, driven by the need for improved grid management and operational efficiency. The integration of advanced technologies is likely to position the transformer market favorably in the evolving energy sector.

    Market Segment Insights

    Europe Transformer Market Power Rating Insights

    <p>The Europe Transformer market segmentation, based on power rating, includes Small, Medium, and Large. The small segment dominated the market. With lower power ratings, these transformers find widespread application in various industries and residential settings. Their compact size and efficiency make them suitable for diverse applications, contributing to the overall growth and adaptability of the European transformer market.</p>

    <p>Figure 1: Europe Transformer Market by Cooling Type, 2022 &amp; 2032 (USD Billion)</p>

    <p>Source: Secondary Research, Primary Research, MRFR Database and Analyst Review</p>

    Europe Transformer Market Cooling Type Insights

    <p>The Europe Transformer market segmentation, based on cooling type, includes Air-cooled and Oil-cooled. The air-cooled category generated the most income. These transformers leverage air as a cooling medium, offering efficient heat dissipation. Widely adopted for various applications, air-cooled transformers contribute to the market's versatility, providing a reliable and cost-effective cooling solution. As the demand for energy infrastructure continues to grow, air-cooled transformers are crucial in meeting diverse cooling requirements across the European region.</p>

    Europe Transformer Market Type Insights

    <p>The European transformer market segmentation, based on the transformer type, includes Power Transformers and <a href="https://www.marketresearchfuture.com/reports/distribution-transformer-market-2581">Distribution Transformers</a>. The power transformer segment dominated the market. These transformers play a pivotal role in electrical power distribution, ensuring efficient transmission across the grid. <a href="https://www.marketresearchfuture.com/reports/power-transformer-market-3251">Power transformers</a> are crucial for voltage conversion, enabling the seamless flow of electricity in diverse applications. With increasing demand for reliable and sustainable energy infrastructure, the Power transformer segment in Europe continues to evolve, contributing significantly to the region's overall transformer market dynamics.</p>

    Europe Transformer Market Country Insights

    <p>The rapid expansion of electricity and the transition towards renewable energy sources has resulted in a recent boom in demand for Transformers in Europe. As the largest economy in Europe, Germany dominates the market, with a strong focus on upgrading and expanding its power infrastructure. The country's emphasis on <a href="https://www.marketresearchfuture.com/reports/renewable-energy-market-1515">renewable energy</a> integration further boosts transformer demand. Nuclear power plays a significant role in France, influencing the transformer market. The United Kingdom is shifting towards renewable energy and smart grid initiatives, stimulating transformer adoption. Eastern European countries like Poland are investing in modernizing their power grids, contributing to market growth.</p>

    <p>Overall, the European transformer market reflects a mix of mature and emerging economies, each with unique drivers shaping the industry landscape.</p>

    Get more detailed insights about Europe Transformer Market Research Report – Forecast till 2035

    Regional Insights

    North America : Established Market Leaders

    The North American transformer market is driven by increasing investments in renewable energy and grid modernization. The U.S. holds the largest market share at approximately 60%, followed by Canada at around 25%. Regulatory support for clean energy initiatives and infrastructure upgrades is propelling demand for advanced transformer technologies. The market is also witnessing a shift towards smart grid solutions, enhancing operational efficiency and reliability. Key players such as General Electric and Eaton dominate the landscape, focusing on innovation and sustainability. The competitive environment is characterized by strategic partnerships and mergers aimed at expanding product offerings. The presence of established manufacturers ensures a robust supply chain, while ongoing government initiatives further stimulate market growth. The emphasis on energy efficiency and reduced carbon footprints is shaping the future of the transformer market in North America.

    Europe : Innovation and Sustainability Focus

    The European transformer market is experiencing significant growth, driven by stringent regulations on energy efficiency and a strong push towards renewable energy sources. Germany and France are the largest markets, holding approximately 35% and 20% market shares, respectively. The European Union's Green Deal and various national policies are catalyzing investments in smart grid technologies and sustainable practices, enhancing the demand for advanced transformers. Leading countries like Germany, France, and the UK are home to major players such as Siemens and Schneider Electric, who are at the forefront of innovation. The competitive landscape is marked by a focus on R&D and the development of eco-friendly products. The presence of key manufacturers ensures a diverse range of offerings, catering to various sectors including industrial, commercial, and residential. The market is poised for further growth as Europe transitions towards a more sustainable energy framework.

    Asia-Pacific : Emerging Market Potential

    The Asia-Pacific transformer market is witnessing rapid expansion, fueled by urbanization, industrialization, and increasing energy demands. China is the largest market, accounting for approximately 50% of the regional share, followed by India at around 20%. Government initiatives aimed at enhancing power infrastructure and promoting renewable energy sources are significant growth drivers, creating a favorable environment for transformer manufacturers. Countries like China, India, and Japan are leading the charge, with key players such as Mitsubishi Electric and Toshiba actively participating in the market. The competitive landscape is characterized by a mix of local and international companies, focusing on technological advancements and cost-effective solutions. The region's growing emphasis on smart grid technologies and energy efficiency is expected to further boost the demand for transformers, positioning Asia-Pacific as a vital player in the global market.

    Middle East and Africa : Resource-Rich Opportunities

    The Middle East and Africa transformer market is gradually evolving, driven by increasing investments in infrastructure and energy projects. The region is characterized by a growing demand for electricity, particularly in countries like Saudi Arabia and South Africa, which hold approximately 30% and 20% market shares, respectively. Government initiatives aimed at diversifying energy sources and enhancing grid reliability are key factors propelling market growth. Leading countries are focusing on developing renewable energy projects, with significant contributions from key players such as Hitachi Energy and Nexans. The competitive landscape is marked by collaborations and partnerships aimed at addressing the unique challenges of the region. As the demand for reliable power supply increases, the transformer market in the Middle East and Africa is expected to witness substantial growth, supported by ongoing infrastructure developments and energy reforms.

    Key Players and Competitive Insights

    The transformer market exhibits a dynamic competitive landscape characterized by rapid technological advancements and a growing emphasis on sustainability. Key players such as Siemens (DE), General Electric (US), and Schneider Electric (FR) are at the forefront, leveraging innovation and strategic partnerships to enhance their market positions. Siemens (DE) focuses on digital transformation and smart grid technologies, while General Electric (US) emphasizes its commitment to renewable energy solutions. Schneider Electric (FR) is actively pursuing regional expansion and sustainability initiatives, which collectively shape a competitive environment that prioritizes efficiency and environmental responsibility.

    In terms of business tactics, companies are increasingly localizing manufacturing to reduce costs and optimize supply chains. The market structure appears moderately fragmented, with several key players exerting considerable influence. This fragmentation allows for niche players to thrive, while larger corporations consolidate their market share through strategic acquisitions and partnerships, thereby enhancing their operational capabilities.

    In October 2025, Siemens (DE) announced a significant investment in a new manufacturing facility in Germany aimed at producing next-generation transformers. This strategic move is likely to bolster Siemens' production capacity and enhance its ability to meet the growing demand for energy-efficient solutions in Europe. The establishment of this facility underscores the company's commitment to innovation and local production, which may provide a competitive edge in a market increasingly focused on sustainability.

    In September 2025, General Electric (US) unveiled a partnership with a leading European utility company to develop advanced transformer technologies that integrate renewable energy sources. This collaboration is indicative of GE's strategy to align its product offerings with the evolving energy landscape, potentially positioning the company as a leader in the transition to greener energy solutions. Such partnerships may enhance GE's market presence and foster innovation in transformer technology.

    In August 2025, Schneider Electric (FR) launched a new line of eco-friendly transformers designed to minimize environmental impact. This initiative reflects Schneider's strategic focus on sustainability and innovation, catering to the increasing demand for environmentally responsible products. By prioritizing eco-friendly solutions, Schneider Electric may strengthen its brand reputation and appeal to a broader customer base, thereby enhancing its competitive position.

    As of November 2025, current trends in the transformer market are heavily influenced by digitalization, sustainability, and the integration of artificial intelligence. Strategic alliances are becoming increasingly vital, as companies seek to leverage complementary strengths to drive innovation. The competitive differentiation is likely to evolve from traditional price-based competition towards a focus on technological advancements, reliability in supply chains, and sustainable practices. This shift suggests that companies that prioritize innovation and sustainability will be better positioned to thrive in the future.

    Key Companies in the Europe Transformer market market include

    Industry Developments

    October 2021: The Integrity 3D-IC platform has been delivered, according to Cadence Design Systems, Inc. Design planning, system analysis, and 3D execution are all integrated into a single, unified cockpit, making it the first high-capacity, complete 3D-IC platform in the industry.

    Future Outlook

    Europe Transformer market Future Outlook

    <p>The transformer market is projected to grow at a 7.07% CAGR from 2024 to 2035, driven by increasing demand for renewable energy and infrastructure upgrades.</p>

    New opportunities lie in:

    • <p>Investment in smart grid technologies to enhance efficiency.</p>
    • <p>Development of eco-friendly transformer materials for sustainability.</p>
    • <p>Expansion into emerging markets with tailored solutions.</p>

    <p>By 2035, the transformer market is expected to achieve robust growth and innovation.</p>

    Market Segmentation

    Europe Transformer market Type Outlook

    • Power Transformer
    • Distribution Transformer
    • Instrument Transformer
    • Conventional Transformer
    • Pad-Mounted Transformer
    • Compact Secondary Substation (CSP) Transformer
    • Others

    Europe Transformer market Phase Outlook

    • Single-Phase
    • Three-Phase

    Europe Transformer market Application Outlook

    • Industrial
    • Residential
    • Commercial
    • Utility

    Europe Transformer market Power Rating Outlook

    • <500 kVA
    • 500 kVA – 2500 kVA
    • 2500 kVA – 10000 kVA
    • >10000 kVA

    Report Scope

    MARKET SIZE 20245.76(USD Billion)
    MARKET SIZE 20256.16(USD Billion)
    MARKET SIZE 203512.2(USD Billion)
    COMPOUND ANNUAL GROWTH RATE (CAGR)7.07% (2024 - 2035)
    REPORT COVERAGERevenue Forecast, Competitive Landscape, Growth Factors, and Trends
    BASE YEAR2024
    Market Forecast Period2025 - 2035
    Historical Data2019 - 2024
    Market Forecast UnitsUSD Billion
    Key Companies Profiled["Siemens (DE)", "General Electric (US)", "Schneider Electric (FR)", "Mitsubishi Electric (JP)", "ABB (CH)", "Eaton (US)", "Toshiba (JP)", "Hitachi (JP)", "Hyundai Electric (KR)"]
    Segments CoveredType, Power Rating, Phase, Application
    Key Market OpportunitiesAdoption of smart grid technologies enhances efficiency and reliability in the transformer market.
    Key Market DynamicsTechnological advancements and regulatory pressures drive innovation and sustainability in the transformer market.
    Countries CoveredGermany, UK, France, Russia, Italy, Spain, Rest of Europe

    FAQs

    How much is the Transformer market?

    The Europe Transformer market size was valued at USD 11.03 Billion in 2024.

    What is the growth rate of the Transformer market?

    The market is projected to grow at a CAGR of 9.50% during the forecast period, 2025-2034.

    Who are the key players in the Transformer market?

    The key players in the market are Siemens AG, ABB Ltd., General Electric Company, Schneider Electric SE, and Emerson Electric Co.

    Which power rating led the Transformer market?

    The small category dominated the market in 2022.

    Which cooling type had the largest market share in the Transformer market?

    The air-cooled category had the largest share of the market.

    Which transformer type had the largest market share in the Transformer market?

    The power transformer had the largest share in the market.

    1. SECTION I: EXECUTIVE SUMMARY AND KEY HIGHLIGHTS
      1. | 1.1 EXECUTIVE SUMMARY
      2. | | 1.1.1 Market Overview
      3. | | 1.1.2 Key Findings
      4. | | 1.1.3 Market Segmentation
      5. | | 1.1.4 Competitive Landscape
      6. | | 1.1.5 Challenges and Opportunities
      7. | | 1.1.6 Future Outlook
    2. SECTION II: SCOPING, METHODOLOGY AND MARKET STRUCTURE
      1. | 2.1 MARKET INTRODUCTION
      2. | | 2.1.1 Definition
      3. | | 2.1.2 Scope of the study
      4. | | | 2.1.2.1 Research Objective
      5. | | | 2.1.2.2 Assumption
      6. | | | 2.1.2.3 Limitations
      7. | 2.2 RESEARCH METHODOLOGY
      8. | | 2.2.1 Overview
      9. | | 2.2.2 Data Mining
      10. | | 2.2.3 Secondary Research
      11. | | 2.2.4 Primary Research
      12. | | | 2.2.4.1 Primary Interviews and Information Gathering Process
      13. | | | 2.2.4.2 Breakdown of Primary Respondents
      14. | | 2.2.5 Forecasting Model
      15. | | 2.2.6 Market Size Estimation
      16. | | | 2.2.6.1 Bottom-Up Approach
      17. | | | 2.2.6.2 Top-Down Approach
      18. | | 2.2.7 Data Triangulation
      19. | | 2.2.8 Validation
    3. SECTION III: QUALITATIVE ANALYSIS
      1. | 3.1 MARKET DYNAMICS
      2. | | 3.1.1 Overview
      3. | | 3.1.2 Drivers
      4. | | 3.1.3 Restraints
      5. | | 3.1.4 Opportunities
      6. | 3.2 MARKET FACTOR ANALYSIS
      7. | | 3.2.1 Value chain Analysis
      8. | | 3.2.2 Porter's Five Forces Analysis
      9. | | | 3.2.2.1 Bargaining Power of Suppliers
      10. | | | 3.2.2.2 Bargaining Power of Buyers
      11. | | | 3.2.2.3 Threat of New Entrants
      12. | | | 3.2.2.4 Threat of Substitutes
      13. | | | 3.2.2.5 Intensity of Rivalry
      14. | | 3.2.3 COVID-19 Impact Analysis
      15. | | | 3.2.3.1 Market Impact Analysis
      16. | | | 3.2.3.2 Regional Impact
      17. | | | 3.2.3.3 Opportunity and Threat Analysis
    4. SECTION IV: QUANTITATIVE ANALYSIS
      1. | 4.1 Energy & Power, BY Power Rating (USD Billion)
      2. | | 4.1.1 Small
      3. | | 4.1.2 Medium
      4. | | 4.1.3 Large
      5. | 4.2 Energy & Power, BY Cooling Type (USD Billion)
      6. | | 4.2.1 Air-cooled
      7. | | 4.2.2 Oil-cooled
      8. | 4.3 Energy & Power, BY Type (USD Billion)
      9. | | 4.3.1 Power Transformer
      10. | | 4.3.2 Distribution Transformer
      11. | 4.4 Energy & Power, BY Region (USD Billion)
      12. | | 4.4.1 North America
      13. | | | 4.4.1.1 US
      14. | | | 4.4.1.2 Canada
      15. | | 4.4.2 Europe
      16. | | | 4.4.2.1 Germany
      17. | | | 4.4.2.2 UK
      18. | | | 4.4.2.3 France
      19. | | | 4.4.2.4 Russia
      20. | | | 4.4.2.5 Italy
      21. | | | 4.4.2.6 Spain
      22. | | | 4.4.2.7 Rest of Europe
      23. | | 4.4.3 APAC
      24. | | | 4.4.3.1 China
      25. | | | 4.4.3.2 India
      26. | | | 4.4.3.3 Japan
      27. | | | 4.4.3.4 South Korea
      28. | | | 4.4.3.5 Malaysia
      29. | | | 4.4.3.6 Thailand
      30. | | | 4.4.3.7 Indonesia
      31. | | | 4.4.3.8 Rest of APAC
      32. | | 4.4.4 South America
      33. | | | 4.4.4.1 Brazil
      34. | | | 4.4.4.2 Mexico
      35. | | | 4.4.4.3 Argentina
      36. | | | 4.4.4.4 Rest of South America
      37. | | 4.4.5 MEA
      38. | | | 4.4.5.1 GCC Countries
      39. | | | 4.4.5.2 South Africa
      40. | | | 4.4.5.3 Rest of MEA
    5. SECTION V: COMPETITIVE ANALYSIS
      1. | 5.1 Competitive Landscape
      2. | | 5.1.1 Overview
      3. | | 5.1.2 Competitive Analysis
      4. | | 5.1.3 Market share Analysis
      5. | | 5.1.4 Major Growth Strategy in the Energy & Power
      6. | | 5.1.5 Competitive Benchmarking
      7. | | 5.1.6 Leading Players in Terms of Number of Developments in the Energy & Power
      8. | | 5.1.7 Key developments and growth strategies
      9. | | | 5.1.7.1 New Product Launch/Service Deployment
      10. | | | 5.1.7.2 Merger & Acquisitions
      11. | | | 5.1.7.3 Joint Ventures
      12. | | 5.1.8 Major Players Financial Matrix
      13. | | | 5.1.8.1 Sales and Operating Income
      14. | | | 5.1.8.2 Major Players R&D Expenditure. 2023
      15. | 5.2 Company Profiles
      16. | | 5.2.1 Siemens (DE)
      17. | | | 5.2.1.1 Financial Overview
      18. | | | 5.2.1.2 Products Offered
      19. | | | 5.2.1.3 Key Developments
      20. | | | 5.2.1.4 SWOT Analysis
      21. | | | 5.2.1.5 Key Strategies
      22. | | 5.2.2 Schneider Electric (FR)
      23. | | | 5.2.2.1 Financial Overview
      24. | | | 5.2.2.2 Products Offered
      25. | | | 5.2.2.3 Key Developments
      26. | | | 5.2.2.4 SWOT Analysis
      27. | | | 5.2.2.5 Key Strategies
      28. | | 5.2.3 ABB (CH)
      29. | | | 5.2.3.1 Financial Overview
      30. | | | 5.2.3.2 Products Offered
      31. | | | 5.2.3.3 Key Developments
      32. | | | 5.2.3.4 SWOT Analysis
      33. | | | 5.2.3.5 Key Strategies
      34. | | 5.2.4 General Electric (US)
      35. | | | 5.2.4.1 Financial Overview
      36. | | | 5.2.4.2 Products Offered
      37. | | | 5.2.4.3 Key Developments
      38. | | | 5.2.4.4 SWOT Analysis
      39. | | | 5.2.4.5 Key Strategies
      40. | | 5.2.5 Mitsubishi Electric (JP)
      41. | | | 5.2.5.1 Financial Overview
      42. | | | 5.2.5.2 Products Offered
      43. | | | 5.2.5.3 Key Developments
      44. | | | 5.2.5.4 SWOT Analysis
      45. | | | 5.2.5.5 Key Strategies
      46. | | 5.2.6 Eaton (IE)
      47. | | | 5.2.6.1 Financial Overview
      48. | | | 5.2.6.2 Products Offered
      49. | | | 5.2.6.3 Key Developments
      50. | | | 5.2.6.4 SWOT Analysis
      51. | | | 5.2.6.5 Key Strategies
      52. | | 5.2.7 Toshiba (JP)
      53. | | | 5.2.7.1 Financial Overview
      54. | | | 5.2.7.2 Products Offered
      55. | | | 5.2.7.3 Key Developments
      56. | | | 5.2.7.4 SWOT Analysis
      57. | | | 5.2.7.5 Key Strategies
      58. | | 5.2.8 Hitachi Energy (CH)
      59. | | | 5.2.8.1 Financial Overview
      60. | | | 5.2.8.2 Products Offered
      61. | | | 5.2.8.3 Key Developments
      62. | | | 5.2.8.4 SWOT Analysis
      63. | | | 5.2.8.5 Key Strategies
      64. | | 5.2.9 Nexans (FR)
      65. | | | 5.2.9.1 Financial Overview
      66. | | | 5.2.9.2 Products Offered
      67. | | | 5.2.9.3 Key Developments
      68. | | | 5.2.9.4 SWOT Analysis
      69. | | | 5.2.9.5 Key Strategies
      70. | 5.3 Appendix
      71. | | 5.3.1 References
      72. | | 5.3.2 Related Reports
    6. LIST OF FIGURES
      1. | 6.1 MARKET SYNOPSIS
      2. | 6.2 NORTH AMERICA MARKET ANALYSIS
      3. | 6.3 US MARKET ANALYSIS BY POWER RATING
      4. | 6.4 US MARKET ANALYSIS BY COOLING TYPE
      5. | 6.5 US MARKET ANALYSIS BY TYPE
      6. | 6.6 CANADA MARKET ANALYSIS BY POWER RATING
      7. | 6.7 CANADA MARKET ANALYSIS BY COOLING TYPE
      8. | 6.8 CANADA MARKET ANALYSIS BY TYPE
      9. | 6.9 EUROPE MARKET ANALYSIS
      10. | 6.10 GERMANY MARKET ANALYSIS BY POWER RATING
      11. | 6.11 GERMANY MARKET ANALYSIS BY COOLING TYPE
      12. | 6.12 GERMANY MARKET ANALYSIS BY TYPE
      13. | 6.13 UK MARKET ANALYSIS BY POWER RATING
      14. | 6.14 UK MARKET ANALYSIS BY COOLING TYPE
      15. | 6.15 UK MARKET ANALYSIS BY TYPE
      16. | 6.16 FRANCE MARKET ANALYSIS BY POWER RATING
      17. | 6.17 FRANCE MARKET ANALYSIS BY COOLING TYPE
      18. | 6.18 FRANCE MARKET ANALYSIS BY TYPE
      19. | 6.19 RUSSIA MARKET ANALYSIS BY POWER RATING
      20. | 6.20 RUSSIA MARKET ANALYSIS BY COOLING TYPE
      21. | 6.21 RUSSIA MARKET ANALYSIS BY TYPE
      22. | 6.22 ITALY MARKET ANALYSIS BY POWER RATING
      23. | 6.23 ITALY MARKET ANALYSIS BY COOLING TYPE
      24. | 6.24 ITALY MARKET ANALYSIS BY TYPE
      25. | 6.25 SPAIN MARKET ANALYSIS BY POWER RATING
      26. | 6.26 SPAIN MARKET ANALYSIS BY COOLING TYPE
      27. | 6.27 SPAIN MARKET ANALYSIS BY TYPE
      28. | 6.28 REST OF EUROPE MARKET ANALYSIS BY POWER RATING
      29. | 6.29 REST OF EUROPE MARKET ANALYSIS BY COOLING TYPE
      30. | 6.30 REST OF EUROPE MARKET ANALYSIS BY TYPE
      31. | 6.31 APAC MARKET ANALYSIS
      32. | 6.32 CHINA MARKET ANALYSIS BY POWER RATING
      33. | 6.33 CHINA MARKET ANALYSIS BY COOLING TYPE
      34. | 6.34 CHINA MARKET ANALYSIS BY TYPE
      35. | 6.35 INDIA MARKET ANALYSIS BY POWER RATING
      36. | 6.36 INDIA MARKET ANALYSIS BY COOLING TYPE
      37. | 6.37 INDIA MARKET ANALYSIS BY TYPE
      38. | 6.38 JAPAN MARKET ANALYSIS BY POWER RATING
      39. | 6.39 JAPAN MARKET ANALYSIS BY COOLING TYPE
      40. | 6.40 JAPAN MARKET ANALYSIS BY TYPE
      41. | 6.41 SOUTH KOREA MARKET ANALYSIS BY POWER RATING
      42. | 6.42 SOUTH KOREA MARKET ANALYSIS BY COOLING TYPE
      43. | 6.43 SOUTH KOREA MARKET ANALYSIS BY TYPE
      44. | 6.44 MALAYSIA MARKET ANALYSIS BY POWER RATING
      45. | 6.45 MALAYSIA MARKET ANALYSIS BY COOLING TYPE
      46. | 6.46 MALAYSIA MARKET ANALYSIS BY TYPE
      47. | 6.47 THAILAND MARKET ANALYSIS BY POWER RATING
      48. | 6.48 THAILAND MARKET ANALYSIS BY COOLING TYPE
      49. | 6.49 THAILAND MARKET ANALYSIS BY TYPE
      50. | 6.50 INDONESIA MARKET ANALYSIS BY POWER RATING
      51. | 6.51 INDONESIA MARKET ANALYSIS BY COOLING TYPE
      52. | 6.52 INDONESIA MARKET ANALYSIS BY TYPE
      53. | 6.53 REST OF APAC MARKET ANALYSIS BY POWER RATING
      54. | 6.54 REST OF APAC MARKET ANALYSIS BY COOLING TYPE
      55. | 6.55 REST OF APAC MARKET ANALYSIS BY TYPE
      56. | 6.56 SOUTH AMERICA MARKET ANALYSIS
      57. | 6.57 BRAZIL MARKET ANALYSIS BY POWER RATING
      58. | 6.58 BRAZIL MARKET ANALYSIS BY COOLING TYPE
      59. | 6.59 BRAZIL MARKET ANALYSIS BY TYPE
      60. | 6.60 MEXICO MARKET ANALYSIS BY POWER RATING
      61. | 6.61 MEXICO MARKET ANALYSIS BY COOLING TYPE
      62. | 6.62 MEXICO MARKET ANALYSIS BY TYPE
      63. | 6.63 ARGENTINA MARKET ANALYSIS BY POWER RATING
      64. | 6.64 ARGENTINA MARKET ANALYSIS BY COOLING TYPE
      65. | 6.65 ARGENTINA MARKET ANALYSIS BY TYPE
      66. | 6.66 REST OF SOUTH AMERICA MARKET ANALYSIS BY POWER RATING
      67. | 6.67 REST OF SOUTH AMERICA MARKET ANALYSIS BY COOLING TYPE
      68. | 6.68 REST OF SOUTH AMERICA MARKET ANALYSIS BY TYPE
      69. | 6.69 MEA MARKET ANALYSIS
      70. | 6.70 GCC COUNTRIES MARKET ANALYSIS BY POWER RATING
      71. | 6.71 GCC COUNTRIES MARKET ANALYSIS BY COOLING TYPE
      72. | 6.72 GCC COUNTRIES MARKET ANALYSIS BY TYPE
      73. | 6.73 SOUTH AFRICA MARKET ANALYSIS BY POWER RATING
      74. | 6.74 SOUTH AFRICA MARKET ANALYSIS BY COOLING TYPE
      75. | 6.75 SOUTH AFRICA MARKET ANALYSIS BY TYPE
      76. | 6.76 REST OF MEA MARKET ANALYSIS BY POWER RATING
      77. | 6.77 REST OF MEA MARKET ANALYSIS BY COOLING TYPE
      78. | 6.78 REST OF MEA MARKET ANALYSIS BY TYPE
      79. | 6.79 KEY BUYING CRITERIA OF ENERGY & POWER
      80. | 6.80 RESEARCH PROCESS OF MRFR
      81. | 6.81 DRO ANALYSIS OF ENERGY & POWER
      82. | 6.82 DRIVERS IMPACT ANALYSIS: ENERGY & POWER
      83. | 6.83 RESTRAINTS IMPACT ANALYSIS: ENERGY & POWER
      84. | 6.84 SUPPLY / VALUE CHAIN: ENERGY & POWER
      85. | 6.85 ENERGY & POWER, BY POWER RATING, 2024 (% SHARE)
      86. | 6.86 ENERGY & POWER, BY POWER RATING, 2024 TO 2035 (USD Billion)
      87. | 6.87 ENERGY & POWER, BY COOLING TYPE, 2024 (% SHARE)
      88. | 6.88 ENERGY & POWER, BY COOLING TYPE, 2024 TO 2035 (USD Billion)
      89. | 6.89 ENERGY & POWER, BY TYPE, 2024 (% SHARE)
      90. | 6.90 ENERGY & POWER, BY TYPE, 2024 TO 2035 (USD Billion)
      91. | 6.91 BENCHMARKING OF MAJOR COMPETITORS
    7. LIST OF TABLES
      1. | 7.1 LIST OF ASSUMPTIONS
      2. | | 7.1.1
      3. | 7.2 North America MARKET SIZE ESTIMATES; FORECAST
      4. | | 7.2.1 BY POWER RATING, 2025-2035 (USD Billion)
      5. | | 7.2.2 BY COOLING TYPE, 2025-2035 (USD Billion)
      6. | | 7.2.3 BY TYPE, 2025-2035 (USD Billion)
      7. | 7.3 US MARKET SIZE ESTIMATES; FORECAST
      8. | | 7.3.1 BY POWER RATING, 2025-2035 (USD Billion)
      9. | | 7.3.2 BY COOLING TYPE, 2025-2035 (USD Billion)
      10. | | 7.3.3 BY TYPE, 2025-2035 (USD Billion)
      11. | 7.4 Canada MARKET SIZE ESTIMATES; FORECAST
      12. | | 7.4.1 BY POWER RATING, 2025-2035 (USD Billion)
      13. | | 7.4.2 BY COOLING TYPE, 2025-2035 (USD Billion)
      14. | | 7.4.3 BY TYPE, 2025-2035 (USD Billion)
      15. | 7.5 Europe MARKET SIZE ESTIMATES; FORECAST
      16. | | 7.5.1 BY POWER RATING, 2025-2035 (USD Billion)
      17. | | 7.5.2 BY COOLING TYPE, 2025-2035 (USD Billion)
      18. | | 7.5.3 BY TYPE, 2025-2035 (USD Billion)
      19. | 7.6 Germany MARKET SIZE ESTIMATES; FORECAST
      20. | | 7.6.1 BY POWER RATING, 2025-2035 (USD Billion)
      21. | | 7.6.2 BY COOLING TYPE, 2025-2035 (USD Billion)
      22. | | 7.6.3 BY TYPE, 2025-2035 (USD Billion)
      23. | 7.7 UK MARKET SIZE ESTIMATES; FORECAST
      24. | | 7.7.1 BY POWER RATING, 2025-2035 (USD Billion)
      25. | | 7.7.2 BY COOLING TYPE, 2025-2035 (USD Billion)
      26. | | 7.7.3 BY TYPE, 2025-2035 (USD Billion)
      27. | 7.8 France MARKET SIZE ESTIMATES; FORECAST
      28. | | 7.8.1 BY POWER RATING, 2025-2035 (USD Billion)
      29. | | 7.8.2 BY COOLING TYPE, 2025-2035 (USD Billion)
      30. | | 7.8.3 BY TYPE, 2025-2035 (USD Billion)
      31. | 7.9 Russia MARKET SIZE ESTIMATES; FORECAST
      32. | | 7.9.1 BY POWER RATING, 2025-2035 (USD Billion)
      33. | | 7.9.2 BY COOLING TYPE, 2025-2035 (USD Billion)
      34. | | 7.9.3 BY TYPE, 2025-2035 (USD Billion)
      35. | 7.10 Italy MARKET SIZE ESTIMATES; FORECAST
      36. | | 7.10.1 BY POWER RATING, 2025-2035 (USD Billion)
      37. | | 7.10.2 BY COOLING TYPE, 2025-2035 (USD Billion)
      38. | | 7.10.3 BY TYPE, 2025-2035 (USD Billion)
      39. | 7.11 Spain MARKET SIZE ESTIMATES; FORECAST
      40. | | 7.11.1 BY POWER RATING, 2025-2035 (USD Billion)
      41. | | 7.11.2 BY COOLING TYPE, 2025-2035 (USD Billion)
      42. | | 7.11.3 BY TYPE, 2025-2035 (USD Billion)
      43. | 7.12 Rest of Europe MARKET SIZE ESTIMATES; FORECAST
      44. | | 7.12.1 BY POWER RATING, 2025-2035 (USD Billion)
      45. | | 7.12.2 BY COOLING TYPE, 2025-2035 (USD Billion)
      46. | | 7.12.3 BY TYPE, 2025-2035 (USD Billion)
      47. | 7.13 APAC MARKET SIZE ESTIMATES; FORECAST
      48. | | 7.13.1 BY POWER RATING, 2025-2035 (USD Billion)
      49. | | 7.13.2 BY COOLING TYPE, 2025-2035 (USD Billion)
      50. | | 7.13.3 BY TYPE, 2025-2035 (USD Billion)
      51. | 7.14 China MARKET SIZE ESTIMATES; FORECAST
      52. | | 7.14.1 BY POWER RATING, 2025-2035 (USD Billion)
      53. | | 7.14.2 BY COOLING TYPE, 2025-2035 (USD Billion)
      54. | | 7.14.3 BY TYPE, 2025-2035 (USD Billion)
      55. | 7.15 India MARKET SIZE ESTIMATES; FORECAST
      56. | | 7.15.1 BY POWER RATING, 2025-2035 (USD Billion)
      57. | | 7.15.2 BY COOLING TYPE, 2025-2035 (USD Billion)
      58. | | 7.15.3 BY TYPE, 2025-2035 (USD Billion)
      59. | 7.16 Japan MARKET SIZE ESTIMATES; FORECAST
      60. | | 7.16.1 BY POWER RATING, 2025-2035 (USD Billion)
      61. | | 7.16.2 BY COOLING TYPE, 2025-2035 (USD Billion)
      62. | | 7.16.3 BY TYPE, 2025-2035 (USD Billion)
      63. | 7.17 South Korea MARKET SIZE ESTIMATES; FORECAST
      64. | | 7.17.1 BY POWER RATING, 2025-2035 (USD Billion)
      65. | | 7.17.2 BY COOLING TYPE, 2025-2035 (USD Billion)
      66. | | 7.17.3 BY TYPE, 2025-2035 (USD Billion)
      67. | 7.18 Malaysia MARKET SIZE ESTIMATES; FORECAST
      68. | | 7.18.1 BY POWER RATING, 2025-2035 (USD Billion)
      69. | | 7.18.2 BY COOLING TYPE, 2025-2035 (USD Billion)
      70. | | 7.18.3 BY TYPE, 2025-2035 (USD Billion)
      71. | 7.19 Thailand MARKET SIZE ESTIMATES; FORECAST
      72. | | 7.19.1 BY POWER RATING, 2025-2035 (USD Billion)
      73. | | 7.19.2 BY COOLING TYPE, 2025-2035 (USD Billion)
      74. | | 7.19.3 BY TYPE, 2025-2035 (USD Billion)
      75. | 7.20 Indonesia MARKET SIZE ESTIMATES; FORECAST
      76. | | 7.20.1 BY POWER RATING, 2025-2035 (USD Billion)
      77. | | 7.20.2 BY COOLING TYPE, 2025-2035 (USD Billion)
      78. | | 7.20.3 BY TYPE, 2025-2035 (USD Billion)
      79. | 7.21 Rest of APAC MARKET SIZE ESTIMATES; FORECAST
      80. | | 7.21.1 BY POWER RATING, 2025-2035 (USD Billion)
      81. | | 7.21.2 BY COOLING TYPE, 2025-2035 (USD Billion)
      82. | | 7.21.3 BY TYPE, 2025-2035 (USD Billion)
      83. | 7.22 South America MARKET SIZE ESTIMATES; FORECAST
      84. | | 7.22.1 BY POWER RATING, 2025-2035 (USD Billion)
      85. | | 7.22.2 BY COOLING TYPE, 2025-2035 (USD Billion)
      86. | | 7.22.3 BY TYPE, 2025-2035 (USD Billion)
      87. | 7.23 Brazil MARKET SIZE ESTIMATES; FORECAST
      88. | | 7.23.1 BY POWER RATING, 2025-2035 (USD Billion)
      89. | | 7.23.2 BY COOLING TYPE, 2025-2035 (USD Billion)
      90. | | 7.23.3 BY TYPE, 2025-2035 (USD Billion)
      91. | 7.24 Mexico MARKET SIZE ESTIMATES; FORECAST
      92. | | 7.24.1 BY POWER RATING, 2025-2035 (USD Billion)
      93. | | 7.24.2 BY COOLING TYPE, 2025-2035 (USD Billion)
      94. | | 7.24.3 BY TYPE, 2025-2035 (USD Billion)
      95. | 7.25 Argentina MARKET SIZE ESTIMATES; FORECAST
      96. | | 7.25.1 BY POWER RATING, 2025-2035 (USD Billion)
      97. | | 7.25.2 BY COOLING TYPE, 2025-2035 (USD Billion)
      98. | | 7.25.3 BY TYPE, 2025-2035 (USD Billion)
      99. | 7.26 Rest of South America MARKET SIZE ESTIMATES; FORECAST
      100. | | 7.26.1 BY POWER RATING, 2025-2035 (USD Billion)
      101. | | 7.26.2 BY COOLING TYPE, 2025-2035 (USD Billion)
      102. | | 7.26.3 BY TYPE, 2025-2035 (USD Billion)
      103. | 7.27 MEA MARKET SIZE ESTIMATES; FORECAST
      104. | | 7.27.1 BY POWER RATING, 2025-2035 (USD Billion)
      105. | | 7.27.2 BY COOLING TYPE, 2025-2035 (USD Billion)
      106. | | 7.27.3 BY TYPE, 2025-2035 (USD Billion)
      107. | 7.28 GCC Countries MARKET SIZE ESTIMATES; FORECAST
      108. | | 7.28.1 BY POWER RATING, 2025-2035 (USD Billion)
      109. | | 7.28.2 BY COOLING TYPE, 2025-2035 (USD Billion)
      110. | | 7.28.3 BY TYPE, 2025-2035 (USD Billion)
      111. | 7.29 South Africa MARKET SIZE ESTIMATES; FORECAST
      112. | | 7.29.1 BY POWER RATING, 2025-2035 (USD Billion)
      113. | | 7.29.2 BY COOLING TYPE, 2025-2035 (USD Billion)
      114. | | 7.29.3 BY TYPE, 2025-2035 (USD Billion)
      115. | 7.30 Rest of MEA MARKET SIZE ESTIMATES; FORECAST
      116. | | 7.30.1 BY POWER RATING, 2025-2035 (USD Billion)
      117. | | 7.30.2 BY COOLING TYPE, 2025-2035 (USD Billion)
      118. | | 7.30.3 BY TYPE, 2025-2035 (USD Billion)
      119. | 7.31 PRODUCT LAUNCH/PRODUCT DEVELOPMENT/APPROVAL
      120. | | 7.31.1
      121. | 7.32 ACQUISITION/PARTNERSHIP
      122. | | 7.32.1

    Europe Transformer Market Segmentation

    Market Segmentation Overview

    • Detailed segmentation data will be available in the full report
    • Comprehensive analysis by multiple parameters
    • Regional and country-level breakdowns
    • Market size forecasts by segment
    Infographic

    Free Sample Request

    Kindly complete the form below to receive a free sample of this Report

    Get Free Sample

    Customer Strories

    “I am very pleased with how market segments have been defined in a relevant way for my purposes (such as "Portable Freezers & refrigerators" and "last-mile"). In general the report is well structured. Thanks very much for your efforts.”

    Victoria Milne

    Founder
    Case Study
    Chemicals and Materials

    Compare Licence

    ×
    Features License Type
    Single User Multiuser License Enterprise User
    Price $4,950 $5,950 $7,250
    Maximum User Access Limit 1 User Upto 10 Users Unrestricted Access Throughout the Organization
    Free Customization
    Direct Access to Analyst
    Deliverable Format
    Platform Access
    Discount on Next Purchase 10% 15% 15%
    Printable Versions