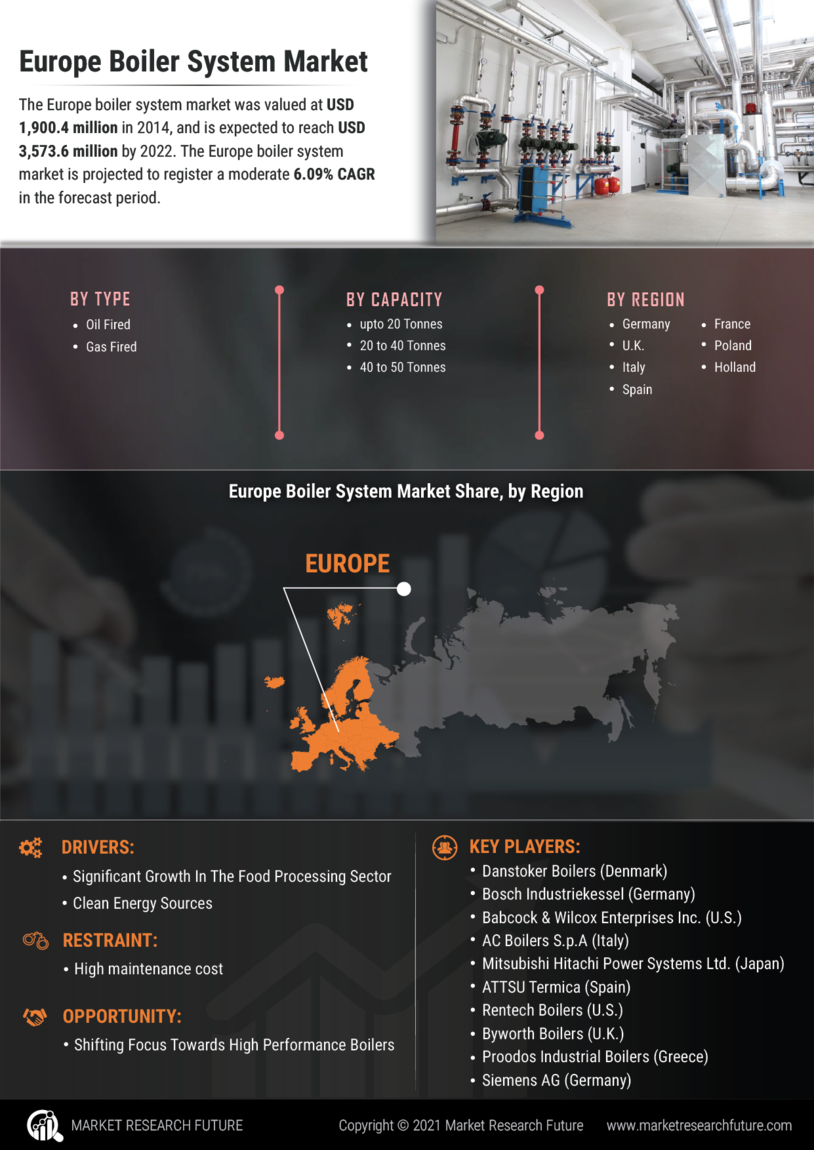
Request Free Sample ×

Kindly complete the form below to receive a free sample of this Report

* Please use a valid business email

Leading companies partner with us for data-driven Insights

clients tt-cursor
Hero Background

Europe Boiler System Market

ID: MRFR/Equip/1920-CR
59 Pages
Harshita Gorde
Last Updated: April 02, 2026

Europe Boiler System Market Research Report Information By Type (Oil Fired and Gas Fired), By Capacity (Upto 20 Tonnes, 20 to 40 Tonnes, and 40 to 50 Tonnes), and By Region (Europe) - Growth & Industry Forecast to 2035

Share:
Download PDF ×

We do not share your information with anyone. However, we may send you emails based on your report interest from time to time. You may contact us at any time to opt-out.

Europe Boiler System Market Infographic
Purchase Options
  1. 1 SECTION I: EXECUTIVE SUMMARY AND KEY HIGHLIGHTS
    1. 1.1 EXECUTIVE SUMMARY
      1. 1.1.1 Market Overview
      2. 1.1.2 Key Findings
      3. 1.1.3 Market Segmentation
      4. 1.1.4 Competitive Landscape
      5. 1.1.5 Challenges and Opportunities
      6. 1.1.6 Future Outlook
  2. 2 SECTION II: SCOPING, METHODOLOGY AND MARKET STRUCTURE
    1. 2.1 MARKET INTRODUCTION
      1. 2.1.1 Definition
      2. 2.1.2 Scope of the study
        1. 2.1.2.1 Research Objective
        2. 2.1.2.2 Assumption
        3. 2.1.2.3 Limitations
    2. 2.2 RESEARCH METHODOLOGY
      1. 2.2.1 Overview
      2. 2.2.2 Data Mining
      3. 2.2.3 Secondary Research
      4. 2.2.4 Primary Research
        1. 2.2.4.1 Primary Interviews and Information Gathering Process
        2. 2.2.4.2 Breakdown of Primary Respondents
      5. 2.2.5 Forecasting Model
      6. 2.2.6 Market Size Estimation
        1. 2.2.6.1 Bottom-Up Approach
        2. 2.2.6.2 Top-Down Approach
      7. 2.2.7 Data Triangulation
      8. 2.2.8 Validation
  3. 3 SECTION III: QUALITATIVE ANALYSIS
    1. 3.1 MARKET DYNAMICS
      1. 3.1.1 Overview
      2. 3.1.2 Drivers
      3. 3.1.3 Restraints
      4. 3.1.4 Opportunities
    2. 3.2 MARKET FACTOR ANALYSIS
      1. 3.2.1 Value chain Analysis
      2. 3.2.2 Porter's Five Forces Analysis
        1. 3.2.2.1 Bargaining Power of Suppliers
        2. 3.2.2.2 Bargaining Power of Buyers
        3. 3.2.2.3 Threat of New Entrants
        4. 3.2.2.4 Threat of Substitutes
        5. 3.2.2.5 Intensity of Rivalry
      3. 3.2.3 COVID-19 Impact Analysis
        1. 3.2.3.1 Market Impact Analysis
        2. 3.2.3.2 Regional Impact
        3. 3.2.3.3 Opportunity and Threat Analysis
  4. 4 SECTION IV: QUANTITATIVE ANALYSIS
    1. 4.1 Life Sciences, BY Type (USD Billion)
      1. 4.1.1 Fire-tube Boiler
      2. 4.1.2 Water-tube Boiler
      3. 4.1.3 Electric Boiler
      4. 4.1.4 Condensing Boiler
      5. 4.1.5 Combination Boiler
    2. 4.2 Life Sciences, BY Fuel Type (USD Billion)
      1. 4.2.1 Natural Gas
      2. 4.2.2 Oil
      3. 4.2.3 Coal
      4. 4.2.4 Biomass
      5. 4.2.5 Electricity
    3. 4.3 Life Sciences, BY End Use Industry (USD Billion)
      1. 4.3.1 Power Generation
      2. 4.3.2 Manufacturing
      3. 4.3.3 Food Processing
      4. 4.3.4 Healthcare
      5. 4.3.5 Chemical Processing
    4. 4.4 Life Sciences, BY Application (USD Billion)
      1. 4.4.1 Heating
      2. 4.4.2 Water Supply
      3. 4.4.3 Power Generation
      4. 4.4.4 Process Heat
      5. 4.4.5 Steam Production
  5. 5 SECTION V: COMPETITIVE ANALYSIS
    1. 5.1 Competitive Landscape
      1. 5.1.1 Overview
      2. 5.1.2 Competitive Analysis
      3. 5.1.3 Market share Analysis
      4. 5.1.4 Major Growth Strategy in the Life Sciences
      5. 5.1.5 Competitive Benchmarking
      6. 5.1.6 Leading Players in Terms of Number of Developments in the Life Sciences
      7. 5.1.7 Key developments and growth strategies
        1. 5.1.7.1 New Product Launch/Service Deployment
        2. 5.1.7.2 Merger & Acquisitions
        3. 5.1.7.3 Joint Ventures
      8. 5.1.8 Major Players Financial Matrix
        1. 5.1.8.1 Sales and Operating Income
        2. 5.1.8.2 Major Players R&D Expenditure. 2023
    2. 5.2 Company Profiles
      1. 5.2.1 Bosch (DE)
        1. 5.2.1.1 Financial Overview
        2. 5.2.1.2 Products Offered
        3. 5.2.1.3 Key Developments
        4. 5.2.1.4 SWOT Analysis
        5. 5.2.1.5 Key Strategies
      2. 5.2.2 Viessmann (DE)
        1. 5.2.2.1 Financial Overview
        2. 5.2.2.2 Products Offered
        3. 5.2.2.3 Key Developments
        4. 5.2.2.4 SWOT Analysis
        5. 5.2.2.5 Key Strategies
      3. 5.2.3 Ferroli (IT)
        1. 5.2.3.1 Financial Overview
        2. 5.2.3.2 Products Offered
        3. 5.2.3.3 Key Developments
        4. 5.2.3.4 SWOT Analysis
        5. 5.2.3.5 Key Strategies
      4. 5.2.4 Babcock & Wilcox (US)
        1. 5.2.4.1 Financial Overview
        2. 5.2.4.2 Products Offered
        3. 5.2.4.3 Key Developments
        4. 5.2.4.4 SWOT Analysis
        5. 5.2.4.5 Key Strategies
      5. 5.2.5 Mitsubishi (JP)
        1. 5.2.5.1 Financial Overview
        2. 5.2.5.2 Products Offered
        3. 5.2.5.3 Key Developments
        4. 5.2.5.4 SWOT Analysis
        5. 5.2.5.5 Key Strategies
      6. 5.2.6 Cleaver-Brooks (US)
        1. 5.2.6.1 Financial Overview
        2. 5.2.6.2 Products Offered
        3. 5.2.6.3 Key Developments
        4. 5.2.6.4 SWOT Analysis
        5. 5.2.6.5 Key Strategies
      7. 5.2.7 Aalborg (DK)
        1. 5.2.7.1 Financial Overview
        2. 5.2.7.2 Products Offered
        3. 5.2.7.3 Key Developments
        4. 5.2.7.4 SWOT Analysis
        5. 5.2.7.5 Key Strategies
      8. 5.2.8 Hurst Boiler (US)
        1. 5.2.8.1 Financial Overview
        2. 5.2.8.2 Products Offered
        3. 5.2.8.3 Key Developments
        4. 5.2.8.4 SWOT Analysis
        5. 5.2.8.5 Key Strategies
      9. 5.2.9 Zhongding (CN)
        1. 5.2.9.1 Financial Overview
        2. 5.2.9.2 Products Offered
        3. 5.2.9.3 Key Developments
        4. 5.2.9.4 SWOT Analysis
        5. 5.2.9.5 Key Strategies
    3. 5.3 Appendix
      1. 5.3.1 References
      2. 5.3.2 Related Reports
  6. 6 LIST OF FIGURES
    1. 6.1 MARKET SYNOPSIS
    2. 6.2 EUROPE MARKET ANALYSIS BY TYPE
    3. 6.3 EUROPE MARKET ANALYSIS BY FUEL TYPE
    4. 6.4 EUROPE MARKET ANALYSIS BY END USE INDUSTRY
    5. 6.5 EUROPE MARKET ANALYSIS BY APPLICATION
    6. 6.6 KEY BUYING CRITERIA OF LIFE SCIENCES
    7. 6.7 RESEARCH PROCESS OF MRFR
    8. 6.8 DRO ANALYSIS OF LIFE SCIENCES
    9. 6.9 DRIVERS IMPACT ANALYSIS: LIFE SCIENCES
    10. 6.10 RESTRAINTS IMPACT ANALYSIS: LIFE SCIENCES
    11. 6.11 SUPPLY / VALUE CHAIN: LIFE SCIENCES
    12. 6.12 LIFE SCIENCES, BY TYPE, 2024 (% SHARE)
    13. 6.13 LIFE SCIENCES, BY TYPE, 2024 TO 2035 (USD Billion)
    14. 6.14 LIFE SCIENCES, BY FUEL TYPE, 2024 (% SHARE)
    15. 6.15 LIFE SCIENCES, BY FUEL TYPE, 2024 TO 2035 (USD Billion)
    16. 6.16 LIFE SCIENCES, BY END USE INDUSTRY, 2024 (% SHARE)
    17. 6.17 LIFE SCIENCES, BY END USE INDUSTRY, 2024 TO 2035 (USD Billion)
    18. 6.18 LIFE SCIENCES, BY APPLICATION, 2024 (% SHARE)
    19. 6.19 LIFE SCIENCES, BY APPLICATION, 2024 TO 2035 (USD Billion)
    20. 6.20 BENCHMARKING OF MAJOR COMPETITORS
  7. 7 LIST OF TABLES
    1. 7.1 LIST OF ASSUMPTIONS
  8. 7.1.1
    1. 7.2 Europe MARKET SIZE ESTIMATES; FORECAST
      1. 7.2.1 BY TYPE, 2025-2035 (USD Billion)
      2. 7.2.2 BY FUEL TYPE, 2025-2035 (USD Billion)
      3. 7.2.3 BY END USE INDUSTRY, 2025-2035 (USD Billion)
      4. 7.2.4 BY APPLICATION, 2025-2035 (USD Billion)
    2. 7.3 PRODUCT LAUNCH/PRODUCT DEVELOPMENT/APPROVAL
  9. 7.3.1
    1. 7.4 ACQUISITION/PARTNERSHIP
  10. 7.4.1

Europe Life Sciences Market Segmentation

Life Sciences By Type (USD Billion, 2025-2035)

  • Fire-tube Boiler
  • Water-tube Boiler
  • Electric Boiler
  • Condensing Boiler
  • Combination Boiler

Life Sciences By Fuel Type (USD Billion, 2025-2035)

  • Natural Gas
  • Oil
  • Coal
  • Biomass
  • Electricity

Life Sciences By End Use Industry (USD Billion, 2025-2035)

  • Power Generation
  • Manufacturing
  • Food Processing
  • Healthcare
  • Chemical Processing

Life Sciences By Application (USD Billion, 2025-2035)

  • Heating
  • Water Supply
  • Power Generation
  • Process Heat
  • Steam Production

Compare Licence

×
Features License Type
Single User Multiuser License Enterprise User
Price $4,950 $5,950 $7,250
Maximum User Access Limit 1 User Upto 10 Users Unrestricted Access Throughout the Organization
Free Customization
Direct Access to Analyst
Deliverable Format
Platform Access
Discount on Next Purchase 10% 15% 15%
Printable Versions