×
  • Cat-intel
  • MedIntelliX
  • Resources
  • About Us
  • Request Free Sample ×

    Kindly complete the form below to receive a free sample of this Report

    Leading companies partner with us for data-driven Insights

    clients tt-cursor
    Hero Background

    Electronic Navigational Charts Market

    ID: MRFR/AT/36807-HCR
    100 Pages
    Sejal Akre
    October 2025

    Electronic Navigational Charts Market Research Report By Application (Maritime Navigation, Aviation Navigation, Surveying, Recreational Boating), By Technology (Raster Charts, Vector Charts, 3D Charts), By Deployment Mode (On-Premises, Cloud-Based), By End Use Industry (Marine Industry, Aviation Industry, Government and Defense) and By Regional (North America, Europe, South America, Asia Pacific, Middle East and Africa) - Forecast to 2035

    Share:
    Download PDF ×

    We do not share your information with anyone. However, we may send you emails based on your report interest from time to time. You may contact us at any time to opt-out.

    Electronic Navigational Charts Market Infographic
    Purchase Options

    Electronic Navigational Charts Market Summary

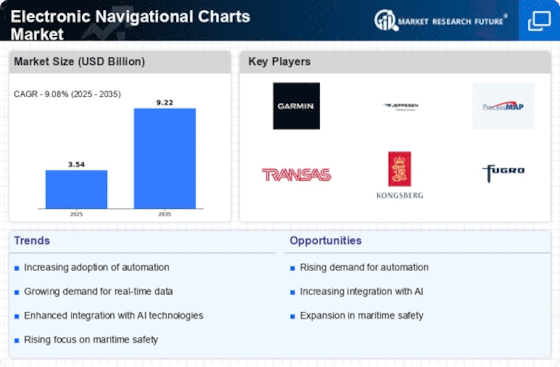
    As per MRFR analysis, the Electronic Navigational Charts Market Size was estimated at 3.543 USD Billion in 2024. The Electronic Navigational Charts industry is projected to grow from 3.865 in 2025 to 9.219 by 2035, exhibiting a compound annual growth rate (CAGR) of 9.08 during the forecast period 2025 - 2035.

    Key Market Trends & Highlights

    The Electronic Navigational Charts Market is poised for substantial growth driven by technological advancements and regulatory support.

    • North America remains the largest market for electronic navigational charts, reflecting a strong demand for maritime safety.
    • The Asia-Pacific region is emerging as the fastest-growing market, fueled by increasing maritime trade and technological adoption.
    • Maritime navigation continues to dominate the market, while aviation navigation is experiencing rapid growth due to advancements in digital solutions.
    • Key drivers include the growing adoption of autonomous vessels and regulatory support for digital navigation solutions, enhancing overall market dynamics.

    Market Size & Forecast

    2024 Market Size 3.543 (USD Billion)
    2035 Market Size 9.219 (USD Billion)
    CAGR (2025 - 2035) 9.08%

    Major Players

    Navionics (US), Jeppesen (US), C-MAP (NO), Transas (RU), Kongsberg (NO), Fugro (NL), ChartWorld (DE), MarineTraffic (GR), Orolia (FR)

    Electronic Navigational Charts Market Trends

    The Electronic Navigational Charts Market is currently experiencing a transformative phase, driven by advancements in technology and increasing demand for precise navigation solutions. The integration of electronic navigational charts with modern navigation systems enhances maritime safety and operational efficiency. As vessels become more reliant on digital solutions, the need for accurate and up-to-date charts is paramount. This trend is further fueled by regulatory requirements that mandate the use of electronic charts in various maritime operations. Additionally, the growing emphasis on environmental sustainability is prompting the adoption of eco-friendly navigation practices, which may influence the market dynamics in the coming years. Moreover, the Electronic Navigational Charts Market appears to be expanding due to the rising popularity of autonomous vessels and the increasing complexity of maritime routes. The shift towards automation in shipping operations necessitates sophisticated navigational tools that can adapt to changing conditions. Furthermore, the collaboration between technology providers and maritime organizations is likely to foster innovation, leading to the development of more advanced charting solutions. As the industry evolves, stakeholders must remain vigilant to emerging trends and adapt their strategies accordingly to maintain competitiveness in this dynamic landscape.

    Technological Advancements

    The Electronic Navigational Charts Market is witnessing rapid technological advancements that enhance the functionality and accuracy of navigational tools. Innovations such as real-time data integration and improved user interfaces are becoming increasingly prevalent, allowing mariners to make informed decisions swiftly. This trend suggests a shift towards more sophisticated systems that can process vast amounts of information seamlessly.

    Regulatory Compliance

    Regulatory compliance is a driving force in the Electronic Navigational Charts Market, as maritime authorities worldwide enforce stringent guidelines for navigation safety. The necessity for electronic charts in various shipping operations is becoming more pronounced, compelling stakeholders to invest in compliant solutions. This trend indicates a growing awareness of safety and operational efficiency within the industry.

    Sustainability Initiatives

    Sustainability initiatives are emerging as a significant trend within the Electronic Navigational Charts Market. As environmental concerns gain prominence, the industry is increasingly focusing on eco-friendly navigation practices. This shift may lead to the development of solutions that not only enhance navigational accuracy but also minimize the ecological impact of maritime operations.

    Electronic Navigational Charts Market Drivers

    Expansion of Maritime Trade Routes

    The expansion of maritime trade routes is a key driver for the Electronic Navigational Charts Market. As global trade continues to flourish, new shipping lanes are being established, necessitating the development and updating of electronic navigational charts. This expansion is particularly evident in regions such as the Arctic, where melting ice is opening new pathways for shipping. The need for accurate and up-to-date navigational information is critical for vessels operating in these newly accessible areas. Consequently, the market is likely to see increased investment in chart production and updates, ensuring that navigational safety is maintained in these evolving trade routes.

    Increased Demand for Maritime Safety

    The Electronic Navigational Charts Market is experiencing heightened demand driven by the increasing emphasis on maritime safety. As shipping activities expand, the need for accurate and reliable navigational tools becomes paramount. The International Maritime Organization has set forth regulations that necessitate the use of electronic navigational aids, thereby propelling the adoption of electronic navigational charts. This trend is further supported by the growing number of vessels operating in congested waters, where precise navigation is critical to avoid accidents. The market is projected to grow at a compound annual growth rate of approximately 6.5% over the next five years, reflecting the industry's response to safety concerns and regulatory requirements.

    Integration of Advanced Technologies

    The integration of advanced technologies into the Electronic Navigational Charts Market is a significant driver of growth. Innovations such as artificial intelligence, machine learning, and real-time data analytics are enhancing the functionality of electronic navigational charts. These technologies enable mariners to make informed decisions based on real-time environmental data, improving navigation efficiency and safety. For instance, the incorporation of satellite-based positioning systems has revolutionized the accuracy of electronic charts, making them indispensable for modern navigation. As these technologies continue to evolve, they are likely to attract more users, thereby expanding the market further.

    Growing Adoption of Autonomous Vessels

    The rise of autonomous vessels is poised to transform the Electronic Navigational Charts Market. As the maritime sector increasingly embraces automation, the demand for sophisticated electronic navigational charts that can support autonomous navigation systems is surging. These charts provide essential data for route planning and obstacle avoidance, which are critical for the safe operation of unmanned vessels. Industry analysts predict that the market for autonomous ships will grow significantly, with electronic navigational charts playing a crucial role in their operational frameworks. This trend indicates a shift in how navigational tools are utilized, potentially leading to a more streamlined and efficient maritime industry.

    Regulatory Support for Digital Navigation Solutions

    Regulatory support for digital navigation solutions is significantly influencing the Electronic Navigational Charts Market. Governments and maritime authorities are increasingly endorsing the use of electronic navigational charts as part of their efforts to modernize maritime operations. This support is evident in various initiatives aimed at promoting the adoption of digital navigation tools, which are seen as essential for enhancing safety and efficiency in maritime transport. For example, regulations mandating the use of electronic charts in certain jurisdictions are driving demand. As regulatory frameworks continue to evolve, they are likely to create a more favorable environment for the growth of the electronic navigational charts market.

    Market Segment Insights

    By Application: Maritime Navigation (Largest) vs. Aviation Navigation (Fastest-Growing)

    In the Electronic Navigational Charts Market, the market share distribution reveals that Maritime Navigation holds the largest share among the segments, owing to its extensive application in shipping and commercial transportation. This segment benefits from the growing global trade and the need for efficient maritime operations. Meanwhile, Aviation Navigation is gaining traction, propelled by the increasing number of air traffic and more stringent regulations for safety and navigational accuracy in the aviation sector. The growing trends within these segments indicate that Maritime Navigation will continue to dominate market share due to its established use and necessity in global logistics. Conversely, Aviation Navigation is expected to grow at the fastest rate due to advancements in aeronautical technology and the rising demand for real-time data processing, leading to improved operational efficiency and safety in air travel.

    Maritime Navigation (Dominant) vs. Surveying (Emerging)

    The dominance of Maritime Navigation in the Electronic Navigational Charts Market is underscored by its critical role in facilitating safe and efficient transportation via waterways. This segment stands out due to its requirement for precision and reliability, driven by shipping regulations and advancements in navigational technologies. In contrast, the Surveying segment, while emerging, showcases a steady growth driven by increasing interests in geographical information systems and infrastructure development projects. Surveying relies on high-resolution charts that assist professionals in mapping and environmental management. Although it currently holds a smaller share compared to Maritime Navigation, the rising demand for accurate topographical data is propelling its growth, making it a segment to watch in upcoming years.

    By Technology: Vector Charts (Largest) vs. 3D Charts (Fastest-Growing)

    In the Electronic Navigational Charts market, the segment is prominently led by Vector Charts, which dominate the technology landscape due to their efficient data representation and versatility. They capture a substantial market share, largely favored by navigation systems for their scalability and accuracy. Raster Charts follow, positioned as an essential component, although not as widely preferred for modern applications due to their limitations in resolution and updating capabilities. The growth trends indicate that while Vector Charts maintain their lead, 3D Charts have emerged as the fastest-growing segment. This growth is driven by the increasing demand for enhanced visualization in navigation, allowing users to better interpret maritime environments. Innovations and advancements in technology are propelling 3D charts into higher adoption rates, reflecting shifts toward more immersive navigational solutions.

    Technology: Vector Charts (Dominant) vs. 3D Charts (Emerging)

    Vector Charts are recognized as the dominant technology in the Electronic Navigational Charts market due to their precision, updatability, and interactive features that aid maritime navigation. They provide a clear advantage in representing complex data and are widely used across various navigation systems. In contrast, 3D Charts represent an emerging technology designed to offer users an enhanced perspective of navigational data, incorporating topographical details that are essential for improving situational awareness. Despite being newer in the marketplace, the adoption of 3D Charts is rapidly increasing, particularly in sectors requiring comprehensive environmental visualization. Their unique offerings are quickly transforming user experiences and enhancing operational safety in navigation.

    By Deployment Mode: On-Premises (Largest) vs. Cloud-Based (Fastest-Growing)

    In the Electronic Navigational Charts Market, the deployment mode segment is primarily divided into On-Premises and Cloud-Based solutions. On-Premises deployment continues to hold a significant share of the market, favored by organizations that prioritize control and security over their navigational data. Meanwhile, Cloud-Based solutions are rapidly gaining traction, currently becoming more appealing for their flexibility and scalability, particularly among small to medium-sized enterprises seeking to minimize upfront costs.

    Deployment Mode: On-Premises (Dominant) vs. Cloud-Based (Emerging)

    On-Premises deployment models are characterized by robust data security, control, and customization, making them popular among larger organizations with complex navigational requirements. However, Cloud-Based deployments are emerging as a game-changer by offering benefits such as remote accessibility, lower maintenance costs, and seamless updates. As more maritime and aviation sectors move towards digital transformation, Cloud-Based solutions facilitate real-time collaboration and access to the latest navigational data without the constraints of physical hardware. This shift reflects a growing trend towards agility and efficiency in electronic chart management.

    By End Use Industry: Marine Industry (Largest) vs. Aviation Industry (Fastest-Growing)

    The Electronic Navigational Charts Market is primarily driven by three key segments: the Marine Industry, the Aviation Industry, and the Government and Defense sector. Among these, the Marine Industry holds the largest share due to its established reliance on electronic navigational systems for maritime safety and efficiency. The Aviation Industry, while currently smaller, is rapidly expanding as advancements in aviation technology and regulatory shifts increase the adoption of electronic charts for flight navigation.

    Marine Industry (Dominant) vs. Aviation Industry (Emerging)

    The Marine Industry remains the dominant force within the Electronic Navigational Charts Market, characterized by its extensive use of electronic charts in commercial shipping, fishing, and recreational boating. It benefits from a legacy of mandated navigational safety protocols that promote the utilization of cutting-edge electronic systems. Conversely, the Aviation Industry is emerging as a fast-growing segment, spurred by innovations in autopilot systems and real-time data integration. This segment is increasingly adopting electronic navigational technologies, driven by the need for enhanced flight safety and efficiency, hinting at a significant shift in industry standards.

    Get more detailed insights about Electronic Navigational Charts Market

    Regional Insights

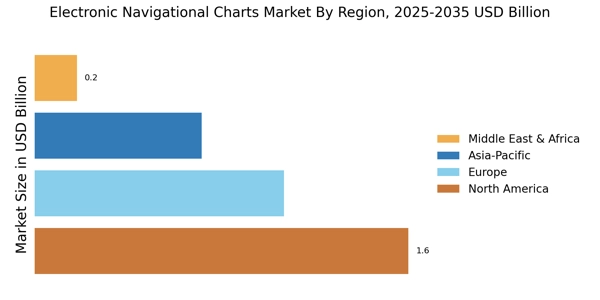
    North America : Leading Innovation and Adoption

    North America is the largest market for Electronic Navigational Charts (ENCs), holding approximately 45% of the global market share. The region's growth is driven by increasing maritime trade, advancements in technology, and stringent regulations promoting safety and efficiency in navigation. The U.S. Coast Guard and other regulatory bodies are pivotal in enforcing standards that enhance the adoption of electronic charts. The United States and Canada are the leading countries in this market, with significant investments in maritime infrastructure and technology. Key players such as Navionics and Jeppesen dominate the landscape, offering innovative solutions tailored to the needs of commercial and recreational mariners. The competitive environment is characterized by continuous technological advancements and partnerships aimed at enhancing navigational safety and efficiency.

    Europe : Regulatory Framework and Growth

    Europe is the second-largest market for Electronic Navigational Charts, accounting for approximately 30% of the global share. The region's growth is fueled by the European Union's initiatives to enhance maritime safety and environmental protection, alongside increasing demand for digital navigation solutions. Regulations such as the EU's Marine Equipment Directive play a crucial role in shaping the market landscape, ensuring compliance and safety in maritime operations. Leading countries in Europe include Norway, Germany, and the Netherlands, where key players like C-MAP and ChartWorld are based. The competitive landscape is marked by a mix of established companies and emerging startups, all striving to innovate and meet the evolving needs of the maritime industry. The presence of advanced maritime technology and a strong regulatory framework further bolster the region's market potential.

    Asia-Pacific : Emerging Market with Potential

    Asia-Pacific is witnessing rapid growth in the Electronic Navigational Charts market, holding about 20% of the global share. The region's expansion is driven by increasing shipping activities, investments in maritime infrastructure, and a growing emphasis on safety and efficiency in navigation. Countries like China and Japan are leading the charge, supported by government initiatives aimed at modernizing their maritime sectors and enhancing navigational safety. China, Japan, and Australia are the primary markets within this region, with a competitive landscape featuring both local and international players. Companies like Fugro and MarineTraffic are making significant inroads, offering tailored solutions to meet regional demands. The market is characterized by a blend of traditional practices and modern technology, creating a unique environment for growth and innovation.

    Middle East and Africa : Untapped Potential and Growth

    The Middle East and Africa region is emerging as a potential market for Electronic Navigational Charts, currently holding about 5% of the global share. The growth is driven by increasing maritime trade, investments in port infrastructure, and a rising focus on safety regulations. Countries like South Africa and the UAE are at the forefront, with governments actively promoting the adoption of digital navigation solutions to enhance maritime safety and efficiency. In this region, the competitive landscape is still developing, with a mix of local and international players entering the market. Companies are focusing on building partnerships and collaborations to expand their reach. The presence of key players like Orolia and Transas is helping to drive innovation and meet the growing demand for electronic navigational solutions, paving the way for future growth.

    Key Players and Competitive Insights

    The Electronic Navigational Charts Market is currently characterized by a dynamic competitive landscape, driven by technological advancements and increasing demand for precise navigation solutions. Key players such as Navionics (US), Jeppesen (US), and C-MAP (NO) are at the forefront, each adopting distinct strategies to enhance their market positioning. Navionics (US) focuses on innovation through continuous updates to its charting technology, while Jeppesen (US) emphasizes partnerships with aviation and maritime organizations to expand its service offerings. C-MAP (NO) is actively pursuing regional expansion, particularly in emerging markets, thereby diversifying its customer base. Collectively, these strategies contribute to a competitive environment that is increasingly reliant on technological prowess and strategic collaborations.

    In terms of business tactics, companies are localizing manufacturing and optimizing supply chains to enhance efficiency and responsiveness to market demands. The market structure appears moderately fragmented, with several players vying for market share. However, the influence of major companies is substantial, as they set industry standards and drive innovation. This competitive structure fosters an environment where smaller firms may struggle to keep pace, yet it also encourages collaboration and partnerships among key players to leverage shared resources and expertise.

    In August 2025, Navionics (US) announced a significant upgrade to its mobile application, integrating advanced AI features for real-time weather updates and navigational alerts. This strategic move not only enhances user experience but also positions Navionics (US) as a leader in leveraging technology to improve safety and efficiency in navigation. The integration of AI into their offerings suggests a commitment to staying ahead of technological trends, which could attract a broader user base.

    In September 2025, Jeppesen (US) entered into a strategic partnership with a leading drone technology firm to develop integrated navigational solutions for unmanned aerial vehicles (UAVs). This collaboration is indicative of Jeppesen's (US) forward-thinking approach, as it seeks to tap into the burgeoning UAV market. By aligning with a technology innovator, Jeppesen (US) not only diversifies its product portfolio but also positions itself to capture new revenue streams in an evolving sector.

    In July 2025, C-MAP (NO) launched a new initiative aimed at enhancing its digital chart offerings through partnerships with local hydrographic offices. This initiative underscores C-MAP's (NO) commitment to regional expansion and collaboration with local authorities, which may enhance the accuracy and reliability of its charts. Such strategic actions are likely to bolster C-MAP's (NO) reputation and market presence, particularly in regions where local knowledge is crucial for effective navigation.

    As of October 2025, the Electronic Navigational Charts Market is witnessing trends that emphasize digitalization, sustainability, and the integration of artificial intelligence. Strategic alliances are increasingly shaping the competitive landscape, allowing companies to pool resources and expertise to innovate more effectively. Looking ahead, it appears that competitive differentiation will evolve from traditional price-based competition to a focus on innovation, technological advancements, and supply chain reliability. This shift may redefine how companies engage with customers and develop their offerings, ultimately leading to a more sophisticated and resilient market.

    Key Companies in the Electronic Navigational Charts Market market include

    Industry Developments

    • Q2 2024: NOAA Completes Transition to Electronic Navigational Charts, Retires All Traditional Paper Charts NOAA announced the official retirement of all traditional paper nautical charts, completing its multi-year transition to exclusive use of electronic navigational charts (ENCs) for U.S. waters, marking a major regulatory and operational milestone for the maritime industry.
    • Q1 2024: Garmin Launches Next-Generation BlueChart g3 Vision Electronic Navigational Charts Garmin introduced its latest BlueChart g3 Vision ENCs, featuring enhanced detail, new high-resolution relief shading, and expanded coverage for commercial and recreational mariners.
    • Q2 2024: C-MAP Partners with Raymarine to Deliver Integrated Electronic Charting Solutions C-MAP announced a strategic partnership with Raymarine to provide integrated electronic navigational charting solutions for Raymarine’s new Axiom 2 Pro series, enhancing real-time navigation capabilities for professional mariners.
    • Q3 2024: Jeppesen Marine Secures Multi-Year Contract to Supply ENCs to European Coast Guard Agencies Jeppesen Marine, a Boeing subsidiary, won a multi-year contract to supply updated electronic navigational charts and data services to several European coast guard agencies, supporting safe navigation and regulatory compliance.
    • Q2 2024: UKHO Announces Full Digital Transition, Sets 2025 Deadline for Paper Chart Withdrawal The UK Hydrographic Office confirmed it will withdraw all Admiralty paper charts by the end of 2025, accelerating the maritime sector’s shift to digital navigation using ENCs.
    • Q1 2024: Navionics Unveils Advanced SonarChart Shading for Electronic Navigational Charts Navionics launched a new SonarChart Shading feature for its ENCs, providing mariners with enhanced underwater topography visualization for safer and more precise navigation.
    • Q2 2024: Transas Launches S-100 Compatible Electronic Navigational Chart System Transas, a Wärtsilä company, released a new S-100 compatible ENC system, aligning with the latest International Hydrographic Organization standards for next-generation maritime navigation.
    • Q3 2024: Fugawi Announces Partnership with Maptech to Expand ENC Distribution in North America Fugawi entered a partnership with Maptech to broaden the distribution of electronic navigational charts and digital navigation products across North America, targeting both commercial and leisure marine markets.
    • Q2 2024: U.S. Coast Guard Approves New Electronic Chart Display and Information System (ECDIS) for Domestic Vessels The U.S. Coast Guard approved a new ECDIS platform for use on U.S.-flagged vessels, enabling compliance with updated electronic chart carriage requirements and enhancing navigational safety.
    • Q1 2025: Garmin Acquires Nobeltec to Expand Electronic Navigational Chart Portfolio Garmin announced the acquisition of Nobeltec, a leading provider of marine navigation software and ENCs, to strengthen its position in the global electronic navigational charts market.
    • Q2 2025: Navico Group Opens New ENC Data Center in Singapore Navico Group, parent of C-MAP, opened a new electronic navigational chart data center in Singapore to support growing demand for digital navigation solutions in the Asia-Pacific region.
    • Q2 2024: Raymarine Launches New Chartplotter Series with Enhanced ENC Integration Raymarine introduced a new chartplotter series designed for seamless integration with the latest electronic navigational charts, offering advanced route planning and real-time hazard alerts.

    Future Outlook

    Electronic Navigational Charts Market Future Outlook

    The Electronic Navigational Charts Market is projected to grow at a 9.08% CAGR from 2024 to 2035, driven by technological advancements, regulatory support, and increasing maritime safety demands.

    New opportunities lie in:

    • Integration of AI-driven analytics for real-time navigational insights.
    • Development of subscription-based models for continuous chart updates.
    • Expansion into emerging markets with tailored navigational solutions.

    By 2035, the market is expected to be robust, reflecting substantial growth and innovation.

    Market Segmentation

    Electronic Navigational Charts Market Technology Outlook

    • Raster Charts
    • Vector Charts
    • 3D Charts

    Electronic Navigational Charts Market Application Outlook

    • Maritime Navigation
    • Aviation Navigation
    • Surveying
    • Recreational Boating

    Electronic Navigational Charts Market Deployment Mode Outlook

    • On-Premises
    • Cloud-Based

    Electronic Navigational Charts Market End Use Industry Outlook

    • Marine Industry
    • Aviation Industry
    • Government and Defense

    Report Scope

    MARKET SIZE 20243.543(USD Billion)
    MARKET SIZE 20253.865(USD Billion)
    MARKET SIZE 20359.219(USD Billion)
    COMPOUND ANNUAL GROWTH RATE (CAGR)9.08% (2024 - 2035)
    REPORT COVERAGERevenue Forecast, Competitive Landscape, Growth Factors, and Trends
    BASE YEAR2024
    Market Forecast Period2025 - 2035
    Historical Data2019 - 2024
    Market Forecast UnitsUSD Billion
    Key Companies ProfiledMarket analysis in progress
    Segments CoveredMarket segmentation analysis in progress
    Key Market OpportunitiesIntegration of artificial intelligence in Electronic Navigational Charts enhances navigation accuracy and user experience.
    Key Market DynamicsTechnological advancements and regulatory changes drive the adoption of Electronic Navigational Charts in maritime navigation.
    Countries CoveredNorth America, Europe, APAC, South America, MEA

    Leave a Comment

    FAQs

    What is the current valuation of the Electronic Navigational Charts Market?

    The Electronic Navigational Charts Market was valued at 3.543 USD Billion in 2024.

    What is the projected market size for the Electronic Navigational Charts Market by 2035?

    The market is projected to reach 9.219 USD Billion by 2035.

    What is the expected CAGR for the Electronic Navigational Charts Market during the forecast period 2025 - 2035?

    The expected CAGR for the market during the forecast period 2025 - 2035 is 9.08%.

    Which application segments are driving growth in the Electronic Navigational Charts Market?

    The Maritime Navigation segment is projected to grow from 1.5 to 3.8 USD Billion, indicating strong demand.

    How do the technology segments of raster, vector, and 3D charts compare in terms of market valuation?

    Vector Charts are expected to grow from 1.5 to 4.0 USD Billion, suggesting a robust preference for this technology.

    What are the deployment modes for Electronic Navigational Charts, and how are they valued?

    Both On-Premises and Cloud-Based deployment modes are valued at 1.7715 to 4.6095 USD Billion, reflecting equal market interest.

    Which end-use industries are contributing to the Electronic Navigational Charts Market growth?

    The Marine Industry is anticipated to grow from 1.5 to 3.8 USD Billion, highlighting its significance in the market.

    Who are the key players in the Electronic Navigational Charts Market?

    Key players include Navionics, Jeppesen, C-MAP, and others, indicating a competitive landscape.

    What is the growth potential for the Aviation Navigation segment within the market?

    The Aviation Navigation segment is projected to grow from 0.8 to 2.0 USD Billion, suggesting increasing adoption.

    How does the growth of the Government and Defense sector impact the Electronic Navigational Charts Market?

    The Government and Defense sector is expected to grow from 0.843 to 2.519 USD Billion, indicating its rising importance.

    Download Free Sample

    Kindly complete the form below to receive a free sample of this Report

    Case Study
    Chemicals and Materials

    Compare Licence

    ×
    Features License Type
    Single User Multiuser License Enterprise User
    Price $4,950 $5,950 $7,250
    Maximum User Access Limit 1 User Upto 10 Users Unrestricted Access Throughout the Organization
    Free Customization
    Direct Access to Analyst
    Deliverable Format
    Platform Access
    Discount on Next Purchase 10% 15% 15%
    Printable Versions