


Earth Observation Satellite Size
Market Size Snapshot
| Year | Value |
|---|---|
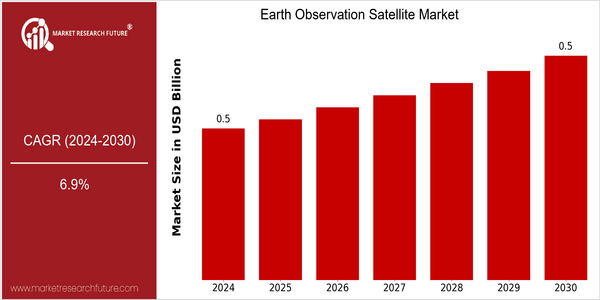
| 2024 | USD 0.5 Billion |
| 2030 | USD 0.5 Billion |
| CAGR (2024-2030) | 6.9 % |
Note – Market size depicts the revenue generated over the financial year
The Earth Observation Satellite Market is poised for significant growth, with a current market size of USD 0.5 billion in 2024, projected to maintain the same size by 2030. However, the market is expected to experience a compound annual growth rate (CAGR) of 6.9% during this period, indicating a robust expansion in the sector driven by increasing demand for satellite data across various applications. This growth trend reflects the rising importance of Earth observation technologies in sectors such as agriculture, urban planning, disaster management, and environmental monitoring.
Several factors are propelling this market forward, including advancements in satellite technology, the proliferation of small satellites, and the growing need for real-time data analytics. Innovations such as high-resolution imaging and enhanced data processing capabilities are enabling more precise monitoring of environmental changes and resource management. Key players in the industry, such as Maxar Technologies, Planet Labs, and Airbus, are actively engaging in strategic initiatives, including partnerships and investments in new satellite launches, to enhance their service offerings and expand their market reach. These developments underscore the dynamic nature of the Earth Observation Satellite Market and its critical role in addressing global challenges.
Regional Market Size
Regional Deep Dive
The Earth Observation Satellite Market is experiencing significant growth across various regions, driven by advancements in satellite technology, increasing demand for environmental monitoring, and the need for data analytics in sectors such as agriculture, urban planning, and disaster management. Each region exhibits unique characteristics that influence market dynamics, including regulatory frameworks, technological capabilities, and economic conditions. As nations prioritize sustainability and data-driven decision-making, the market is poised for further expansion, with investments in satellite infrastructure and innovative applications becoming increasingly prevalent.
Europe
- The European Space Agency (ESA) has launched the Copernicus program, which aims to provide comprehensive Earth observation data to support environmental policies and climate action, significantly influencing the market's direction in Europe.
- Regulatory frameworks in the EU, such as the European Green Deal, are driving demand for satellite data to monitor environmental compliance and sustainability, creating new opportunities for satellite service providers.
Asia Pacific
- Countries like China and India are ramping up their Earth observation satellite programs, with China's Gaofen series and India's RISAT series focusing on agricultural monitoring and disaster management, reflecting the region's growing emphasis on food security and climate resilience.
- The increasing collaboration between governments and private sector players in countries like Japan and Australia is fostering innovation in satellite technology and data analytics, enhancing the overall market landscape.
Latin America
- Brazil's National Institute for Space Research (INPE) is utilizing satellite data for deforestation monitoring in the Amazon, highlighting the critical role of Earth observation in environmental protection efforts in the region.
- The growing interest in satellite-based solutions for agriculture in countries like Argentina and Chile is driving demand for Earth observation data, as farmers seek to optimize crop yields and resource management.
North America
- The U.S. government has significantly increased its investment in Earth observation capabilities, with NASA's Earth Science Division focusing on satellite missions that enhance climate monitoring and disaster response, such as the Landsat program.
- Private companies like Planet Labs and Maxar Technologies are leading the charge in commercial satellite imagery, providing high-resolution data for various applications, including agriculture and urban development, which is reshaping the competitive landscape.
Middle East And Africa
- The UAE's Mohammed bin Rashid Space Centre has launched the KhalifaSat, which is expected to enhance the region's capabilities in Earth observation, particularly for urban planning and environmental monitoring.
- In Africa, initiatives like the African Space Strategy are promoting the use of satellite data for sustainable development goals, encouraging regional cooperation and investment in Earth observation technologies.
Did You Know?
“Over 90% of the world's data is generated from satellite imagery and Earth observation data, which is increasingly being used for applications ranging from climate change monitoring to urban planning.” — World Economic Forum
Segmental Market Size
The Earth Observation Satellite Market is experiencing robust growth, driven by increasing demand for satellite imagery and data analytics across various sectors. Key factors propelling this segment include the rising need for environmental monitoring, urban planning, and disaster management, alongside regulatory policies promoting sustainable practices. Technological advancements in satellite design and data processing further enhance the appeal of this segment, making it a critical component of the overall market.
Currently, the adoption stage of Earth observation satellites is transitioning from pilot phases to scaled deployment, with notable leaders such as Planet Labs and Maxar Technologies spearheading initiatives in North America and Europe. Primary applications include agriculture monitoring, climate change analysis, and infrastructure development, where companies leverage satellite data for precision farming and urban development. Macro trends such as climate change awareness and government mandates for sustainability initiatives are accelerating growth, while advancements in AI and machine learning are shaping the evolution of data analytics in this segment.
Future Outlook
The Earth Observation Satellite Market is poised for significant growth from 2024 to 2030, with a projected compound annual growth rate (CAGR) of 6.9%. By 2030, the market value is expected to reach approximately $0.5 billion, driven by increasing demand for satellite data across various sectors, including agriculture, urban planning, disaster management, and environmental monitoring. As governments and private entities recognize the value of satellite imagery for decision-making and resource management, the penetration of Earth observation technologies is anticipated to rise substantially, with usage rates expected to exceed 30% in key industries by the end of the forecast period.
Key technological advancements, such as the development of small satellites and enhanced data analytics capabilities, are expected to further propel market growth. The integration of artificial intelligence and machine learning in processing satellite data will enable more accurate and timely insights, thereby expanding the application scope of Earth observation satellites. Additionally, supportive government policies and international collaborations aimed at addressing climate change and promoting sustainable development will serve as critical drivers for market expansion. As the demand for real-time data continues to escalate, the Earth Observation Satellite Market is set to evolve, presenting lucrative opportunities for stakeholders and fostering innovation in satellite technology.


Leave a Comment