ID: MRFR/E&P/7336-HCR | February 2021 | Region: Global | 111 Pages
Table of Contents
1 Executive Summary
2 Market Introduction
2.1 Market Definition
2.2 Scope of the Study
2.3 Market Structure
3 Research Methodology
3.1 Primary Research
3.2 Secondary Research
3.3 Market Type Estimation
3.4 Forecast Model
3.5 List of Assumptions
3.6 Limitations of the Study
4 Market Insights
5 Market Dynamics
5.1 Introduction
5.2 Market Drivers
5.3 Market Restraints
5.4 Market Opportunities
5.5 Porterβs Five Forces Analysis
5.5.1 Threat of New Entrants
5.5.2 Bargaining Power of Buyers
5.5.3 Bargaining Power of Suppliers
5.5.4 Threat of Substitutes
5.5.5 Rivalry
5.6 Value Chain/Supply Chain Analysis
6 Global Drones for Oil & Gas Market, by Type
6.1 Introduction
6.2 Single-Rotor
6.2.1 Market Estimates & Forecast, 2020β2027
6.2.2 Market Estimates & Forecast, by Region, 2020β2027
6.3 Multi-Rotor
6.3.1 Market Estimates & Forecast, 2020β2027
6.3.2 Market Estimates & Forecast, by Region, 2020β2027
6.4 Fixed Wing
6.4.1 Market Estimates & Forecast, 2020β2027
6.4.2 Market Estimates & Forecast, by Region, 2020β2027
6.5 Hybrid & Nano
6.5.1 Market Estimates & Forecast, 2020β2027
6.5.2 Market Estimates & Forecast, by Region, 2020β2027
7 Global Drones for Oil & Gas Market, by Application
7.1 Introduction
7.2 Inspection
7.2.1 Market Estimates & Forecast, 2020β2027
7.2.2 Market Estimates & Forecast, by Region, 2020β2027
7.3 Surveying & Mapping
7.3.1 Market Estimates & Forecast, 2020β2027
7.3.2 Market Estimates & Forecast, by Region, 2020β2027
7.4 Security and Emergency Response
7.4.1.1 Market Estimates & Forecast, 2020β2027
7.4.1.2 Market Estimates & Forecast, by Region, 2020β2027
8 Global Drones for Oil & Gas Market, by Region
8.1 Introduction
8.2 North America
8.2.1 Market Estimates & Forecast, by Services, 2020β2027
8.2.2 Market Estimates & Forecast, by Type, 2020β2027
8.2.3 Market Estimates & Forecast, by Application, 2020β2027
8.2.4 Market Estimates & Forecast, by Country, 2020β2027
8.2.5 US
8.2.5.1 Market Estimates & Forecast, by Services, 2020β2027
8.2.5.2 Market Estimates & Forecast, by Type, 2020β2027
8.2.5.3 Market Estimates & Forecast, by Plant Type, 2020β2027
8.2.6 Canada
8.2.6.1 Market Estimates & Forecast, by Services, 2020β2027
8.2.6.2 Market Estimates & Forecast, by Type, 2020β2027
8.2.6.3 Market Estimates & Forecast, by Plant Type, 2020β2027
8.2.7 Mexico
8.2.7.1 Market Estimates & Forecast, by Services, 2020β2027
8.2.7.2 Market Estimates & Forecast, by Type, 2020β2027
8.2.7.3 Market Estimates & Forecast, by Application, 2020β2027
8.3 Europe
8.3.1 Market Estimates & Forecast, by Services, 2020β2027
8.3.2 Market Estimates & Forecast, by Type, 2020β2027
8.3.3 Market Estimates & Forecast, by Application, 2020β2027
8.3.4 Market Estimates & Forecast, by Country, 2020β2027
8.3.5 Norway
8.3.5.1 Market Estimates & Forecast, by Services, 2020β2027
8.3.5.2 Market Estimates & Forecast, by Type, 2020β2027
8.3.5.3 Market Estimates & Forecast, by Application, 2020β2027
8.3.6 UK
8.3.6.1 Market Estimates & Forecast, by Services, 2020β2027
8.3.6.2 Market Estimates & Forecast, by Type, 2020β2027
8.3.6.3 Market Estimates & Forecast, by Application, 2020β2027
8.3.7 Denmark
8.3.7.1 Market Estimates & Forecast, by Services, 2020β2027
8.3.7.2 Market Estimates & Forecast, by Type, 2020β2027
8.3.7.3 Market Estimates & Forecast, by Application, 2020β2027
8.3.8 Rest of Europe
8.3.8.1 Market Estimates & Forecast, by Services, 2020β2027
8.3.8.2 Market Estimates & Forecast, by Type, 2020β2027
8.3.8.3 Market Estimates & Forecast, by Application, 2020β2027
8.4 Asia-Pacific
8.4.1 Market Estimates & Forecast, by Services, 2020β2027
8.4.2 Market Estimates & Forecast, by Type, 2020β2027
8.4.3 Market Estimates & Forecast, by Application, 2020β2027
8.4.4 Market Estimates & Forecast, by Country, 2020β2027
8.4.5 China
8.4.5.1 Market Estimates & Forecast, by Services, 2020β2027
8.4.5.2 Market Estimates & Forecast, by Type, 2020β2027
8.4.5.3 Market Estimates & Forecast, by Application, 2020β2027
8.4.6 Japan
8.4.6.1 Market Estimates & Forecast, by Services, 2020β2027
8.4.6.2 Market Estimates & Forecast, by Type, 2020β2027
8.4.6.3 Market Estimates & Forecast, by Application, 2020β2027
8.4.7 Australia
8.4.7.1 Market Estimates & Forecast, by Services, 2020β2027
8.4.7.2 Market Estimates & Forecast, by Type, 2020β2027
8.4.7.3 Market Estimates & Forecast, by Application, 2020β2027
8.4.8 India
8.4.8.1 Market Estimates & Forecast, by Services, 2020β2027
8.4.8.2 Market Estimates & Forecast, by Type, 2020β2027
8.4.8.3 Market Estimates & Forecast, by Application, 2020β2027
8.4.9 Rest of Asia-Pacific
8.4.9.1 Market Estimates & Forecast, by Services, 2020β2027
8.4.9.2 Market Estimates & Forecast, by Type, 2020β2027
8.4.9.3 Market Estimates & Forecast, by Application, 2020β2027
8.5 Middle East & Africa
8.5.1 Market Estimates & Forecast, by Services, 2020β2027
8.5.2 Market Estimates & Forecast, by Type, 2020β2027
8.5.3 Market Estimates & Forecast, by Application, 2020β2027
8.5.4 Market Estimates & Forecast, by Country, 2020β2027
8.5.5 Saudi Arabia
8.5.5.1 Market Estimates & Forecast, by Services, 2020β2027
8.5.5.2 Market Estimates & Forecast, by Type, 2020β2027
8.5.5.3 Market Estimates & Forecast, by Application, 2020β2027
8.5.6 UAE
8.5.6.1 Market Estimates & Forecast, by Services, 2020β2027
8.5.6.2 Market Estimates & Forecast, by Type, 2020β2027
8.5.6.3 Market Estimates & Forecast, by Application, 2020β2027
8.5.7 South Africa
8.5.7.1 Market Estimates & Forecast, by Services, 2020β2027
8.5.7.2 Market Estimates & Forecast, by Type, 2020β2027
8.5.7.3 Market Estimates & Forecast, by Application, 2020β2027
8.5.8 Rest of Middle East & Africa
8.5.8.1 Market Estimates & Forecast, by Services, 2020β2027
8.5.8.2 Market Estimates & Forecast, by Type, 2020β2027
8.5.8.3 Market Estimates & Forecast, by Application, 2020β2027
8.6 South America
8.6.1 Market Estimates & Forecast, by Services, 2020β2027
8.6.2 Market Estimates & Forecast, by Type, 2020β2027
8.6.3 Market Estimates & Forecast, by Application, 2020β2027
8.6.4 Market Estimates & Forecast, by Country, 2020β2027
8.6.5 Argentina
8.6.5.1 Market Estimates & Forecast, by Services, 2020β2027
8.6.5.2 Market Estimates & Forecast, by Type, 2020β2027
8.6.5.3 Market Estimates & Forecast, by Application, 2020β2027
8.6.6 Brazil
8.6.6.1 Market Estimates & Forecast, by Services, 2020β2027
8.6.6.2 Market Estimates & Forecast, by Type, 2020β2027
8.6.6.3 Market Estimates & Forecast, by Application, 2020β2027
8.6.7 Rest of South America
8.6.7.1 Market Estimates & Forecast, by Services, 2020β2027
8.6.7.2 Market Estimates & Forecast, by Type, 2020β2027
8.6.7.3 Market Estimates & Forecast, by Application, 2020β2027
9 Competitive Landscape
9.1 Competitive Scenario
9.2 Competitive Benchmarking of the Global Drones for Oil & Gas Market
9.3 Major Growth Key Strategies in the Global Drones for Oil & Gas Market
9.4 Market Share Analysis: Global Drones for Oil & Gas Market
9.5 XXXX: The Leading Player in Terms of Number of Developments in Global Drones for Oil & Gas Market
9.6 Product Development in Global Drones for Oil & Gas Market
9.7 Mergers and Acquisitions in Global Drones for Oil & Gas Market
9.8 Contracts and Agreements in Global Drones for Oil & Gas Market
9.9 Expansions and Investments in Global Drones for Oil & Gas Market
10 Company Profile
10.1 Cyberhawk Innovations Limited (Scotland)
10.1.1 Company Overview
10.1.2 Products/Services Offered
10.1.3 Financial Overview
10.1.4 Key Developments
10.1.5 Key Strategies
10.1.6 SWOT Analysis
10.2 PrecisionHawk (US)
10.2.1 Company Overview
10.2.2 Products/Services Offered
10.2.3 Financial Overview
10.2.4 Key Developments
10.2.5 Key Strategies
10.2.6 SWOT Analysis
10.3 Delair (Denmark)
10.3.1 Company Overview
10.3.2 Products/Services Offered
10.3.3 Financial Overview
10.3.4 Key Developments
10.3.5 Key Strategies
10.3.6 SWOT Analysis
10.4 SkyScape Industries (US)
10.4.1 Company Overview
10.4.2 Products/Services Offered
10.4.3 Financial Overview
10.4.4 Key Developments
10.4.5 Key Strategies
10.4.6 SWOT Analysis
10.5 Airobotics (US)
10.5.1 Company Overview
10.5.2 Products/Services Offered
10.5.3 Financial Overview
10.5.4 Key Developments
10.5.5 Key Strategies
10.5.6 SWOT Analysis
10.5.7 SWOT Analysis
10.6 Airborne Drones (South Africa)
10.6.1 Company Overview
10.6.2 Products/Services Offered
10.6.3 Financial Overview
10.6.4 Key Developments
10.6.5 Key Strategies
10.6.6 SWOT Analysis
10.7 Sky Futures (UK)
10.7.1 Company Overview
10.7.2 Products/Services Offered
10.7.3 Financial Overview
10.7.4 Key Developments
10.7.5 Key Strategies
10.7.6 SWOT Analysis
10.8 Terra Drone (Japan)
10.8.1 Company Overview
10.8.2 Products/Services Offered
10.8.3 Financial Overview
10.8.4 Key Developments
10.8.5 Key Strategies
10.8.6 SWOT Analysis
10.9 Intel Corporation (US)
10.9.1 Company Overview
10.9.2 Products/Services Offered
10.9.3 Financial Overview
10.9.4 Key Developments
10.9.5 Key Strategies
10.9.6 SWOT Analysis
10.10 AeroVironment, Inc (US)
10.10.1 Company Overview
10.10.2 Products/Services Offered
10.10.3 Financial Overview
10.10.4 Key Developments
10.10.5 Key Strategies
10.10.6 SWOT Analysis
10.11 Aerodyne Group (Malaysia)
10.11.1 Company Overview
10.11.2 Products/Services Offered
10.11.3 Financial Overview
10.11.4 Key Developments
10.11.5 Key Strategies
10.11.6 SWOT Analysis
10.12 Insitu Pacific Pty Ltd (Australia)
10.12.1 Company Overview
10.12.2 Products/Services Offered
10.12.3 Financial Overview
10.12.4 Key Developments
10.12.5 Key Strategies
10.12.6 SWOT Analysis
10.13 Aerialtronics DV B.V. (the Netherlands)
10.13.1 Company Overview
10.13.2 Products/Services Offered
10.13.3 Financial Overview
10.13.4 Key Developments
10.13.5 Key Strategies
10.13.6 SWOT Analysis
10.14 Flyability (Switzerland)
10.14.1 Company Overview
10.14.2 Products/Services Offered
10.14.3 Financial Overview
10.14.4 Key Developments
10.14.5 Key Strategies
10.14.6 SWOT Analysis
10.15 ideaForge (India)
10.15.1 Company Overview
10.15.2 Products/Services Offered
10.15.3 Financial Overview
10.15.4 Key Developments
10.15.5 Key Strategies
10.15.6 SWOT Analysis
β
List of Tables
Table 1 Global Drones for Oil & Gas Market, by Region, 2020β2027 (USD Million)
Table 2 North America Drones for Oil & Gas Market, by Country, 2020β2027 (USD Million)
Table 3 Europe Drones for Oil & Gas Market, by Country, 2020β2027 (USD Million)
Table 4 Asia-Pacific Drones for Oil & Gas Market, by Country, 2020β2027 (USD Million)
Table 5 Middle East & Africa Drones for Oil & Gas Market, by Country, 2020β2027 (USD Million)
Table 6 South America Drones for Oil & Gas Market, by Country, 2020β2027 (USD Million)
Table 7 Global Drones for Oil & Gas Market, by Type, 2020β2027 (USD Million)
Table 8 North America Drones for Oil & Gas Market, by Type, 2020β2027 (USD Million)
Table 9 Europe Drones for Oil & Gas Market, by Type, 2020β2027 (USD Million)
Table 10 Asia-Pacific Drones for Oil & Gas Market, by Type, 2020β2027 (USD Million)
Table 11 Middle East & Africa Drones for Oil & Gas Market, by Type, 2020β2027 (USD Million)
Table 12 South America Drones for Oil & Gas Market, by Type, 2020β2027 (USD Million)
Table 13 Global Drones for Oil & Gas Market, by Application, 2020β2027 (USD Million)
Table 14 North America Drones for Oil & Gas Market, by Application, 2020β2027 (USD Million)
Table 15 Europe Drones for Oil & Gas Market, by Application, 2020β2027 (USD Million)
Table 16 Asia-Pacific Drones for Oil & Gas Market, by Application, 2020β2027 (USD Million)
Table 17 Middle East & Africa Drones for Oil & Gas Market, by Application, 2020β2027 (USD Million)
Table 18 South America Drones for Oil & Gas Market, by Application, 2020β2027 (USD Million)
Table 19 US Drones for Oil & Gas Market, by Type, 2020β2027 (USD Million)
Table 20 US Drones for Oil & Gas Market, by Application, 2020β2027 (USD Million)
Table 21 Canada Drones for Oil & Gas Market, by Type, 2020β2027 (USD Million)
Table 22 Canada Drones for Oil & Gas Market, by Application, 2020β2027 (USD Million)
Table 23 Mexico Drones for Oil & Gas Market, by Type, 2020β2027 (USD Million)
Table 24 Mexico Drones for Oil & Gas Market, by Application, 2020β2027 (USD Million)
Table 25 Europe Drones for Oil & Gas Market, by Country, 2020β2027 (USD Million)
Table 26 Europe Drones for Oil & Gas Market, by Type, 2020β2027 (USD Million)
Table 27 Europe Drones for Oil & Gas Market, by Application, 2020β2027 (USD Million)
Table 28 Norway Drones for Oil & Gas Market, by Type, 2020β2027 (USD Million)
Table 29 Norway Drones for Oil & Gas Market, by Application, 2020β2027 (USD Million)
Table 30 UK Drones for Oil & Gas Market, by Type, 2020β2027 (USD Million)
Table 31 UK Drones for Oil & Gas Market, by Application, 2020β2027 (USD Million)
Table 32 Denmark Drones for Oil & Gas Market, by Type, 2020β2027 (USD Million)
Table 33 Denmark Drones for Oil & Gas Market, by Application, 2020β2027 (USD Million)
Table 34 Rest of Europe Drones for Oil & Gas Market, by Type, 2020β2027 (USD Million)
Table 35 Rest of Europe Drones for Oil & Gas Market, by Application, 2020β2027 (USD Million)
Table 36 Asia-Pacific Drones for Oil & Gas Market, by Country, 2020β2027 (USD Million)
Table 37 Asia-Pacific Drones for Oil & Gas Market, by Type, 2020β2027 (USD Million)
Table 38 Asia-Pacific Drones for Oil & Gas Market, by Application, 2020β2027 (USD Million)
Table 39 China Drones for Oil & Gas Market, by Type, 2020β2027 (USD Million)
Table 40 China Drones for Oil & Gas Market, by Application, 2020β2027 (USD Million)
Table 41 Japan Drones for Oil & Gas Market, by Type, 2020β2027 (USD Million)
Table 42 Japan Drones for Oil & Gas Market, by Application, 2020β2027 (USD Million)
Table 43 Australia Drones for Oil & Gas Market, by Type, 2020β2027 (USD Million)
Table 44 Australia Drones for Oil & Gas Market, by Application, 2020β2027 (USD Million)
Table 45 India Drones for Oil & Gas Market, by Type, 2020β2027 (USD Million)
Table 46 India Drones for Oil & Gas Market, by Application, 2020β2027 (USD Million)
Table 47 Rest of Asia-Pacific Drones for Oil & Gas Market, by Type, 2020β2027 (USD Million)
Table 48 Rest of Asia-Pacific Drones for Oil & Gas Market, by Application, 2020β2027 (USD Million)
Table 49 Middle East & Africa Drones for Oil & Gas Market, by Country, 2020β2027 (USD Million)
Table 50 Middle East & Africa Drones for Oil & Gas Market, by Type, 2020β2027 (USD Million)
Table 51 Middle East & Africa Drones for Oil & Gas Market, by Application, 2020β2027 (USD Million)
Table 52 Saudi Arabia Drones for Oil & Gas Market, by Type, 2020β2027 (USD Million)
Table 53 Saudi Arabia Drones for Oil & Gas Market, by Application, 2020β2027 (USD Million)
Table 54 UAE Drones for Oil & Gas Market, by Type, 2020β2027 (USD Million)
Table 55 UAE Drones for Oil & Gas Market, by Application, 2020β2027 (USD Million)
Table 56 South Africa Drones for Oil & Gas Market, by Type, 2020β2027 (USD Million)
Table 57 South Africa Drones for Oil & Gas Market, by Application, 2020β2027 (USD Million)
Table 58 Rest of Middle East & Africa Drones for Oil & Gas Market, by Type, 2020β2027 (USD Million)
Table 59 Rest of Middle East & Africa Drones for Oil & Gas Market, by Application, 2020β2027 (USD Million)
Table 60 South America Drones for Oil & Gas Market, by Type, 2020β2027 (USD Million)
Table 61 South America Drones for Oil & Gas Market, by Application, 2020β2027 (USD Million)
Table 62 Argentina Drones for Oil & Gas Market, by Type, 2020β2027 (USD Million)
Table 63 Argentina Drones for Oil & Gas Market, by Application, 2020β2027 (USD Million)
Table 64 Brazil Drones for Oil & Gas Market, by Type, 2020β2027 (USD Million)
Table 65 Brazil Drones for Oil & Gas Market, by Application, 2020β2027 (USD Million)
Table 66 Rest of South America Drones for Oil & Gas Market, by Type, 2020β2027 (USD Million)
Table 67 Rest of South America Drones for Oil & Gas Market, by Application, 2020β2027 (USD Million)
List of Figures
Figure 1 Research Process of MRFR
Figure 2 Top-Down and Bottom-Up Approach
Figure 3 Market Dynamics
Figure 4 Impact Analysis: Market Drivers
Figure 5 Impact Analysis: Market Restraints
Figure 6 Porterβs Five Forces Analysis
Figure 7 Value Chain Analysis
Figure 8 Global Drones for Oil & Gas Market Share, by Type, 2020 (%)
Figure 9 Global Drones for Oil & Gas Market, by Type, 2020β2027 (USD Million)
Figure 10 Global Drones for Oil & Gas Market Share, by Application, 2020 (%)
Figure 11 Global Drones for Oil & Gas Market, by Application, 2020β2027 (USD Million)
Figure 12 North America Drones for Oil & Gas Market Share (%), 2020
Figure 13 North America Drones for Oil & Gas Market, by Country, 2020β2027 (USD Million)
Figure 14 Europe Drones for Oil & Gas Market Share (%), 2020
Figure 15 Europe Drones for Oil & Gas Market, by Country, 2020β2027 (USD Million)
Figure 16 Asia-Pacific Drones for Oil & Gas Market Share (%), 2020
Figure 17 Asia-Pacific Drones for Oil & Gas Market, by Country, 2020β2027 (USD Million)
Figure 18 Middle East & Africa Drones for Oil & Gas Market Share (%), 2020
Figure 19 Middle East & Africa Drones for Oil & Gas Market, by Region, 2020β2027 (USD Million)
Figure 20 South America Drones for Oil & Gas Market Share (%), 2020
Figure 21 South America Drones for Oil & Gas Market, by Country, 2020β2027 (USD Million)
$23.87 Billion
38.71%
North America
2021-2027
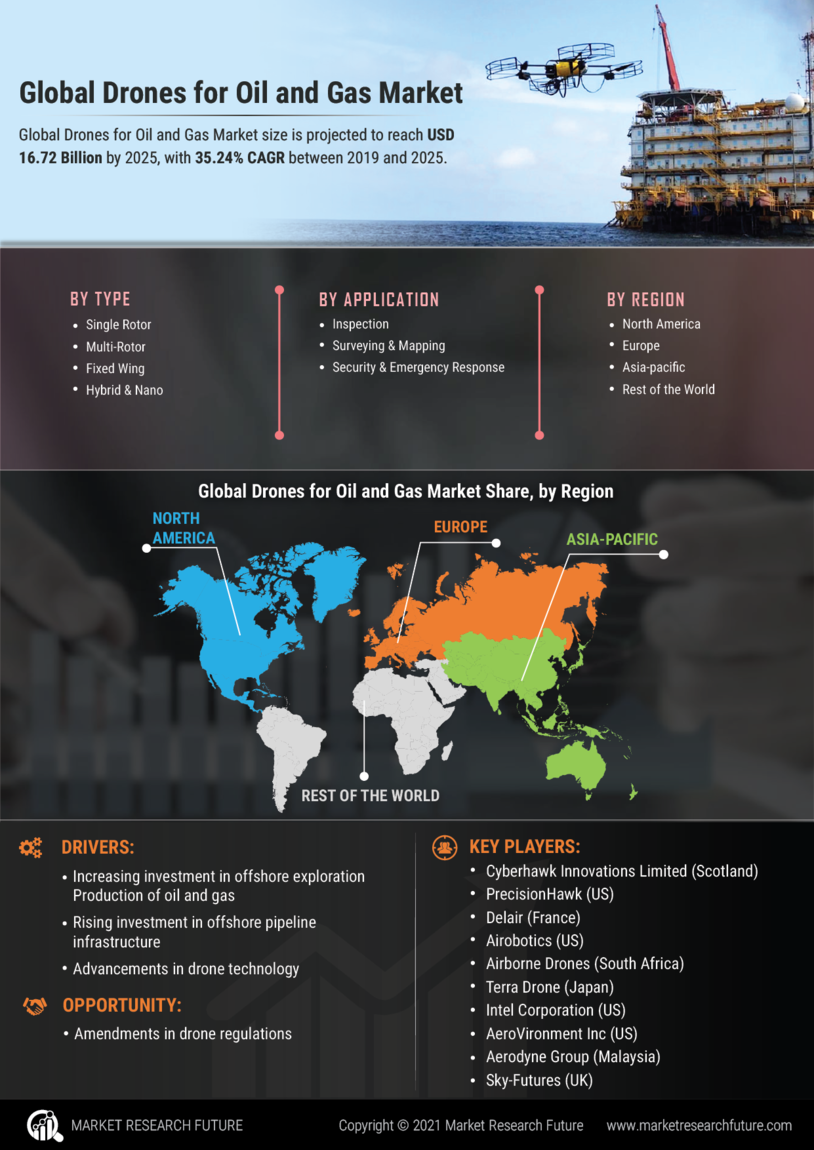
The Drones for Oil and Gas Market is estimated to achieve USD 23.87 billion by the end of the year 2027. Further, the global market has predicted to register a CAGR of 38.71% for the forecast period of 2021 to 2027.
The oil and gas industries prefer to use drones for oil and gas to capture the minute details. These industries prefer it because of its infra-red cameras of very high resolution that give an accurate result. The detailed images of oil and gas activities have been captured in the camera by the oil and gas drones. Moreover, this camera can also track oil and gas activities like gas emissions, drilling, exploration & production, flare stack, etc.
Along with that, the infra-red cameras has the thermal imaging capabilities as well as the LIDAR (Light Detection and Ranging) capabilities that are helpful to inspect or capture the infrastructure of the oil and gas like offshore platforms, pipelines, tailing ponds, oil spills & damage, rigs, etc. Through the help of drones, these captured images are sent to the analysis process and, based on this analysis report, and preventative actions are taken wisely. Further, the drones for oil and gas market is segregated based on application and type. In this, the automated drones (UAV) offer high-quality aerial data for all maintenance and inspection requirements. Here, gas-operated drones are one of the drones that operate completely through engines.
According to the drones for oil and gas market trends report, the market is growing with the increasing investment in global products. The rising demand of the intended audiences in specific types increases the drones for oil and gas market growth. These intended key players are Environmental research institutes, Institutional investors, Manufacturers' associations, Government and research organizations, Investment banks, Suppliers and manufacturers of drones for oil and gas, State and national regulatory authorities, Service providers of drones for oil and gas, Energy & environment associations, and End-user industries like solar power, power industry, and wind power. Further, the drones for oil and gas market has been estimated to generate the higher drones for oil and gas market size for the research period.
COVID-19 Impact Analysis
The global drones for oil and gas industry has been affected due to the COVID-19 pandemic. The ongoing pandemic has disrupted the sales and productivity of the global market. As a result, the global market has experienced a huge loss for the first half of 2020. Even many investors have taken a step back in this period.
Hence, the key players have adopted various unique ideas and techniques to enhance the growth of the global market. Further, it has been predicted that the market will generate higher drones for oil and gas market size for the research period.
Market Overview
The major growth driving factors for the Drones for Oil and Gas Market Growth is the increasing production of oil and gas, advancements in drone technology, growing investment in offshore pipeline infrastructure, and growing investment in offshore exploration.
According to the World Pipelines Report (2018), the European government has planned to invest nearly USD 8.75 billion in the Nord Stream gas pipeline construction for exporting gas under the Baltic Sea from Russia to Germany. Along with that, the Egyptian government had also mentioned investing nearly USD 800 million to USD 1000 million in the pipeline's construction for exporting natural gas from Cyprus to Egypt under the Mediterranean Sea. Further, the drone regulations amendments have been predicted to bring more opportunity and drones for oil and gas market growth.
The global drones for oil and gas market has more growth opportunities for key players due to the increasing investment in drones for oil and gas.
Moreover, the amendments in drone regulations are bringing lucrative opportunities for the manufacturers and the market players, which can boost the drones for oil and gas industry in the upcoming years.
The global drones for oil and gas market might experience market restraints due to the vulnerability to cyber threats.
Along with that, the rising cost of the product might hamper the growth of the global market. Hence, the global key players are working on these issues to handle the matter very carefully.
The global drones for oil and gas industry has many major challenges that can affect the growth of the global market. One of the major challenges for the global market is the increasing cyber crimes or cyber threats across the world.
Another major challenge for the global market is the ongoing pandemic that has affected the growth of the global market.
Cumulative growth Analysis
According to the drones for oil and gas industry report, the global market has shown a significant growth performance in the current year. Further, it has aimed to generate higher drones for oil and gas market size for the forecast period.
Moreover, the regional growth of North America has shown cumulative growth in the present context. Hence, there are more growth opportunities for the key players and manufacturers.
Market Segment Overview
On the basis of type segment, the global drones for oil and gas market has been classified into Hybrid and Nano, fixed-wing, multi-rotor, and single rotor.
Among these, the multi-rotor segment is predicted to generate the highest CAGR for the forecast period due to its being readily available in the market and comparatively cheaper.
On the basis of application segment, the global drones for oil and gas market has been classified into Inspection, security & emergency response, and surveying and mapping.
Out of these, the surveying and mapping segment is predicted to generate the largest drones for oil and gas market share for the forecast period. This segment enhances the growth of the global market due to the analysis of reservoirs and the developmental growth in the exploration of unconventional and conventional reserves.
Regional Analysis
Based on geographical segment, the global drones for oil and gas market has been segmented into Europe, Asia Pacific, South America, North America, and the rest.
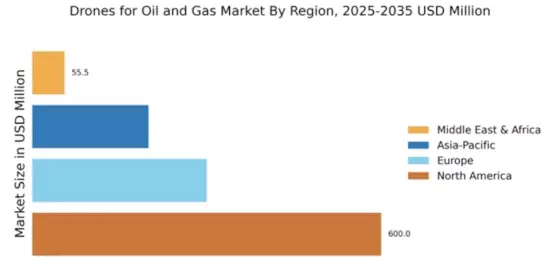
Out of these, the North American region is holding the dominant position in generating the largest drones for oil and gas market share for the research period due to increasing production activities in oil and gas in this region and rising investments in exploration. Moreover, this region is enhancing the regional growth of the drones for oil and gas market due to the growing usage of drones in the oil and gas industry and the growing offshore drilling activities in the North American region.
Competitive landscape Analysis
In the global drones for oil and gas market, the key players are contributing effectively. These key players are:
Among these key players, the companies like PrecisionHawk (U.S.), Cyberhawk Innovations Limited (Scotland), and Delair collectively focus on agreements and contracts with gas and oil companies to expand the solutions of drones for oil and gas. Hence, the demand for the Drones for Oil and Gas Market is growing on a large scale.
Recent Developments
Report Overview
The Drones for Oil and Gas Market Trends report has highlighted the global market's historical and current growth and development through in-depth analysis. This report is a combination of both research methods such as primary and secondary. The report has involved various important dealers, key player's interviews, and secondary data collection. Therefore, the global market report has covered the market dynamics, market segmentation, market overviews, and regional analysis with the analysis of the performance of the market.
Moreover, the drones for oil and gas market trends report has focused on the market size, market growth, and market share to get a deep insight into the global market. Along with that, it has highlighted the current development and competition of the global market.
Segmental Table:
By Type:
By Application:
Report Attribute/Metric | Details |
---|---|
Market Size |
|
CAGR | 38.71% CAGR (2022-2030) |
Base Year | 2021 |
Forecast Period | 2022Β toΒ 2030 |
Historical Data | 2019Β &Β 2020 |
Forecast Units | Value (USD Million) |
Report Coverage | Revenue Forecast, Competitive Landscape, Growth Factors, and Trends |
Segments Covered | Type, Application |
Geographies Covered | North America, Europe, Asia-Pacific, and Rest of the World (RoW) |
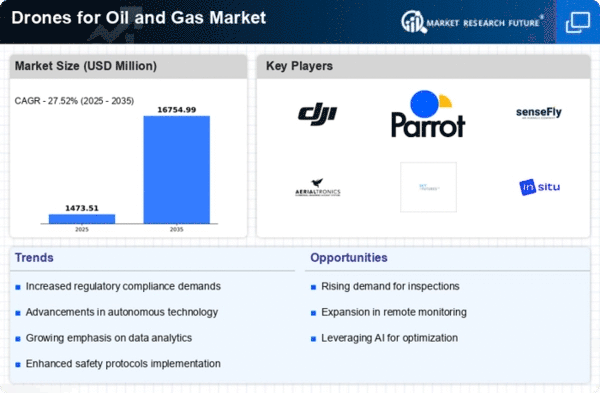
Key Vendors | Cyberhawk Innovations Limited (Scotland), PrecisionHawk (US), Delair (France), Airobotics (US), Airborne Drones (South Africa), Terra Drone (Japan), Intel Corporation (US), AeroVironment, Inc (US), Aerodyne Group (Malaysia), Sky-Futures (UK), Flyability (Switzerland), Insitu Pacific Pty Ltd (Australia), Aerialtronics DV B.V. (the Netherlands), and ideaForge (India) |
Key Market Opportunities | Amendments in drone regulations |
Key Market Drivers |
|
Frequently Asked Questions (FAQ) :
The global Drones for Oil and Gas Market have aimed to meet a CAGR of 38.71% for the forecast period.
The global Drones for Oil and Gas Market have been segmented into two such as types and applications.
The North American region generates the higher Drones for Oil and Gas Market Share for the forecast period.