×
  • Cat-intel
  • MedIntelliX
  • Resources
  • About Us
  • Hero Background
    English
    Chinese
    French
    Japanese
    Korean
    German
    Spanish

    Diphenylamine Market Size

    ID: MRFR/CnM/3131-CR
    449 Pages
    Anshula Mandaokar
    May 2023

    Diphenylamine (DPA) Market Research Report Information By Application (Chemical Intermediates, Antioxidants, Fungicides And Others), By End-Use Industry (Personal Care, Automotive And Agriculture, Cosmetics, Rubber And Plastics Industry) And By Region (North America, Europe, Asia-Pacific, And Rest Of The World) –Market Forecast Till 2035

    Share:
    Download PDF ×

    We do not share your information with anyone. However, we may send you emails based on your report interest from time to time. You may contact us at any time to opt-out.

    Diphenylamine Market Infographic
    Purchase Options

    Diphenylamine Size

    Diphenylamine Market Growth Projections and Opportunities

    The diphenylamine market for N, N-diphenylamine is affected by various factors that combine to shape the dynamics of the market. The most important factor driving the use of N, N-diphenylamine in many sectors is its application as an antioxidant in plastics, lubricants, and rubber. Diphenylamine is known for its heat and oxidation resistance properties, which increases its demand for products with long life spans and the ability to withstand wear. In 2023, the Diphenylamine (DPA) Market Size was evaluated at USD 0.38 billion. This signifies a projected value of USD 0.54 billion by 2032 as it continues to Register a CAGR of 4% over the forecast period till then. The regulatory framework and safety standards play a critical role in governing the Diphenylamine market. Economic conditions across nations have an enormous influence on the diphenylamine industry worldwide. Economic changes can influence manufacturing costs, currency fluctuations, and geopolitical factors, leading to price strategies that are instrumental in determining global marketplace stability based on all these indicators. Development and innovations make up some of the drivers behind this industry today. Research studies are ongoing with regard to bettering existing DPA formulations so as to improve their efficiency, remain stable for longer periods, or lessen the environmental effects arising from their application. There are new antioxidants currently being developed, such as those that are environmentally friendly, hence addressing sustainability concerns among end user industries. Consumer tastes and fashions greatly influence DPA's market dynamics across geography lines because certain preferences change over time while others do not. The growing demand for green building materials affects how DPA will evolve along this line. Where you live plays a significant role in defining your place in this sector as well. For example, geographical differences might exist between countries or regions within them, which may cause variations even when regulations are already harmonized within Europe. The competition within the industry shapes the market dynamics of N, N-diphenylamine. This forces companies to consider factors such as strategic alliances and product differentiation in order to have an edge over their competitors. Corporate reputations can be established by brand building, quality assurance, and the development of new DPA compounds that are specifically targeted at certain industries.

    Diphenylamine Market Size Graph
    Author
    Anshula Mandaokar
    Team Lead - Research

    Anshula Mandaokar holds an academic degree in Chemical Engineering and has been contributing to the field for more than 5 years. She has expertise in Market Research and Business Consulting and serves as a Team Lead for a reputed Market Research firm under the Chemicals and Materials domain spectrum. She has worked on multiple projects, generating explicit results in a quick turnaround time. Her understanding of data interpretation justifies her role as a leader.

    Leave a Comment

    FAQs

    How much is the diphenylamine (DPA) market?

    Diphenylamine Market crossed a valuation of USD 0.41 Billion in 2024

    What is the growth rate of the diphenylamine (DPA) market?

    Diphenylamine Market is projected to grow at a CAGR of 3.63% during the forecast period, 2025-2035

    Which region held the largest market share in the diphenylamine (DPA) market?

    North America had the largest share of the market

    Who are the key players in the diphenylamine (DPA) market?

    The key players in the market are Eastman Chemical Company (US), Duslo a.s. (Slovakia), SONGWON (South Korea), Nantong Xinbang Chemical Technology Chemical Co, Ltd (China)

    Which end-user industry led the diphenylamine (DPA) market?

    Diphenylamine Market was valued at USD 0.41 Billion in 2024

    Which application had the largest market share in the diphenylamine (DPA) market?

    The Antioxidants had the largest share of the market

    Market Summary

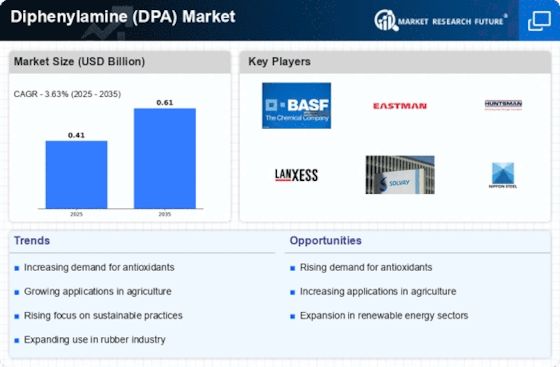
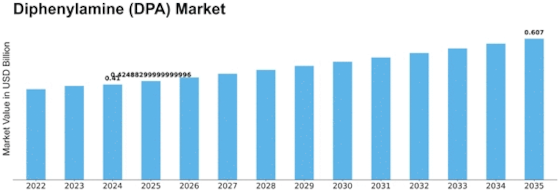
    The Global Diphenylamine (DPA) Market is projected to grow from 0.41 USD Billion in 2024 to 0.61 USD Billion by 2035.

    Key Market Trends & Highlights

    Diphenylamine (DPA) Key Trends and Highlights

    • The market is expected to witness a compound annual growth rate (CAGR) of 3.54% from 2025 to 2035.
    • By 2035, the market valuation is anticipated to reach 0.6 USD Billion, indicating steady growth.
    • in 2024, the market is valued at 0.41 USD Billion, reflecting a solid foundation for future expansion.
    • Growing adoption of diphenylamine in various applications due to its antioxidant properties is a major market driver.

    Market Size & Forecast

    2024 Market Size 0.41 (USD Billion)
    2035 Market Size 0.61 (USD Billion)
    CAGR (2025-2035) 3.63%
    Largest Regional Market Share in 2024 latin_america)

    Major Players

    Eastman Chemical Company (US), Duslo a.s. (Slovakia), SONGWON (South Korea), Nantong Xinbang Chemical Technology Chemical Co, Ltd (China), BASF SE (Germany), Huntsman International LLC (US), LANXESS (Germany), The Lubrizol Corporation (US), Merck KGaA (Germany), Seiko Chemical Co. Ltd (Tokyo), Jiangsu Feiya Chemical Industry Co. Ltd (Austria)

    Market Trends

    The increase in the automotive sector boosts market growth

    The automotive industry is one of the primary end-use industries driving the market CAGR for diphenylamine. Rubber is very significant in the automotive industry, which comprises passenger cars, commercial vehicles, and heavy commercial vehicles. Rubber products are widely employed in the automobile industry because of its durability, strength, and heat resistance. Thus, as the automobile industry has grown, so has the demand for rubber, which has fueled the expansion of diphenylamine rubber antioxidant.

    Furthermore, according to the International Organization of Motor Vehicle Manufacturers, vehicle production in the North Americas and Asia-Pacific region increased by 6% and 3%, respectively, in 2021 compared to the previous year (2020).

    According to the German Trade and Invest (GTAI), German automobile manufacturers produced over 16 million vehicles in 2019. Additionally, German passenger car and light commercial vehicle OEM generated foreign market revenue of nearly EUR 282.4 billion (US$ 308 billion) in 2019, a 2% increase over the previous year.

    In addition, concerns about the state of the environment have spurred demand for ecologically friendly items such as eco-friendly tires. Increasing initiatives by numerous manufacturers to build eco-friendly tires have increased demand for rubber, which has influenced the expansion of diphenylamine in recent years. As a result, such initiatives will boost demand for rubber-based products and propel the diphenylamine rubber antioxidant market in the future years.

    According to India's National Investment Promotion and Facilitation Agency, electric car demand is likely to expand even further in the near future. Automobile output is estimated to reach US$ 300 billion by 2032.

    Furthermore, rising demand for rubber and polymer goods in the automotive industry is expected to provide opportunities for market participants throughout the forecast period. Nonetheless, the health and environmental concerns connected with DPA are expected to be a major impediment to diphenylamine (DPA)market revenue during the forecast period.

    Diphenylamine Market Market Drivers

    Growth in Chemical Manufacturing

    The Global Diphenylamine (DPA) Market Industry is significantly influenced by the expansion of the chemical manufacturing sector. DPA serves as a vital intermediate in the synthesis of various chemicals, including antioxidants and dyes. As industrial processes become more complex, the demand for high-quality intermediates like DPA is likely to increase. The anticipated growth in this sector suggests a robust market trajectory, with projections indicating a market value of 0.6 USD Billion by 2035. This growth is indicative of the broader trends in chemical production, where DPA plays a crucial role in enhancing product performance and stability.

    Increasing Demand in Agriculture

    The Global Diphenylamine (DPA) Market Industry experiences a notable surge in demand from the agricultural sector, primarily due to its application as a pesticide and fungicide. DPA is utilized to protect crops from various diseases, thereby enhancing yield and quality. As global agricultural practices evolve, the need for effective crop protection agents becomes paramount. In 2024, the market is projected to reach 0.41 USD Billion, reflecting the growing reliance on chemical solutions in agriculture. This trend is expected to continue, with the market potentially expanding further as farmers seek to optimize production efficiency and sustainability.

    Rising Awareness of Product Safety

    Consumer awareness regarding product safety and environmental impact is driving changes in the Global Diphenylamine (DPA) Market Industry. As regulations tighten around chemical usage, manufacturers are increasingly seeking safer alternatives that do not compromise efficacy. DPA, known for its effectiveness in various applications, is being scrutinized for its safety profile. This shift towards safer chemical practices may lead to a reevaluation of DPA's role in different industries. The market's adaptability to these changing perceptions could influence its growth trajectory, as stakeholders prioritize compliance with safety standards while maintaining product performance.

    Technological Advancements in Production

    Technological advancements in the production of Diphenylamine (DPA) are poised to enhance efficiency and reduce costs within the Global Diphenylamine (DPA) Market Industry. Innovations in synthesis methods and purification techniques may lead to higher yields and lower environmental impact. As manufacturers adopt these technologies, the potential for increased production capacity becomes evident. This could facilitate a more competitive market landscape, allowing for greater accessibility of DPA across various applications. The anticipated compound annual growth rate (CAGR) of 3.54% from 2025 to 2035 underscores the potential for growth driven by these advancements.

    Regulatory Support for Chemical Innovations

    The Global Diphenylamine (DPA) Market Industry benefits from regulatory frameworks that support chemical innovations. Governments worldwide are increasingly recognizing the importance of chemical intermediates in various sectors, including agriculture and manufacturing. Policies that encourage research and development in chemical applications can lead to enhanced product offerings and market expansion. As regulatory bodies promote sustainable practices, the demand for DPA may rise, particularly in applications where its properties can be leveraged for improved performance. This supportive environment could foster a more robust market, aligning with global sustainability goals.

    Market Segment Insights

    Diphenylamine (DPA) Application Insights

    The diphenylamine (DPA) market segmentation, based on application includes chemical intermediates, antioxidants, fungicides and others. Antioxidants dominated the market, accounting for 59 % of the total. A similar pattern is anticipated for the projected year of 2032. Antioxidants are a key component in the manufacturing of functional fluids such as lubricants, explosives, and gun powders. The antioxidant segment is anticipated to record a CAGR of over 4.5% during the forecast period.

    Diphenylamine (DPA) End-Use Industry Insights

    The diphenylamine (DPA) market segmentation, based on End-Use Industry, includes personal care, automotive and agriculture, cosmetics, rubber and plastics industry. Rubber dominated the diphenylamine market and is predicted to maintain its dominance between 2022 and 2032. Diphenylamine is the most often utilized antioxidant in Chloroprene Rubber (CR)-based rubber compounds since it has no effect on bin storage qualities. The increasing use of chloroprene rubber pads in reinforced concrete structures in the construction sector is estimated to fuel market growth over the forecast period.

    Also propelling industrial growth is an increase in demand for chloroprene rubber in the electrical and electronic industries due to its beneficial qualities such as low weight, dielectric capacity, high temperature resistance, and superior impact quality.

    Figure1: Diphenylamine (DPA) Market, by End-User Industry, 2022&2032 (USD billion)Source: Secondary Research, Primary Research, Market Research Future Database and Analyst Review

    Get more detailed insights about Diphenylamine (DPA) Market Research Report - Global Forecast till 2035

    Regional Insights

    By Region, the study provides the market insights into North America, Europe, Asia-Pacific and Rest of the World. In terms of value, the North America region dominated the diphenylamine rubber antioxidant market in 2022, accounting for 45% of the total. The market in the region is expanding due to increased investment in a variety of end-use sectors. Furthermore, enterprises in this region are presented with profitable prospects to enhance their production capacity, hence stimulating market growth.

    Further, the major countries studied in the market report are The U.S., Canada, German, France, the UK, Italy, Spain, China, Japan, India, Australia, South Korea, and Brazil.

    Figure2: DIPHENYLAMINE (DPA) MARKET SHARE BY REGION 2022 (%) 

    DIPHENYLAMINE (DPA) MARKET SHARE BY REGION

    Source: Secondary Research, Primary Research, Market Research Future Database and Analyst Review

    Europe’s diphenylamine (DPA) market accounts for the second-largest market share due to increase their production capacity and, in turn, to stimulate market growth. Further, the German diphenylamine (DPA) market held the largest market share, and the UK diphenylamine (DPA) market was the fastest-growing market in the European region

    The Asia-Pacific Diphenylamine (DPA) Market is expected to grow at the fastest CAGR from 2023 to 2032. This is Due to significant industrial growth associated with the expansion of automotive production units and assembly lines in the region's rising economies. Moreover, China’s diphenylamine (DPA) market held the largest market share, and the Indian diphenylamine (DPA) market was the fastest-growing market in the Asia-Pacific region.

    Key Players and Competitive Insights

    Leading market players are investing heavily in R&D in order to expand their product lines, which will help the diphenylamine (DPA) market, grow even more. Market participants are also undertaking a variety of strategic activities to expand their footprint, with important market developments including new product launches, contractual agreements, mergers and acquisitions, higher investments, and collaboration with other organizations. To expand and survive in a more competitive and rising market climate, diphenylamine (DPA)industry must offer cost-effective items.

    Manufacturing locally to minimize operational costs is one of the key business tactics used by manufacturers in the diphenylamine (DPA) industry to benefit clients and increase the market sector. In recent years, the diphenylamine (DPA) industry has offered some of the most significant advantages to medicine. Major players in the diphenylamine (DPA) market, including Eastman Chemical Company (US), Duslo a.s. (Slovakia), SONGWON (South Korea), Nantong Xinbang Chemical Technology Chemical Co, Ltd (China) and others, are attempting to increase market demand by investing in R&D operations.

    Kumho Petrochemical Co., Ltd. is a South Korean multinational chemical corporation headquartered in Seoul. It was established in 1970 as a result of Kumho Group's inability to source raw materials for its bus and tire businesses. Kumho Petrochemical leads the market in the production of synthetic rubbers, with the world's highest production capacity based on SBR and BR according to IISRP 2012. As its core business, it concentrates on synthetic rubbers, synthetic resins, speciality chemicals, electronic chemicals, energy, construction materials, and advanced materials. Forbes rated Kumho Petrochemical 1806th among 'the 2000' in 2011.

    It became a component of the KOSPI 100 index, which monitors 100 significant businesses listed on the Korea Stock Exchange. in August 2021, Kumho Petrochemical has announced the usage of environmentally friendly basilica derived from rice bran in its high-performance synthetic rubbers, including S-SBR.

    Lanxess AG is a German specialty chemicals firm headquartered in Cologne, Germany. It was created in 2004 following the spin-off of Bayer AG's chemicals division and sections of its polymers business. The company's origins may be traced back to 1863, the year Bayer AG was founded. As part of a major restructuring, the Bayer Group chose to spin off big parts of its chemical activities and roughly one-third of its polymer business into an independent company in November 2003.

    Lanxess AG shares were listed in Germany's DAX from September 24, 2012 to September 21, 2015, and are now part of the MDAX, a midcap index. The Dow Jones Sustainability Index and the FTSE4Good Index both include the company. April 2019, LANXESS, a market player, has acquired Chemtura Corporation, a well-known company noted for its DPA production levels. LANXESS is also expanding its market dominance by entering the organometallics and additives industries.

    Key Companies in the Diphenylamine Market market include

    Industry Developments

    In August 2021, Kumho Petrochemical has announced the usage of environmentally friendly biosilica derived from rice bran in its high-performance synthetic rubbers, including S-SBR.

    In October 2021, GRI, an Indian tyre manufacturer, has announced the release of the Ultimate Green XT, a solid material handling tyre that is environmentally friendly. The latest GRI tyre, constructed of pure natural rubber and silica, is designed to improve energy economy by having a 20.4% lower rolling resistance than currently available tyres.

    In August 2020, SONGNOX L670 was introduced by notable player SONGWON. It is expected that SONGNOX L670 will be used in conjunction with SONGNOX L135 to stabilize autos, engines, gear oils, and greases.

    Future Outlook

    Diphenylamine Market Future Outlook

    The Global Diphenylamine (DPA) Market is projected to grow at a 3.63% CAGR from 2025 to 2035, driven by increasing demand in agriculture and automotive sectors.

    New opportunities lie in:

    • Develop eco-friendly DPA formulations to meet regulatory standards.
    • Expand into emerging markets with tailored marketing strategies.
    • Invest in R&D for innovative applications in pharmaceuticals and electronics.

    By 2035, the market is expected to demonstrate robust growth, reflecting evolving industry needs and technological advancements.

    Market Segmentation

    Diphenylamine (DPA) Regional Outlook

    North America
    • US
    • Canada

    Diphenylamine (DPA) Market Application Outlook

    • Chemical Intermediates
    • Antioxidants
    • Fungicides
    • Others.

    Diphenylamine (DPA) Market End-Use Industry Outlook

    • Personal Care
    • Automotive And Agriculture
    • Cosmetics
    • Rubber
    • Plastics Industry

    Report Scope

    Attribute/Metric Details
    Market Size 2024 USD 0.41 billion
    Market Size 2035 0.61 (Value (USD Billion))
    Compound Annual Growth Rate (CAGR) 3.63% (2025 - 2035)
    Base Year 2024
    Market Forecast Period 2025 - 2035
    Historical Data 2018- 2022
    Market Forecast Units Value (USD Billion)
    Report Coverage Revenue Forecast, Market Competitive Landscape, Growth Factors, and Trends
    Segments Covered Application, End-Use Industry, and Region
    Geographies Covered North America, Europe, AsiaPacific, and the Rest of the World
    Countries Covered The U.S., Canada, German, France, UK, Italy, Spain, China, Japan, India, Australia, South Korea, and Brazil
    Key Companies Profiled BASF SE (Germany), Huntsman International LLC (US), LANXESS (Germany), The Lubrizol Corporation (US), Merck KGaA (Germany), Seiko Chemical Co. Ltd (Tokyo), Eastman Chemical Company (US), Duslo a.s. (Slovakia), SONGWON (South Korea), Nantong Xinbang Chemical Technology Chemical Co, Ltd (China), Jiangsu Feiya Chemical Industry Co. Ltd (Austria).
    Key Market Opportunities The Market for Diphenylamine Producers increases the usage of diphenylamine as a fungicide.
    Key Market Dynamics The demand for explosives and nitrocellulose-based propellants.
    Market Size 2025 0.42 (Value (USD Billion))

    FAQs

    How much is the diphenylamine (DPA) market?

    Diphenylamine Market crossed a valuation of USD 0.41 Billion in 2024

    What is the growth rate of the diphenylamine (DPA) market?

    Diphenylamine Market is projected to grow at a CAGR of 3.63% during the forecast period, 2025-2035

    Which region held the largest market share in the diphenylamine (DPA) market?

    North America had the largest share of the market

    Who are the key players in the diphenylamine (DPA) market?

    The key players in the market are Eastman Chemical Company (US), Duslo a.s. (Slovakia), SONGWON (South Korea), Nantong Xinbang Chemical Technology Chemical Co, Ltd (China)

    Which end-user industry led the diphenylamine (DPA) market?

    Diphenylamine Market was valued at USD 0.41 Billion in 2024

    Which application had the largest market share in the diphenylamine (DPA) market?

    The Antioxidants had the largest share of the market

    1. Executive Summary
      1. \r\n1.1 Market Attractiveness Analysis 18
      2. \r\n1.1.1
    2. Global Diphenylamine (DPA) Market, By Application 18
      1. \r\n1.1.2 Global Diphenylamine
    3. (DPA) Market, By End Use 19
      1. \r\n2 Market Introduction
      2. \r\n2.1 Definition
      3. 20
      4. \r\n2.2 Scope Of The Study 20
      5. \r\n2.3 Market Structure 20
      6. \r\n3
      7. Market Insights
      8. \r\n4 Research Methodology
      9. \r\n4.1 Research Process
      10. 25
      11. \r\n4.2 Primary Research 26
      12. \r\n4.3 Secondary Research 27
      13. \r\n4.4
      14. Market Size Estimation 28
      15. \r\n4.5 Forecast Model 28
      16. \r\n4.6 Assumptions
      17. & Limitations 29
      18. \r\n5 Market Dynamics
      19. \r\n5.1 Introduction 30
      20. \r\n5.2
      21. Drivers 31
      22. \r\n5.2.1 Growing Demand For DPA As An Antioxidant In Lubricants
      23. 31
      24. \r\n5.2.2 Increasing Application Of DPA In Nitrocellulose-Based Explosives
      25. Pertaining To Its Antioxidizing Property 32
      26. \r\n5.2.3 High Demand For DPA
      27. As An Anti-Scalding Agent 32
      28. \r\n5.2.4 Drivers Impact Analysis 33
      29. \r\n5.3
      30. Restraints 33
      31. \r\n5.3.1 Risks Associated With DPA 33
      32. \r\n5.3.2 Restraints
      33. Impact Analysis 34
      34. \r\n5.4 Opportunities 34
      35. \r\n5.4.1 Growing Adoption
      36. Of Rubber- And Polymer-Based Products In The Automotive Industry 34
      37. \r\n6
      38. Market Factor Analysis
      39. \r\n6.1 Supply Chain Analysis 35
      40. \r\n6.1.1 Raw
      41. Materials Suppliers 35
      42. \r\n6.1.2 Diphenylamine (DPA) Producers 36
      43. \r\n6.1.3
      44. Distribution Channel 36
      45. \r\n6.1.4 End Use 36
      46. \r\n6.2 Porter’s
      47. Five Forces Model 37
      48. \r\n6.2.1 Threat Of New Entrants 37
      49. \r\n6.2.2 Intensity
      50. Of Competitive Rivalry 37
      51. \r\n6.2.3 Threat Of Substitutes 38
      52. \r\n6.2.4
      53. Bargaining Power Of Suppliers 38
      54. \r\n6.2.5 Bargaining Power Of Buyers 38
      55. \r\n6.3
      56. Pricing Analysis 39
      57. \r\n6.4 Trade Landscape 39
      58. \r\n6.5 Technological
      59. Analysis 40
    4. \r\n7 Global Diphenylamine (DPA) Market, By Application
      1. \r\n7.1
      2. Introduction 41
      3. \r\n7.2 Antioxidants 43
      4. \r\n7.3 Chemical Intermediate
      5. 44
      6. \r\n7.4 Fungicide 45
      7. \r\n7.5 Others 46
      8. \r\n8 Global Diphenylamine
    5. (DPA) Market, By End Use
      1. \r\n8.1 Introduction 47
      2. \r\n8.2 Automotive
      3. 49
      4. \r\n8.3 General Industry 50
      5. \r\n8.4 Agriculture 51
      6. \r\n8.5
      7. Plastics & Rubber 52
      8. \r\n8.6 Cosmetics & Personal Care 53
      9. \r\n8.7
      10. Others 54
    6. \r\n9 Global Diphenylamine (DPA) Market, By Region
      1. \r\n9.1
      2. Introduction 55
      3. \r\n9.2 North America 59
      4. \r\n9.2.1 US 62
      5. \r\n9.2.2
      6. Canada 64
      7. \r\n9.3 Europe 66
      8. \r\n9.3.1 Germany 69
      9. \r\n9.3.2 UK
      10. 71
      11. \r\n9.3.3 France 73
      12. \r\n9.3.4 Spain 75
      13. \r\n9.3.5 Italy 77
      14. \r\n9.3.6
      15. Russia 79
      16. \r\n9.3.7 CIS 81
      17. \r\n9.3.8 The Netherlands 83
      18. \r\n9.3.9
      19. Belgium 85
      20. \r\n9.3.10 Rest Of Europe 87
      21. \r\n9.4 Asia Pacific 89
      22. \r\n9.4.1
      23. China 92
      24. \r\n9.4.2 Japan 94
      25. \r\n9.4.3 India 96
      26. \r\n9.4.4 Australia
      27. & New Zealand 98
      28. \r\n9.4.5 South Korea 100
      29. \r\n9.4.6 Indonesia 102
      30. \r\n9.4.7
      31. Thailand 104
      32. \r\n9.4.8 Rest Of Asia Pacific 106
      33. \r\n9.5 Latin America
      34. 108
      35. \r\n9.5.1 Mexico 111
      36. \r\n9.5.2 Argentina 113
      37. \r\n9.5.3 Brazil
      38. 115
      39. \r\n9.5.4 Rest Of Latin America 117
      40. \r\n9.6 The Middle East And
      41. Africa 119
      42. \r\n9.6.1 Turkey 122
      43. \r\n9.6.2 Saudi Arabia 124
      44. \r\n9.6.3
      45. UAE 126
      46. \r\n9.6.4 Rest Of Middle East And Africa 128
      47. \r\n10 Competitive
      48. Landscape
      49. \r\n10.1 Introduction 131
      50. \r\n10.2 Market Strategy Analysis
      51. 131
      52. \r\n10.3 Key Developments Analysis 131
      53. \r\n10.4 Customer Analysis
      54. 132
      55. \r\n10.5 Global Diphenylamine Production, By Region (2014–2018),
      56. Kilotons 136
      57. \r\n11 Company Profiles
      58. \r\n11.1 BASF SE 137
      59. \r\n11.1.1
      60. Company Overview 137
      61. \r\n11.1.2 Financial Overview 137
      62. \r\n11.1.3 Products
      63. Offered 138
      64. \r\n11.1.4 Key Developments 138
      65. \r\n11.1.5 SWOT Analysis
      66. 138
      67. \r\n11.1.6 Key Strategies 138
      68. \r\n11.2 Huntsman International LLC
      69. 139
      70. \r\n11.2.1 Company Overview 139
      71. \r\n11.2.2 Financial Overview 139
      72. \r\n11.2.3
      73. Products Offered 140
      74. \r\n11.2.4 Key Developments 140
      75. \r\n11.2.5 SWOT
      76. Analysis 140
      77. \r\n11.2.6 Key Strategies 140
      78. \r\n11.3 LANXESS 141
      79. \r\n11.3.1
      80. Company Overview 141
      81. \r\n11.3.2 Financial Overview 141
      82. \r\n11.3.3 Products
      83. Offered 142
      84. \r\n11.3.4 Key Developments 142
      85. \r\n11.3.5 SWOT Analysis
      86. 142
      87. \r\n11.3.6 Key Strategies 142
      88. \r\n11.4 The Lubrizol Corporation
      89. 143
      90. \r\n11.4.1 Company Overview 143
      91. \r\n11.4.2 Financial Overview 143
      92. \r\n11.4.3
      93. Products Offered 143
      94. \r\n11.4.4 Key Developments 143
      95. \r\n11.4.5 SWOT
      96. Analysis 144
      97. \r\n11.4.6 Key Strategies 144
      98. \r\n11.5 Merck KGaA 145
      99. \r\n11.5.1
      100. Company Overview 145
      101. \r\n11.5.2 Financial Overview 145
      102. \r\n11.5.3 Products
      103. Offered 146
      104. \r\n11.5.4 Key Developments 146
      105. \r\n11.5.5 SWOT Analysis
      106. 146
      107. \r\n11.5.6 Key Strategies 146
      108. \r\n11.6 Seiko Chemical Co. Ltd 147
      109. \r\n11.6.1
      110. Company Overview 147
      111. \r\n11.6.2 Financial Overview 147
      112. \r\n11.6.3 Products
      113. Offered 147
      114. \r\n11.6.4 Key Developments 147
      115. \r\n11.6.5 SWOT Analysis
      116. 148
      117. \r\n11.6.6 Key Strategies 148
      118. \r\n11.7 Eastman Chemical Company
      119. 149
      120. \r\n11.7.1 Company Overview 149
      121. \r\n11.7.2 Financial Overview 149
      122. \r\n11.7.3
      123. Products Offered 150
      124. \r\n11.7.4 Key Developments 150
      125. \r\n11.7.5 SWOT
      126. Analysis 150
      127. \r\n11.7.6 Key Strategies 150
      128. \r\n11.8 Duslo, A.S. 151
      129. \r\n11.8.1
      130. Company Overview 151
      131. \r\n11.8.2 Financial Overview 151
      132. \r\n11.8.3 Products
      133. Offered 151
      134. \r\n11.8.4 Key Developments 151
      135. \r\n11.8.5 SWOT Analysis
      136. 152
      137. \r\n11.8.6 Key Strategies 152
      138. \r\n11.9 SONGWON 153
      139. \r\n11.9.1
      140. Company Overview 153
      141. \r\n11.9.2 Financial Overview 153
      142. \r\n11.9.3 Products
      143. Offered 154
      144. \r\n11.9.4 Key Developments 154
      145. \r\n11.9.5 SWOT Analysis
      146. 154
      147. \r\n11.9.6 Key Strategies 154
      148. \r\n11.10 Nantong Xinbang Chemical
      149. Technology Chemical Co, Ltd 155
      150. \r\n11.10.1 Company Overview 155
      151. \r\n11.10.2
      152. Financial Overview 155
      153. \r\n11.10.3 Products Offered 155
      154. \r\n11.10.4
      155. Key Developments 155
      156. \r\n11.10.5 SWOT Analysis 156
      157. \r\n11.10.6 Key Strategies
      158. 156
      159. \r\n11.11 Jiangsu Feiya Chemical Industry Co. Ltd 157
      160. \r\n11.11.1
      161. Company Overview 157
      162. \r\n11.11.2 Financial Overview 157
      163. \r\n11.11.3
      164. Products Offered 157
      165. \r\n11.11.4 Key Developments 157
      166. \r\n11.11.5 SWOT
      167. Analysis 158
      168. \r\n11.11.6 Key Strategies 158
      169. \r\n12 Conclusion
      170. \r\n13
      171. List Of Tables
      172. \r\nTABLE 1 LIST OF ASSUMPTIONS 29
      173. \r\nTABLE 2 PRICING
      174. ANALYSIS, USD/TONS 39
      175. \r\nTABLE 3 IMPORT DATA, (2014–2018), TONS, 39
      176. \r\nTABLE
    7. EXPORT DATA, (2014–2018), TONS 39
      1. \r\nTABLE 5 GLOBAL DIPHENYLAMINE,
      2. BY APPLICATION, 2023-2032 (USD BILLION) 41
      3. \r\nTABLE 6 GLOBAL DIPHENYLAMINE
    8. (DPA) MARKET, BY APPLICATION, 2023-2032 (KILO TONS) 42
      1. \r\nTABLE 7 GLOBAL
    9. DIPHENYLAMINE (DPA) MARKET FOR ANTIOXIDANTS, BY REGION, 2023-2032 (USD BILLION)
      1. 43
    10. \r\nTABLE 8 GLOBAL DIPHENYLAMINE (DPA) MARKET FOR ANTIOXIDANTS, BY REGION,
      1. \r\nTABLE 9 GLOBAL DIPHENYLAMINE (DPA) MARKET FOR
      2. CHEMICAL INTERMEDIATE, BY REGION, 2023-2032 (USD BILLION) 44
      3. \r\nTABLE 10
    11. GLOBAL DIPHENYLAMINE (DPA) MARKET FOR CHEMICAL INTERMEDIATE, BY REGION, 2023-2032
      1. (KILO TONS) 44
      2. \r\nTABLE 11 GLOBAL DIPHENYLAMINE (DPA) MARKET FOR FUNGICIDE,
      3. BY REGION, 2023-2032 (USD BILLION) 45
      4. \r\nTABLE 12 GLOBAL DIPHENYLAMINE (DPA)
    12. MARKET FOR FUNGICIDE, BY REGION, 2023-2032 (KILO TONS) 45
      1. \r\nTABLE 13 GLOBAL
    13. DIPHENYLAMINE (DPA) MARKET FOR OTHERS, BY REGION, 2023-2032 (USD BILLION) 46
      1. \r\nTABLE
    14. GLOBAL DIPHENYLAMINE (DPA) MARKET FOR OTHERS, BY REGION, 2023-2032 (KILO TONS)
      1. 46
      2. \r\nTABLE 15 GLOBAL DIPHENYLAMINE, BY END USE, 2023-2032 (USD BILLION)
      3. 47
    15. \r\nTABLE 16 GLOBAL DIPHENYLAMINE (DPA) MARKET, BY END USE, 2023-2032 (KILO
      1. TONS) 48
      2. \r\nTABLE 17 GLOBAL DIPHENYLAMINE (DPA) MARKET FOR AUTOMOTIVE, BY
      3. REGION, 2023-2032 (USD BILLION) 49
      4. \r\nTABLE 18 GLOBAL DIPHENYLAMINE (DPA)
    16. MARKET FOR AUTOMOTIVE, BY REGION, 2023-2032 (KILO TONS) 49
      1. \r\nTABLE 19 GLOBAL
    17. DIPHENYLAMINE (DPA) MARKET FOR GENERAL INDUSTRY, BY REGION, 2023-2032 (USD BILLION)
      1. 50
      2. \r\nTABLE 20 GLOBAL DIPHENYLAMINE (DPA) MARKET FOR GENERAL INDUSTRY, BY
      3. REGION, 2023-2032 (KILO TONS) 50
      4. \r\nTABLE 21 GLOBAL DIPHENYLAMINE (DPA) MARKET
      5. FOR AGRICULTURE, BY REGION, 2023-2032 (USD BILLION) 51
      6. \r\nTABLE 22 GLOBAL
    18. DIPHENYLAMINE (DPA) MARKET FOR AGRICULTURE, BY REGION, 2023-2032 (KILO TONS) 51
      1. \r\nTABLE
    19. GLOBAL DIPHENYLAMINE (DPA) MARKET FOR PLASTICS & RUBBER, BY REGION, 2023-2032
      1. (USD BILLION) 52
      2. \r\nTABLE 24 GLOBAL DIPHENYLAMINE (DPA) MARKET FOR PLASTICS
      3. & RUBBER, BY REGION, 2023-2032 (KILO TONS) 52
      4. \r\nTABLE 25 GLOBAL DIPHENYLAMINE
    20. (DPA) MARKET FOR COSMETICS & PERSONAL CARE, BY REGION, 2023-2032 (USD BILLION)
      1. 53
      2. \r\nTABLE 26 GLOBAL DIPHENYLAMINE (DPA) MARKET FOR COSMETICS & PERSONAL
      3. CARE, BY REGION, 2023-2032 (KILO TONS) 53
      4. \r\nTABLE 27 GLOBAL DIPHENYLAMINE
    21. (DPA) MARKET FOR OTHERS, BY REGION, 2023-2032 (USD BILLION) 54
      1. \r\nTABLE 28
    22. GLOBAL DIPHENYLAMINE (DPA) MARKET FOR OTHERS, BY REGION, 2023-2032 (KILO TONS) 54
      1. \r\nTABLE
    23. GLOBAL DIPHENYLAMINE (DPA) MARKET, BY REGION, 2023-2032 (USD BILLION) 56
      1. \r\nTABLE
    24. GLOBAL DIPHENYLAMINE (DPA) MARKET, BY REGION, 2023-2032 (KILO TONS) 57
      1. \r\nTABLE
    25. GLOBAL DIPHENYLAMINE (DPA) MARKET, BY APPLICATION, 2023-2032 (USD BILLION) 57
      1. \r\nTABLE
    26. GLOBAL DIPHENYLAMINE (DPA) MARKET, BY APPLICATION, 2023-2032 (KILO TONS) 58
      1. \r\nTABLE
    27. GLOBAL DIPHENYLAMINE (DPA) MARKET, BY END USE, 2023-2032 (USD BILLION) 58
      1. \r\nTABLE
    28. GLOBAL DIPHENYLAMINE (DPA) MARKET, BY END USE, 2023-2032 (KILO TONS) 59
      1. \r\nTABLE
    29. NORTH AMERICA DIPHENYLAMINE (DPA) MARKET, BY COUNTRY, 2023-2032 (USD BILLION)
      1. 59
    30. \r\nTABLE 36 NORTH AMERICA DIPHENYLAMINE (DPA) MARKET, BY COUNTRY, 2023-2032
      1. (KILO TONS) 60
    31. \r\nTABLE 37 NORTH AMERICA DIPHENYLAMINE (DPA) MARKET, BY APPLICATION,
      1. \r\nTABLE 38 NORTH AMERICA DIPHENYLAMINE (DPA)
    32. MARKET, BY APPLICATION, 2023-2032 (KILO TONS) 60
      1. \r\nTABLE 39 NORTH AMERICA
    33. DIPHENYLAMINE (DPA) MARKET, BY END USE, 2023-2032 (USD BILLION) 61
      1. \r\nTABLE
    34. NORTH AMERICA DIPHENYLAMINE (DPA) MARKET, BY END USE, 2023-2032 (KILO TONS) 61
      1. \r\nTABLE
    35. US DIPHENYLAMINE (DPA) MARKET, BY APPLICATION, 2023-2032 (USD BILLION) 62
      1. \r\nTABLE
    36. US DIPHENYLAMINE (DPA) MARKET, BY APPLICATION, 2023-2032 (KILO TONS) 62
      1. \r\nTABLE
    37. US DIPHENYLAMINE (DPA) MARKET, BY END USE, 2023-2032 (USD BILLION) 63
      1. \r\nTABLE
    38. US DIPHENYLAMINE (DPA) MARKET, BY END USE, 2023-2032 (KILO TONS) 63
      1. \r\nTABLE
    39. CANADA DIPHENYLAMINE (DPA) MARKET, BY APPLICATION, 2023-2032 (USD BILLION) 64
      1. \r\nTABLE
    40. CANADA DIPHENYLAMINE (DPA) MARKET, BY APPLICATION, 2023-2032 (KILO TONS) 64
      1. \r\nTABLE
    41. CANADA DIPHENYLAMINE (DPA) MARKET, BY END USE, 2023-2032 (USD BILLION) 65
      1. \r\nTABLE
    42. CANADA DIPHENYLAMINE (DPA) MARKET, BY END USE, 2023-2032 (KILO TONS) 65
      1. \r\nTABLE
    43. EUROPE DIPHENYLAMINE (DPA) MARKET, BY COUNTRY, 2023-2032 (USD BILLION) 66
      1. \r\nTABLE
    44. EUROPE DIPHENYLAMINE (DPA) MARKET, BY COUNTRY, 2023-2032 (KILO TONS) 67
      1. \r\nTABLE
    45. EUROPE DIPHENYLAMINE (DPA) MARKET, BY APPLICATION, 2023-2032 (USD BILLION) 67
      1. \r\nTABLE
    46. EUROPE DIPHENYLAMINE (DPA) MARKET, BY APPLICATION, 2023-2032 (KILO TONS) 68
      1. \r\nTABLE
    47. EUROPE DIPHENYLAMINE (DPA) MARKET, BY END USE, 2023-2032 (USD BILLION) 68
      1. \r\nTABLE
    48. EUROPE DIPHENYLAMINE (DPA) MARKET, BY END USE, 2023-2032 (KILO TONS) 69
      1. \r\nTABLE
    49. GERMANY DIPHENYLAMINE (DPA) MARKET, BY APPLICATION, 2023-2032 (USD BILLION) 69
      1. \r\nTABLE
    50. GERMANY DIPHENYLAMINE (DPA) MARKET, BY APPLICATION, 2023-2032 (KILO TONS) 70
      1. \r\nTABLE
    51. GERMANY DIPHENYLAMINE (DPA) MARKET, BY END USE, 2023-2032 (USD BILLION) 70
      1. \r\nTABLE
    52. GERMANY DIPHENYLAMINE (DPA) MARKET, BY END USE, 2023-2032 (KILO TONS) 71
      1. \r\nTABLE
    53. UK DIPHENYLAMINE (DPA) MARKET, BY APPLICATION, 2023-2032 (USD BILLION) 71
      1. \r\nTABLE
    54. UK DIPHENYLAMINE (DPA) MARKET, BY APPLICATION, 2023-2032 (KILO TONS) 72
      1. \r\nTABLE
    55. UK DIPHENYLAMINE (DPA) MARKET, BY END USE, 2023-2032 (USD BILLION) 72
      1. \r\nTABLE
    56. UK DIPHENYLAMINE (DPA) MARKET, BY END USE, 2023-2032 (KILO TONS) 73
      1. \r\nTABLE
    57. FRANCE DIPHENYLAMINE (DPA) MARKET, BY APPLICATION, 2023-2032 (USD BILLION) 73
      1. \r\nTABLE
    58. FRANCE DIPHENYLAMINE (DPA) MARKET, BY APPLICATION, 2023-2032 (KILO TONS) 74
      1. \r\nTABLE
    59. FRANCE DIPHENYLAMINE (DPA) MARKET, BY END USE, 2023-2032 (USD BILLION) 74
      1. \r\nTABLE
    60. FRANCE DIPHENYLAMINE (DPA) MARKET, BY END USE, 2023-2032 (KILO TONS) 75
      1. \r\nTABLE
    61. SPAIN DIPHENYLAMINE (DPA) MARKET, BY APPLICATION, 2023-2032 (USD BILLION) 75
      1. \r\nTABLE
    62. SPAIN DIPHENYLAMINE (DPA) MARKET, BY APPLICATION, 2023-2032 (KILO TONS) 76
      1. \r\nTABLE
    63. SPAIN DIPHENYLAMINE (DPA) MARKET, BY END USE, 2023-2032 (USD BILLION) 76
      1. \r\nTABLE
    64. SPAIN DIPHENYLAMINE (DPA) MARKET, BY END USE, 2023-2032 (KILO TONS) 77
      1. \r\nTABLE
    65. ITALY DIPHENYLAMINE (DPA) MARKET, BY APPLICATION, 2023-2032 (USD BILLION) 77
      1. \r\nTABLE
    66. ITALY DIPHENYLAMINE (DPA) MARKET, BY APPLICATION, 2023-2032 (KILO TONS) 78
      1. \r\nTABLE
    67. ITALY DIPHENYLAMINE (DPA) MARKET, BY END USE, 2023-2032 (USD BILLION) 78
      1. \r\nTABLE
    68. ITALY DIPHENYLAMINE (DPA) MARKET, BY END USE, 2023-2032 (KILO TONS) 79
      1. \r\nTABLE
    69. RUSSIA DIPHENYLAMINE (DPA) MARKET, BY APPLICATION, 2023-2032 (USD BILLION) 79
      1. \r\nTABLE
    70. RUSSIA DIPHENYLAMINE (DPA) MARKET, BY APPLICATION, 2023-2032 (KILO TONS) 80
      1. \r\nTABLE
    71. RUSSIA DIPHENYLAMINE (DPA) MARKET, BY END USE, 2023-2032 (USD BILLION) 80
      1. \r\nTABLE
    72. RUSSIA DIPHENYLAMINE (DPA) MARKET, BY END USE, 2023-2032 (KILO TONS) 81
      1. \r\nTABLE
    73. CIS DIPHENYLAMINE (DPA) MARKET, BY APPLICATION, 2023-2032 (USD BILLION) 81
      1. \r\nTABLE
    74. CIS DIPHENYLAMINE (DPA) MARKET, BY APPLICATION, 2023-2032 (KILO TONS) 82
      1. \r\nTABLE
    75. CIS DIPHENYLAMINE (DPA) MARKET, BY END USE, 2023-2032 (USD BILLION) 82
      1. \r\nTABLE
    76. CIS DIPHENYLAMINE (DPA) MARKET, BY END USE, 2023-2032 (KILO TONS) 83
      1. \r\nTABLE
    77. THE NETHERLANDS DIPHENYLAMINE (DPA) MARKET, BY APPLICATION, 2023-2032 (USD BILLION)
      1. 83
    78. \r\nTABLE 84 THE NETHERLANDS DIPHENYLAMINE (DPA) MARKET, BY APPLICATION,
      1. \r\nTABLE 85 THE NETHERLANDS DIPHENYLAMINE (DPA)
    79. MARKET, BY END USE, 2023-2032 (USD BILLION) 84
      1. \r\nTABLE 86 THE NETHERLANDS
    80. DIPHENYLAMINE (DPA) MARKET, BY END USE, 2023-2032 (KILO TONS) 85
      1. \r\nTABLE
    81. BELGIUM DIPHENYLAMINE (DPA) MARKET, BY APPLICATION, 2023-2032 (USD BILLION) 85
      1. \r\nTABLE
    82. BELGIUM DIPHENYLAMINE (DPA) MARKET, BY APPLICATION, 2023-2032 (KILO TONS) 86
      1. \r\nTABLE
    83. BELGIUM DIPHENYLAMINE (DPA) MARKET, BY END USE, 2023-2032 (USD BILLION) 86
      1. \r\nTABLE
    84. BELGIUM DIPHENYLAMINE (DPA) MARKET, BY END USE, 2023-2032 (KILO TONS) 87
      1. \r\nTABLE
    85. REST OF EUROPE DIPHENYLAMINE (DPA) MARKET, BY APPLICATION, 2023-2032 (USD BILLION)
      1. 87
    86. \r\nTABLE 92 REST OF EUROPE DIPHENYLAMINE (DPA) MARKET, BY APPLICATION,
      1. \r\nTABLE 93 REST OF EUROPE DIPHENYLAMINE (DPA) MARKET,
      2. BY END USE, 2023-2032 (USD BILLION) 88
      3. \r\nTABLE 94 REST OF EUROPE DIPHENYLAMINE
    87. (DPA) MARKET, BY END USE, 2023-2032 (KILO TONS) 89
      1. \r\nTABLE 95 ASIA PACIFIC
    88. DIPHENYLAMINE (DPA) MARKET, BY COUNTRY, 2023-2032 (USD BILLION) 89
      1. \r\nTABLE
    89. ASIA PACIFIC DIPHENYLAMINE (DPA) MARKET, BY COUNTRY, 2023-2032 (KILO TONS) 90
      1. \r\nTABLE
    90. ASIA PACIFIC DIPHENYLAMINE (DPA) MARKET, BY APPLICATION, 2023-2032 (USD BILLION)
      1. 90
    91. \r\nTABLE 98 ASIA PACIFIC DIPHENYLAMINE (DPA) MARKET, BY APPLICATION, 2023-2032
      1. (KILO TONS) 91
    92. \r\nTABLE 99 ASIA PACIFIC DIPHENYLAMINE (DPA) MARKET, BY END
      1. USE, 2023-2032 (USD BILLION) 91
      2. \r\nTABLE 100 ASIA PACIFIC DIPHENYLAMINE (DPA)
    93. MARKET, BY END USE, 2023-2032 (KILO TONS) 92
      1. \r\nTABLE 101 CHINA DIPHENYLAMINE
    94. (DPA) MARKET, BY APPLICATION, 2023-2032 (USD BILLION) 92
      1. \r\nTABLE 102 CHINA
    95. DIPHENYLAMINE (DPA) MARKET, BY APPLICATION, 2023-2032 (KILO TONS) 93
      1. \r\nTABLE
    96. CHINA DIPHENYLAMINE (DPA) MARKET, BY END USE, 2023-2032 (USD BILLION) 93
      1. \r\nTABLE
    97. CHINA DIPHENYLAMINE (DPA) MARKET, BY END USE, 2023-2032 (KILO TONS) 94
      1. \r\nTABLE
    98. JAPAN DIPHENYLAMINE (DPA) MARKET, BY APPLICATION, 2023-2032 (USD BILLION) 94
      1. \r\nTABLE
    99. JAPAN DIPHENYLAMINE (DPA) MARKET, BY APPLICATION, 2023-2032 (KILO TONS) 95
      1. \r\nTABLE
    100. JAPAN DIPHENYLAMINE (DPA) MARKET, BY END USE, 2023-2032 (USD BILLION) 95
      1. \r\nTABLE
    101. JAPAN DIPHENYLAMINE (DPA) MARKET, BY END USE, 2023-2032 (KILO TONS) 96
      1. \r\nTABLE
    102. INDIA DIPHENYLAMINE (DPA) MARKET, BY APPLICATION, 2023-2032 (USD BILLION) 96
      1. \r\nTABLE
    103. INDIA DIPHENYLAMINE (DPA) MARKET, BY APPLICATION, 2023-2032 (KILO TONS) 97
      1. \r\nTABLE
    104. INDIA DIPHENYLAMINE (DPA) MARKET, BY END USE, 2023-2032 (USD BILLION) 97
      1. \r\nTABLE
    105. INDIA DIPHENYLAMINE (DPA) MARKET, BY END USE, 2023-2032 (KILO TONS) 98
      1. \r\nTABLE
    106. AUSTRALIA & NEW ZEALAND DIPHENYLAMINE (DPA) MARKET, BY APPLICATION, 2023-2032
      1. (USD BILLION) 98
      2. \r\nTABLE 114 AUSTRALIA & NEW ZEALAND DIPHENYLAMINE (DPA)
    107. MARKET, BY APPLICATION, 2023-2032 (KILO TONS) 99
      1. \r\nTABLE 115 AUSTRALIA &
    108. NEW ZEALAND DIPHENYLAMINE (DPA) MARKET, BY END USE, 2023-2032 (USD BILLION) 99
      1. \r\nTABLE
    109. AUSTRALIA & NEW ZEALAND DIPHENYLAMINE (DPA) MARKET, BY END USE, 2023-2032
      1. (KILO TONS) 100
    110. \r\nTABLE 117 SOUTH KOREA DIPHENYLAMINE (DPA) MARKET, BY APPLICATION,
      1. \r\nTABLE 118 SOUTH KOREA DIPHENYLAMINE (DPA)
    111. MARKET, BY APPLICATION, 2023-2032 (KILO TONS) 101
      1. \r\nTABLE 119 SOUTH KOREA
    112. DIPHENYLAMINE (DPA) MARKET, BY END USE, 2023-2032 (USD BILLION) 101
      1. \r\nTABLE
    113. SOUTH KOREA DIPHENYLAMINE (DPA) MARKET, BY END USE, 2023-2032 (KILO TONS) 102
      1. \r\nTABLE
    114. INDONESIA DIPHENYLAMINE (DPA) MARKET, BY APPLICATION, 2023-2032 (USD BILLION)
      1. 102
    115. \r\nTABLE 122 INDONESIA DIPHENYLAMINE (DPA) MARKET, BY APPLICATION, 2023-2032
      1. (KILO TONS) 103
    116. \r\nTABLE 123 INDONESIA DIPHENYLAMINE (DPA) MARKET, BY END
      1. USE, 2023-2032 (USD BILLION) 103
      2. \r\nTABLE 124 INDONESIA DIPHENYLAMINE (DPA)
    117. MARKET, BY END USE, 2023-2032 (KILO TONS) 104
      1. \r\nTABLE 125 THAILAND DIPHENYLAMINE
    118. (DPA) MARKET, BY APPLICATION, 2023-2032 (USD BILLION) 104
      1. \r\nTABLE 126 THAILAND
    119. DIPHENYLAMINE (DPA) MARKET, BY APPLICATION, 2023-2032 (KILO TONS) 105
      1. \r\nTABLE
    120. THAILAND DIPHENYLAMINE (DPA) MARKET, BY END USE, 2023-2032 (USD BILLION) 105
      1. \r\nTABLE
    121. THAILAND DIPHENYLAMINE (DPA) MARKET, BY END USE, 2023-2032 (KILO TONS) 106
      1. \r\nTABLE
    122. REST OF ASIA PACIFIC DIPHENYLAMINE (DPA) MARKET, BY APPLICATION, 2023-2032 (USD
      1. BILLION) 106
      2. \r\nTABLE 130 REST OF ASIA PACIFIC DIPHENYLAMINE (DPA) MARKET,
      3. BY APPLICATION, 2023-2032 (KILO TONS) 107
      4. \r\nTABLE 131 REST OF ASIA PACIFIC
    123. DIPHENYLAMINE (DPA) MARKET, BY END USE, 2023-2032 (USD BILLION) 107
      1. \r\nTABLE
    124. REST OF ASIA PACIFIC DIPHENYLAMINE (DPA) MARKET, BY END USE, 2023-2032 (KILO
      1. TONS) 108
    125. \r\nTABLE 133 LATIN AMERICA DIPHENYLAMINE (DPA) MARKET, BY COUNTRY,
      1. \r\nTABLE 134 LATIN AMERICA DIPHENYLAMINE (DPA)
    126. MARKET, BY COUNTRY, 2023-2032 (KILO TONS) 109
      1. \r\nTABLE 135 LATIN AMERICA
    127. DIPHENYLAMINE (DPA) MARKET, BY APPLICATION, 2023-2032 (USD BILLION) 109
      1. \r\nTABLE
    128. LATIN AMERICA DIPHENYLAMINE (DPA) MARKET, BY APPLICATION, 2023-2032 (KILO TONS)
      1. 110
    129. \r\nTABLE 137 LATIN AMERICA DIPHENYLAMINE (DPA) MARKET, BY END USE, 2023-2032
      1. (USD BILLION) 110
      2. \r\nTABLE 138 LATIN AMERICA DIPHENYLAMINE (DPA) MARKET,
      3. BY END USE, 2023-2032 (KILO TONS) 111
      4. \r\nTABLE 139 MEXICO DIPHENYLAMINE (DPA)
    130. MARKET, BY APPLICATION, 2023-2032 (USD BILLION) 111
      1. \r\nTABLE 140 MEXICO DIPHENYLAMINE
    131. (DPA) MARKET, BY APPLICATION, 2023-2032 (KILO TONS) 112
      1. \r\nTABLE 141 MEXICO
    132. DIPHENYLAMINE (DPA) MARKET, BY END USE, 2023-2032 (USD BILLION) 112
      1. \r\nTABLE
    133. MEXICO DIPHENYLAMINE (DPA) MARKET, BY END USE, 2023-2032 (KILO TONS) 113
      1. \r\nTABLE
    134. ARGENTINA DIPHENYLAMINE (DPA) MARKET, BY APPLICATION, 2023-2032 (USD BILLION)
      1. 113
    135. \r\nTABLE 144 ARGENTINA DIPHENYLAMINE (DPA) MARKET, BY APPLICATION, 2023-2032
      1. (KILO TONS) 114
    136. \r\nTABLE 145 ARGENTINA DIPHENYLAMINE (DPA) MARKET, BY END
      1. USE, 2023-2032 (USD BILLION) 114
      2. \r\nTABLE 146 ARGENTINA DIPHENYLAMINE (DPA)
    137. MARKET, BY END USE, 2023-2032 (KILO TONS) 115
      1. \r\nTABLE 147 BRAZIL DIPHENYLAMINE
    138. (DPA) MARKET, BY APPLICATION, 2023-2032 (USD BILLION) 115
      1. \r\nTABLE 148 BRAZIL
    139. DIPHENYLAMINE (DPA) MARKET, BY APPLICATION, 2023-2032 (KILO TONS) 116
      1. \r\nTABLE
    140. BRAZIL DIPHENYLAMINE (DPA) MARKET, BY END USE, 2023-2032 (USD BILLION) 116
      1. \r\nTABLE
    141. BRAZIL DIPHENYLAMINE (DPA) MARKET, BY END USE, 2023-2032 (KILO TONS) 117
      1. \r\nTABLE
    142. REST OF LATIN AMERICA DIPHENYLAMINE (DPA) MARKET, BY APPLICATION, 2023-2032
      1. (USD BILLION) 117
      2. \r\nTABLE 152 REST OF LATIN AMERICA DIPHENYLAMINE (DPA)
    143. MARKET, BY APPLICATION, 2023-2032 (KILO TONS) 118
      1. \r\nTABLE 153 REST OF LATIN
    144. AMERICA DIPHENYLAMINE (DPA) MARKET, BY END USE, 2023-2032 (USD BILLION) 118
      1. \r\nTABLE
    145. REST OF LATIN AMERICA DIPHENYLAMINE (DPA) MARKET, BY END USE, 2023-2032 (KILO
      1. TONS) 119
      2. \r\nTABLE 155 THE MIDDLE EAST AND AFRICA DIPHENYLAMINE (DPA) MARKET,
      3. BY COUNTRY, 2023-2032 (USD BILLION) 119
      4. \r\nTABLE 156 THE MIDDLE EAST AND
    146. AFRICA DIPHENYLAMINE (DPA) MARKET, BY COUNTRY, 2023-2032 (KILO TONS) 120
      1. \r\nTABLE
    147. THE MIDDLE EAST AND AFRICA DIPHENYLAMINE (DPA) MARKET, BY APPLICATION, 2023-2032
      1. (USD BILLION) 120
      2. \r\nTABLE 158 THE MIDDLE EAST AND AFRICA DIPHENYLAMINE (DPA)
    148. MARKET, BY APPLICATION, 2023-2032 (KILO TONS) 121
      1. \r\nTABLE 159 THE MIDDLE
    149. EAST AND AFRICA DIPHENYLAMINE (DPA) MARKET, BY END USE, 2023-2032 (USD BILLION)
      1. 121
      2. \r\nTABLE 160 THE MIDDLE EAST AND AFRICA DIPHENYLAMINE (DPA) MARKET, BY
      3. END USE, 2023-2032 (KILO TONS) 122
      4. \r\nTABLE 161 TURKEY DIPHENYLAMINE (DPA)
    150. MARKET, BY APPLICATION, 2023-2032 (USD BILLION) 122
      1. \r\nTABLE 162 TURKEY DIPHENYLAMINE
    151. (DPA) MARKET, BY APPLICATION, 2023-2032 (KILO TONS) 123
      1. \r\nTABLE 163 TURKEY
    152. DIPHENYLAMINE (DPA) MARKET, BY END USE, 2023-2032 (USD BILLION) 123
      1. \r\nTABLE
    153. TURKEY DIPHENYLAMINE (DPA) MARKET, BY END USE, 2023-2032 (KILO TONS) 124
      1. \r\nTABLE
    154. SAUDI ARABIA DIPHENYLAMINE (DPA) MARKET, BY APPLICATION, 2023-2032 (USD BILLION)
      1. 124
    155. \r\nTABLE 166 SAUDI ARABIA DIPHENYLAMINE (DPA) MARKET, BY APPLICATION,
      1. \r\nTABLE 167 SAUDI ARABIA DIPHENYLAMINE (DPA) MARKET,
      2. BY END USE, 2023-2032 (USD BILLION) 125
      3. \r\nTABLE 168 SAUDI ARABIA DIPHENYLAMINE
    156. (DPA) MARKET, BY END USE, 2023-2032 (KILO TONS) 126
      1. \r\nTABLE 169 UAE DIPHENYLAMINE
    157. (DPA) MARKET, BY APPLICATION, 2023-2032 (USD BILLION) 126
      1. \r\nTABLE 170 UAE
    158. DIPHENYLAMINE (DPA) MARKET, BY APPLICATION, 2023-2032 (KILO TONS) 127
      1. \r\nTABLE
    159. UAE DIPHENYLAMINE (DPA) MARKET, BY END USE, 2023-2032 (USD BILLION) 127
      1. \r\nTABLE
    160. UAE DIPHENYLAMINE (DPA) MARKET, BY END USE, 2023-2032 (KILO TONS) 128
      1. \r\nTABLE
    161. REST OF MIDDLE EAST AND AFRICA DIPHENYLAMINE (DPA) MARKET, BY APPLICATION, 2023-2032
      1. (USD BILLION) 128
      2. \r\nTABLE 174 REST OF MIDDLE EAST AND AFRICA DIPHENYLAMINE
    162. (DPA) MARKET, BY APPLICATION, 2023-2032 (KILO TONS) 129
      1. \r\nTABLE 175 REST
    163. OF MIDDLE EAST AND AFRICA DIPHENYLAMINE (DPA) MARKET, BY END USE, 2023-2032 (USD
      1. BILLION) 129
      2. \r\nTABLE 176 REST OF MIDDLE EAST AND AFRICA DIPHENYLAMINE (DPA)
    164. MARKET, BY END USE, 2023-2032 (KILO TONS) 130
      1. \r\nTABLE 177 KEY DEVELOPMENTS
      2. 131
      3. \r\n 
      4. \r\n14 List Of Figures
      5. \r\nFIGURE 1 MARKET SYNOPSIS
      6. 17
      7. \r\nFIGURE 2 MARKET ATTRACTIVENESS ANALYSIS: GLOBAL DIPHENYLAMINE (DPA)
      8. MARKET 18
    165. \r\nFIGURE 3 GLOBAL DIPHENYLAMINE (DPA) MARKET ANALYSIS, BY APPLICATION
      1. 18
      2. \r\nFIGURE 4 GLOBAL DIPHENYLAMINE (DPA) MARKETANALYSIS, BY END USE 19
      3. \r\nFIGURE
    166. GLOBAL DIPHENYLAMINE (DPA) MARKET: MARKET STRUCTURE 20
      1. \r\nFIGURE 6 NORTH
    167. AMERICA DIPHENYLAMINE (DPA) MARKET, BY COUNTRY, (2020) 21
      1. \r\nFIGURE 7 EUROPE
    168. DIPHENYLAMINE (DPA) MARKET SHARE, BY COUNTRY, (2020) 22
      1. \r\nFIGURE 8 ASIA-PACIFIC
    169. DIPHENYLAMINE (DPA) MARKET SHARE, BY COUNTRY, (2020) 23
      1. \r\nFIGURE 9 LATIN
    170. AMERICA DIPHENYLAMINE (DPA) MARKET SHARE, BY COUNTRY, (2020) 23
      1. \r\nFIGURE
    171. THE MIDDLE EAST & AFRICA DIPHENYLAMINE (DPA) MARKET SHARE, BY COUNTRY, (2020)
      1. 24
      2. \r\nFIGURE 11 RESEARCH PROCESS OF MRFR 25
      3. \r\nFIGURE 12 TOP-DOWN
      4. & BOTTOM-UP APPROACH 28
      5. \r\nFIGURE 13 MARKET DYNAMICS: GLOBAL DIPHENYLAMINE
      6. (DPA) MARKET 30
      7. \r\nFIGURE 14 GLOBAL AUTOMOTIVE PRODUCTION (2020) 31
      8. \r\nFIGURE
    172. DRIVERS IMPACT ANALYSIS: GLOBAL DIPHENYLAMINE (DPA) MARKET 33
      1. \r\nFIGURE
    173. RESTRAINTS IMPACT ANALYSIS: GLOBAL DIPHENYLAMINE (DPA) MARKET 34
      1. \r\nFIGURE
    174. SUPPLY CHAIN ANALYSIS 35
      1. \r\nFIGURE 18 PORTER'S FIVE FORCES ANALYSIS OF
      2. THE GLOBAL DIPHENYLAMINE (DPA) MARKET 37
      3. \r\nFIGURE 19 GLOBAL DIPHENYLAMINE
    175. (DPA) MARKET, BY APPLICATION, 2023-2032 (USD BILLION) 41
      1. \r\nFIGURE 20 GLOBAL
    176. DIPHENYLAMINE (DPA) MARKET, BY APPLICATION, 2023-2032 (KILO TONS) 42
      1. \r\nFIGURE
    177. GLOBAL DIPHENYLAMINE (DPA) MARKET, BY END USE, 2023-2032 (USD BILLION) 47
      1. \r\nFIGURE
    178. GLOBAL DIPHENYLAMINE (DPA) MARKET, BY END USE, 2023-2032 (KILO TONS) 48
      1. \r\nFIGURE
    179. GLOBAL DIPHENYLAMINE (DPA) MARKET, BY REGION, 2023-2032 (USD BILLION) 55
      1. \r\nFIGURE
    180. GLOBAL DIPHENYLAMINE (DPA) MARKETBY REGION, 2023-2032 (KILO TONS) 56
    Diphenylamine (DPA) Market Segmentation

    Diphenylamine (DPA) Market Application Outlook (USD Billion, 2018-2032)

    • Chemical Intermediates
    • Antioxidants
    • Fungicides
    • Others

    Diphenylamine (DPA) Market End-Use Industry Outlook (USD Billion, 2018-2032)

    • Personal Care
    • Automotive And Agriculture
    • Cosmetics
    • Rubber
    • Plastics Industry

    Diphenylamine (DPA) Market Regional Outlook (USD Billion, 2018-2032)

    • North America Outlook (USD Billion, 2018-2032)

      • North America Diphenylamine (DPA) Market by Application
        • Chemical Intermediates
        • Antioxidants
        • Fungicides
        • Others.
      • North America Diphenylamine (DPA) Market by End-Use Industry
        • Personal Care
        • Automotive And Agriculture
        • Cosmetics
        • Rubber
        • Plastics Industry
      • US Outlook (USD Billion, 2018-2032)

      • US Diphenylamine (DPA) Market by Application
        • Chemical Intermediates
        • Antioxidants
        • Fungicides
        • Others.
      • US Diphenylamine (DPA) Market by End-Use Industry
        • Personal Care
        • Automotive And Agriculture
        • Cosmetics
        • Rubber
        • Plastics Industry
      • CANADA Outlook (USD Billion, 2018-2032)

      • CANADA Diphenylamine (DPA) Market by Application
        • Chemical Intermediates
        • Antioxidants
        • Fungicides
        • Others.
      • CANADA Diphenylamine (DPA) Market by End-Use Industry
        • Personal Care
        • Automotive And Agriculture
        • Cosmetics
        • Rubber
        • Plastics Industry
    • Europe Outlook (USD Billion, 2018-2032)

      • Europe Diphenylamine (DPA) Market by Application
        • Chemical Intermediates
        • Antioxidants
        • Fungicides
        • Others.
      • Europe Diphenylamine (DPA) Market by End-Use Industry
        • Personal Care
        • Automotive And Agriculture
        • Cosmetics
        • Rubber
        • Plastics Industry
      • Germany Outlook (USD Billion, 2018-2032)

      • Germany Diphenylamine (DPA) Market by Application
        • Chemical Intermediates
        • Antioxidants
        • Fungicides
        • Others.
      • Germany Diphenylamine (DPA) Market by End-Use Industry
        • Personal Care
        • Automotive And Agriculture
        • Cosmetics
        • Rubber
        • Plastics Industry
      • France Outlook (USD Billion, 2018-2032)

      • France Diphenylamine (DPA) Market by Application
        • Chemical Intermediates
        • Antioxidants
        • Fungicides
        • Others.
      • France Diphenylamine (DPA) Market by End-Use Industry
        • Personal Care
        • Automotive And Agriculture
        • Cosmetics
        • Rubber
        • Plastics Industry
      • UK Outlook (USD Billion, 2018-2032)

      • UK Diphenylamine (DPA) Market by Application
        • Chemical Intermediates
        • Antioxidants
        • Fungicides
        • Others.
      • UK Diphenylamine (DPA) Market by End-Use Industry
        • Personal Care
        • Automotive And Agriculture
        • Cosmetics
        • Rubber
        • Plastics Industry
      • ITALY Outlook (USD Billion, 2018-2032)

      • ITALY Diphenylamine (DPA) Market by Application
        • Chemical Intermediates
        • Antioxidants
        • Fungicides
        • Others.
      • ITALY Diphenylamine (DPA) Market by End-Use Industry
        • Personal Care
        • Automotive And Agriculture
        • Cosmetics
        • Rubber
        • Plastics Industry
      • SPAIN Outlook (USD Billion, 2018-2032)

      • Spain Diphenylamine (DPA) Market by Application
        • Chemical Intermediates
        • Antioxidants
        • Fungicides
        • Others.
      • Spain Diphenylamine (DPA) Market by End-Use Industry
        • Personal Care
        • Automotive And Agriculture
        • Cosmetics
        • Rubber
        • Plastics Industry
      • Rest Of Europe Outlook (USD Billion, 2018-2032)

      • Rest Of Europe Diphenylamine (DPA) Market by Application
        • Chemical Intermediates
        • Antioxidants
        • Fungicides
        • Others.
      • REST OF EUROPE Diphenylamine (DPA) Market by End-Use Industry
        • Personal Care
        • Automotive And Agriculture
        • Cosmetics
        • Rubber
        • Plastics Industry
    • Asia-Pacific Outlook (USD Billion, 2018-2032)

      • Asia-Pacific Diphenylamine (DPA) Market by Application
        • Chemical Intermediates
        • Antioxidants
        • Fungicides
        • Others.
      • Asia-Pacific Diphenylamine (DPA) Market by End-Use Industry
        • Personal Care
        • Automotive And Agriculture
        • Cosmetics
        • Rubber
        • Plastics Industry
      • China Outlook (USD Billion, 2018-2032)

      • China Diphenylamine (DPA) Market by Application
        • Chemical Intermediates
        • Antioxidants
        • Fungicides
        • Others.
      • China Diphenylamine (DPA) Market by End-Use Industry
        • Personal Care
        • Automotive And Agriculture
        • Cosmetics
        • Rubber
        • Plastics Industry
      • Japan Outlook (USD Billion, 2018-2032)

      • Japan Diphenylamine (DPA) Market by Application
        • Chemical Intermediates
        • Antioxidants
        • Fungicides
        • Others.
    • Japan Diphenylamine (DPA) Market by End-Use Industry
        • Personal Care
        • Automotive And Agriculture
        • Cosmetics
        • Rubber
        • Plastics Industry
      • India Outlook (USD Billion, 2018-2032)

      • India Diphenylamine (DPA) Market by Application
        • Chemical Intermediates
        • Antioxidants
        • Fungicides
        • Others.
      • India Diphenylamine (DPA) Market by End-Use Industry
        • Personal Care
        • Automotive And Agriculture
        • Cosmetics
        • Rubber
        • Plastics Industry
      • Australia Outlook (USD Billion, 2018-2032)

      • Australia Diphenylamine (DPA) Market by Application
        • Chemical Intermediates
        • Antioxidants
        • Fungicides
        • Others.
      • Australia Diphenylamine (DPA) Market by End-Use Industry
        • Personal Care
        • Automotive And Agriculture
        • Cosmetics
        • Rubber
        • Plastics Industry
      • Rest of Asia-Pacific Outlook (USD Billion, 2018-2032)

      • Rest of Asia-Pacific Diphenylamine (DPA) Market by Application
        • Chemical Intermediates
        • Antioxidants
        • Fungicides
        • Others.
      • Rest of Asia-Pacific Diphenylamine (DPA) Market by End-Use Industry
        • Personal Care
        • Automotive And Agriculture
        • Cosmetics
        • Rubber
        • Plastics Industry
    • Rest of the World Outlook (USD Billion, 2018-2032)

      • Rest of the World Diphenylamine (DPA) Market by Application
        • Chemical Intermediates
        • Antioxidants
        • Fungicides
        • Others.
      • Rest of the World Diphenylamine (DPA) Market by End-Use Industry
        • Personal Care
        • Automotive And Agriculture
        • Cosmetics
        • Rubber
        • Plastics Industry
      • Middle East Outlook (USD Billion, 2018-2032)

      • Middle East Diphenylamine (DPA) Market by Application
        • Chemical Intermediates
        • Antioxidants
        • Fungicides
        • Others.
      • Middle East Diphenylamine (DPA) Market by End-Use Industry
        • Personal Care
        • Automotive And Agriculture
        • Cosmetics
        • Rubber
        • Plastics Industry
      • Africa Outlook (USD Billion, 2018-2032)

      • Africa Diphenylamine (DPA) Market by Application
        • Chemical Intermediates
        • Antioxidants
        • Fungicides
        • Others.
      • Africa Diphenylamine (DPA) Market by End-Use Industry
        • Personal Care
        • Automotive And Agriculture
        • Cosmetics
        • Rubber
        • Plastics Industry
      • Latin America Outlook (USD Billion, 2018-2032)

      • Latin America Diphenylamine (DPA) Market by Application
        • Chemical Intermediates
        • Antioxidants
        • Fungicides
        • Others.
      • Latin America s by End-Use Industry
        • Personal Care
        • Automotive And Agriculture
        • Cosmetics
        • Rubber
        • Plastics Industry
    Infographic

    Free Sample Request

    Kindly complete the form below to receive a free sample of this Report

    Get Free Sample

    Customer Strories

    “I am very pleased with how market segments have been defined in a relevant way for my purposes (such as "Portable Freezers & refrigerators" and "last-mile"). In general the report is well structured. Thanks very much for your efforts.”

    Victoria Milne

    Founder
    Case Study
    Chemicals and Materials

    Compare Licence

    ×
    Features License Type
    Single User Multiuser License Enterprise User
    Price $4,950 $5,950 $7,250
    Maximum User Access Limit 1 User Upto 10 Users Unrestricted Access Throughout the Organization
    Free Customization
    Direct Access to Analyst
    Deliverable Format
    Platform Access
    Discount on Next Purchase 10% 15% 15%
    Printable Versions