Chemicals and Materials Market Segmentation
Chemicals and Materials By Application (USD Billion, 2025-2035)
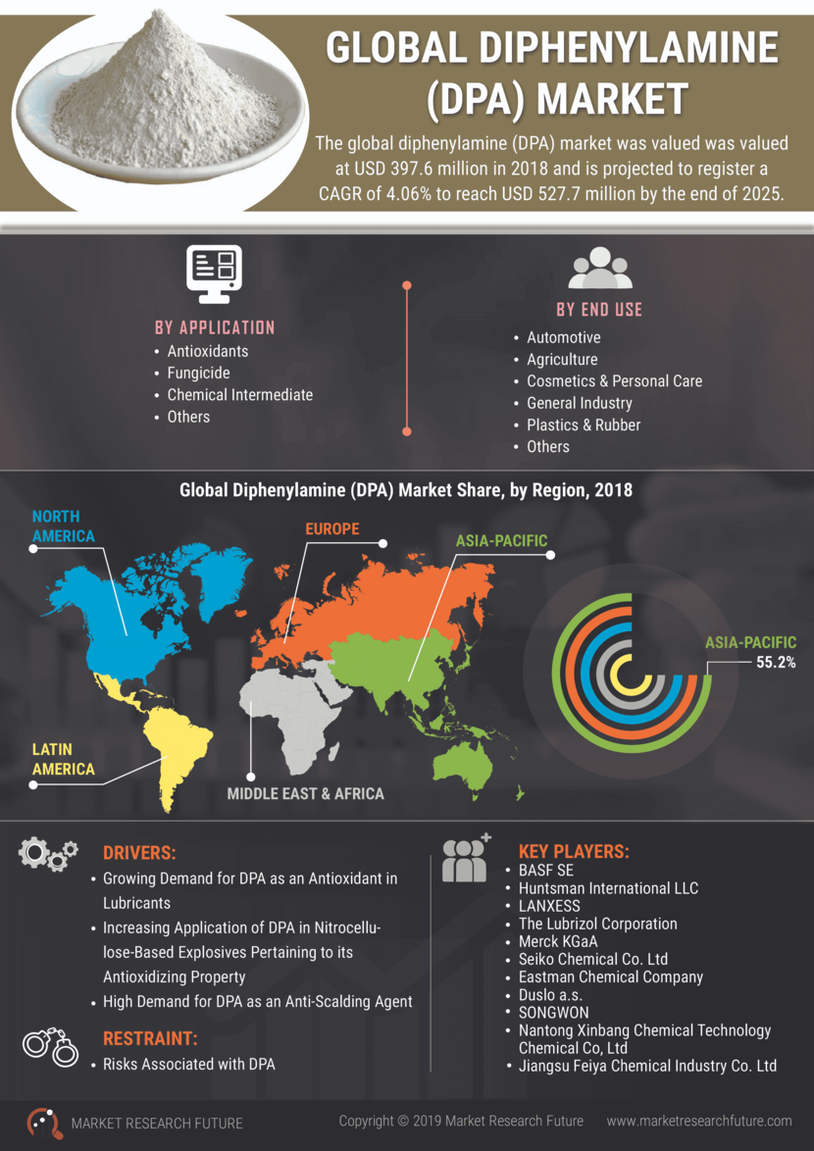
- Chemical Intermediates
- Antioxidants
- Fungicides
- Others
Chemicals and Materials By End-Use Industry (USD Billion, 2025-2035)
- Personal Care
- Automotive and Agriculture
- Cosmetics
- Rubber
- Plastics Industry