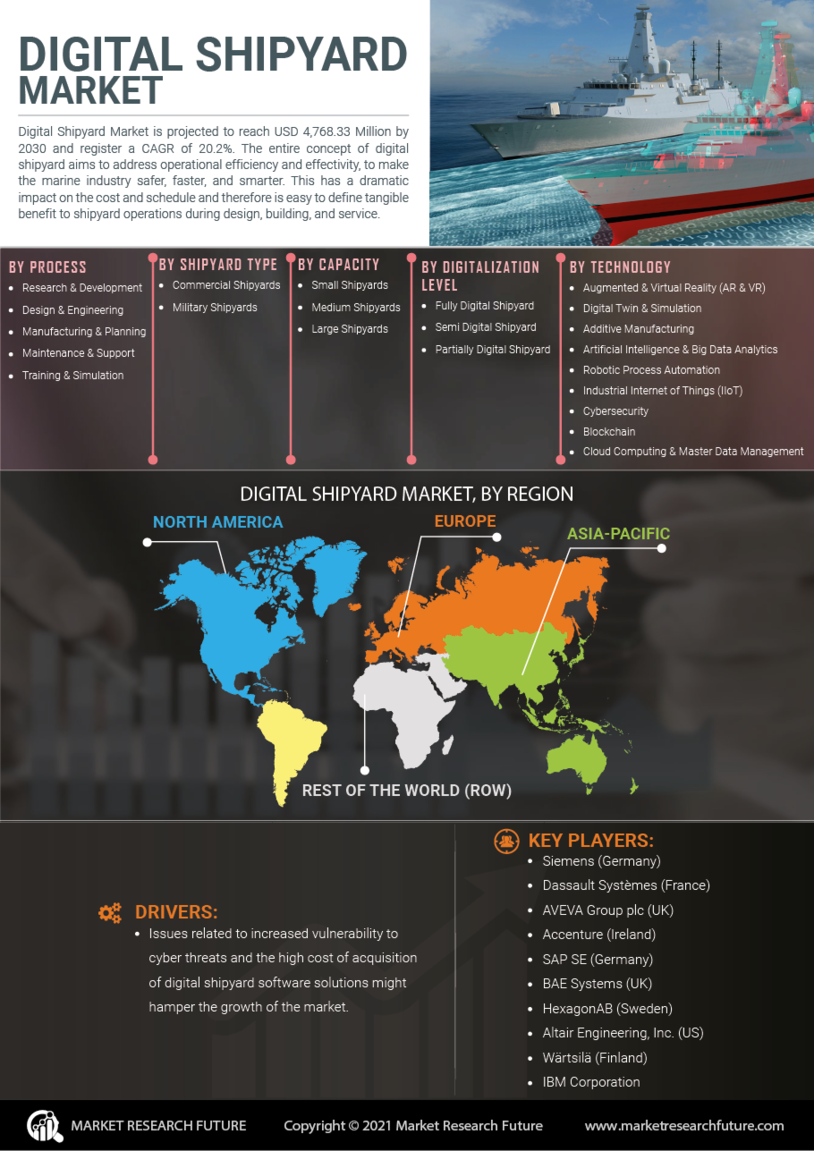
Certified Global Research Member
Isomar fd.webp Wcrc 57.webp
Key Questions Answered
  • Global Market Outlook
  • In-depth analysis of global and regional trends
  • Analyze and identify the major players in the market, their market share, key developments, etc.
  • To understand the capability of the major players based on products offered, financials, and strategies.
  • Identify disrupting products, companies, and trends.
  • To identify opportunities in the market.
  • Analyze the key challenges in the market.
  • Analyze the regional penetration of players, products, and services in the market.
  • Comparison of major players’ financial performance.
  • Evaluate strategies adopted by major players.
  • Recommendations
Why Choose Market Research Future?
  • Vigorous research methodologies for specific market.
  • Knowledge partners across the globe
  • Large network of partner consultants.
  • Ever-increasing/ Escalating data base with quarterly monitoring of various markets
  • Trusted by fortune 500 companies/startups/ universities/organizations
  • Large database of 5000+ markets reports.
  • Effective and prompt pre- and post-sales support.

Digital Shipyard Market Research Report Information by Process (Research & Development, Design & Engineering, Manufacturing & Planning, Maintenance & Support and Training & Simulation), Shipyard Type (Commercial Shipyards and Military Shipyards), Capacity (Small Shipyards, Medium Shipyards and Large Shipyards), Digitalization Level (Fully Digital Shipyard, Semi Digital Shipyard and Partially Digital Shipyard), Technology (Augmented & Virtual Reality (AR & VR),End-Use - Forecast 2030


ID: MRFR/A&D/8154-HCR | 168 Pages | Author: Swapnil Palwe| April 2024

Research Methodology on Digital Shipyard Market


Research Aim:


To investigate the potential of the Digital Shipyard Market in the global maritime industry and assess its future outlook based on various factors such as development in technology, market trends, and competitive landscape.


Research Objectives:


  • To identify and analyze the factors influencing the Digital Shipyard Market growth.

  • To assess the market size in terms of value and volume.

  • To provide insights into competitive dynamics and key players operating in the Digital Shipyard Market.

  • To analyze the current and changing economic, regulatory, and technological context of the Digital Shipyard Market.


Research Methodology


The research investigating the potential of the Digital Shipyard Market globally is undertaken in two phases. The first phase entailed the collection of primary and secondary data from various sources, followed by the analysis of the data. The sources of information collected for this research were literature reviews, academic papers, statistical reports, expert opinions and interviews, market sizes, and projections. The analysis is undertaken using a combination of segmental analysis, market sizing, and market forecasting techniques to provide insights into the structure, development, size and value of the Digital Shipyard Market.


Phase I: Desk Research


Comprehensive desk research is conducted during Phase I of this research to gain insights into the potential of the Digital Shipyard Market. The desk research includes literature reviews of academic papers and other research studies, market surveys, competitor intelligence, and in-depth interviews with experts managing and supervising the development of the Digital Shipyard Market.


Phase II: Quantitative Research


The quantitative research is conducted during the second phase of this research project to collect reliable and accurate data to understand and evaluate the potential of the Digital Shipyard Market. This research method included the inquisition of primary and secondary data from a number of sources, both internal and external. The sources of data used for this research include statistical reports from the International Maritime Organization (IMO), the UN Conference on Trade and Development (UNCTAD), and other prominent organizations involved in maritime commerce; online and offline surveys; and interviews conducted with industry experts.


Data Collection


The primary sources of data for this research were online and offline surveys and in-depth interviews conducted with subject-matter experts managing and supervising the development of the Digital Shipyard Market. Secondary source data which included market surveys, government and non-government publications, press and media releases, and peer-reviewed journals were also referenced.


Data Analysis


Once all the primary and secondary data is collected, it is then carefully analyzed and tabulated. The analysis is undertaken using a combination of segmental analysis, market sizing, and market forecasting techniques to provide insights into the structure, development, size and value of the Digital Shipyard Market. After the analysis is completed, estimated market size and value were arrived at for the Digital Shipyard Market. The results were then compared to existing research and market trends to validate assumptions and conclusions.


Conclusion


The Digital Shipyard Market is expected to see substantial growth from 2023 to 2030 as commercial ships become increasingly connected and automated, resulting in the rise of digital shipyard technology. The market is likely to be driven by factors such as increasing investment in digital infrastructure, development in navigation and communication technology, and growing demand for automation, among others. The report provides an in-depth view of the Digital Shipyard Market, covering the development of the market, its current status and future outlook, market drivers and constraints, key players and market size and value.

Leading companies partner with us for data-driven Insights
client_1 client_2 client_3 client_4 client_5 client_6 client_7 client_8 client_9 client_10
Please fill in Business Email for Quick Response

Table of Contents

1. Executive Summary

1.1. Market Attractiveness Analysis

1.1.1. Global Digital Shipyard Market, by Process

1.1.2. Global Digital Shipyard Market, by Shipyard Type

1.1.3. Global Digital Shipyard Market, by Capacity

1.1.4. Global Digital Shipyard Market, by Digitalization Level

1.1.5. Global Digital Shipyard Market, by Technology

1.1.6. Global Digital Shipyard Market, by End Use

1.1.7. Global Digital Shipyard Market, by Region

2. Market Introduction

2.1. Market Definition

2.2. Scope of the Study

2.3. Market Structure

2.4. Key Buying Criteria

2.5. Market Factor Indicator Analysis

3. Research Methodology

3.1. Research Process

3.2. Primary Research

3.3. Secondary Research

3.4. Market Size Estimation

3.5. Product Model

3.6. List of Assumptions

4. Market Insights

5. Market Dynamics

5.1. Introduction

5.2. Drivers

5.2.1. Rise in Adoption of Digital Twin in Shipbuilding Industry

5.2.2. Rise in International Seaborne Trade

5.2.3. Increasing Procurement of Advanced Vessels by Navies Across the World

5.2.4. Drivers Impact Analysis

5.3. Restraints

5.3.1. Issues Related to Cyber Threats

5.3.2. High Cost of Acquisition

5.3.3. Restraints Impact Analysis

5.4. Opportunities

5.5. Market/Technological Trends

5.6. Patent Trends

5.7. Regulatory Landscape/Standards

6. Market Factor Analysis

6.1. Supply Chain Analysis

6.1.1. R&D

6.1.2. Manufacturing

6.1.3. Distribution & Sales

6.1.4. Post-Sales Monitoring

6.2. Porter’s Five Forces Analysis

6.2.1. Threat of New Entrants

6.2.2. Bargaining Power of Suppliers

6.2.3. Bargaining Power of Buyers

6.2.4. Threat of Substitutes

6.2.5. Rivalry

7. Global Digital Shipyard Market, by Process

7.1. Introduction

7.2. Research & Development

7.3. Design & Engineering

7.4. Manufacturing & Planning

7.5. Maintenance & Support

7.6. Training & Simulation

8. Global Digital Shipyard Market, by Shipyard Type

8.1. Introduction

8.2. Commercial Shipyards

8.3. Military Shipyards

9. Global Digital Shipyard Market, by Capacity

9.1. Introduction

9.2. Small Shipyards

9.3. Medium Shipyards

9.4. Large Shipyards

10. Global Digital Shipyard Market, by Digitalization Level

10.1. Introduction

10.2. Fully Digital Shipyard

10.3. Semi Digital Shipyard

10.4. Partially Digital Shipyard

11. Global Digital Shipyard Market, by Technology

11.1. Introduction

11.2. Augmented & Virtual Reality (AR & VR)

11.3. Digital Twin & Simulation

11.4. Additive Manufacturing

11.5. Artificial Intelligence & Big Data Analytics

11.6. Robotic Process Automation

11.7. Industrial Internet of Things (IIoT)

11.8. Cybersecurity

11.9. Blockchain

11.10. Cloud Computing & Master Data Management

12. Global Digital Shipyard Market, by End Use

12.1. Introduction

12.2. Implementation

12.3. Upgrades & Services

13. Global Digital Shipyard Market, by Region

13.1. Introduction

13.2. North America

13.2.1. US

13.2.2. Canada

13.3. Europe

13.3.1. UK

13.3.2. Germany

13.3.3. France

13.3.4. Russia

13.3.5. Netherlands

13.3.6. Rest of Europe

13.4. Asia-Pacific

13.4.1. China

13.4.2. India

13.4.3. Japan

13.4.4. South Korea

13.4.5. Rest of Asia-Pacific

13.5. Middle East

13.5.1. UAE

13.5.2. Saudi Arabia

13.5.3. Israel

13.5.4. Rest of the Middle East

13.6. Rest of the World

13.6.1. Latin America

13.6.2. Africa

14. Competitive Landscape

14.1. Competitive Overview

14.2. Competitor Dashboard

14.3. Major Growth Strategies in the Global Digital Shipyard Market

14.4. Competitive Benchmarking

14.5. Market Share Analysis

14.6. Leading Player in Terms of Number of Developments in the Global Digital Shipyard Market

14.7. Key Developments & Growth Strategies

14.7.1. Product Launches/Service Deployments

14.7.2. Mergers & Acquisitions

14.7.3. Joint Ventures

15. Company Profiles

15.1. Key Market Players

(Company overview, products & services offered, financial overview, key developments, SWOT analysis, and key strategies to be covered for public companies)

15.2. Siemens

15.3. Dassault Systèmes

15.4. AVEVA Group plc

15.5. Accenture

15.6. SAP SE

15.7. BAE Systems

15.8. Hexagon AB

15.9. Altair Engineering, Inc.

15.10. Wärtsilä

15.11. IBM Corporation

16. Other Prominent Players

16.1. Inmarsat Plc

16.2. IFS AB

16.3. Pemamek Ltd.

16.4. Aras Corporation

16.5. Kreyon Systems Pvt. Ltd

16.6. KUKA AG

16.7. iBASEt

16.8. PROSTEP Inc.

16.9. KRANENDONK Smart robotics

16.10. Damen Shipyards Group

16.11. Navantia

17. Appendix

17.1. References

17.2. Related Reports

17.3. List of Abbreviations

List of Tables

TABLE 1 List of Assumptions

TABLE 2 Major Patents Granted for Digital Shipyard (2014–2020)

TABLE 3 Global Digital Shipyard Market, by Process, 2020–2030 (USD Million)

TABLE 4 Global Digital Shipyard Market, by Capacity, 2020–2030(USD Million)

TABLE 5 Global Digital Shipyard Market, by Digitalization Level, 2020–2030 (USD Million)

TABLE 6 Global Digital Shipyard Market, By Shipyard Type, 2020–2030 (USD Million)

TABLE 7 Global Digital Shipyard Market, by Technology, 2020–2030 (USD Million)

TABLE 8 Global Digital Shipyard Market, by End Use, 2020–2030 (USD Million)

TABLE 9 Global Digital Shipyard Market, by Region, 2020–2030 (USD Million)

TABLE 10 North America: Digital Shipyard Market, by Country, 2020–2030(USD Million)

TABLE 11 North America: Digital Shipyard Market, by Process, 2020–2030 (USD Million)

TABLE 12 North America: Digital Shipyard Market, by Capacity, 2020–2030 (USD Million)

TABLE 13 North America: Digital Shipyard Market, by Digitalization Level, 2020–2030 (USD Million)

TABLE 14 North America: Digital Shipyard Market, By Shipyard Type, 2020–2030 (USD Million)

TABLE 15 North America: Digital Shipyard Market, by Technology, 2020–2030(USD Million)

TABLE 16 North America: Digital Shipyard Market, by End Use, 2020–2030(USD Million)

TABLE 17 US: Digital Shipyard Market, by Process, 2020–2030 (USD Million)

TABLE 18 US: Digital Shipyard Market, by Capacity, 2020–2030 (USD Million)

TABLE 19 US: Digital Shipyard Market, by Digitalization Level, 2020–2030 (USD Million)

TABLE 20 US: Digital Shipyard Market, by Shipyard Type, 2020–2030 (USD Million)

TABLE 21 US: Digital Shipyard Market, by Technology, 2020–2030 (USD Million)

TABLE 22 US: Digital Shipyard Market, by End Use, 2020–2030 (USD Million)

TABLE 23 Canada: Digital Shipyard Market, by Process, 2020–2030 (USD Million)

TABLE 24 Canada: Digital Shipyard Market, by Capacity, 2020–2030 (USD Million)

TABLE 25 Canada: Digital Shipyard Market, by Digitalization Level, 2020–2030 (USD Million)

TABLE 26 Canada: Digital Shipyard Market, by Shipyard Type, 2020–2030 (USD Million)

TABLE 27 Canada: Digital Shipyard Market, by Technology, 2020–2030 (USD Million)

TABLE 28 Canada: Digital Shipyard Market, by End Use, 2020–2030 (USD Million)

TABLE 29 Europe: Digital Shipyard Market, by Country, 2020–2030 (USD Million)

TABLE 30 Europe: Digital Shipyard Market, by Process, 2020–2030 (USD Million)

TABLE 31 Europe: Digital Shipyard Market, by Capacity, 2020–2030 (USD Million)

TABLE 32 Europe: Digital Shipyard Market, by Digitalization Level, 2020–2030 (USD Million)

TABLE 33 Europe: Digital Shipyard Market, by Shipyard Type, 2020–2030 (USD Million)

TABLE 34 Europe: Digital Shipyard Market, by Technology, 2020–2030 (USD Million)

TABLE 35 Europe: Digital Shipyard Market, by End Use, 2020–2030 (USD Million)

TABLE 36 UK: Digital Shipyard Market, by Process, 2020–2030 (USD Million)

TABLE 37 UK: Digital Shipyard Market, by Capacity, 2020–2030 (USD Million)

TABLE 38 UK: Digital Shipyard Market, by Digitalization Level, 2020–2030 (USD Million)

TABLE 39 UK: Digital Shipyard Market, by Shipyard Type, 2020–2030 (USD Million)

TABLE 40 UK: Digital Shipyard Market, by Technology, 2020–2030 (USD Million)

TABLE 41 UK: Digital Shipyard Market, by End Use, 2020–2030 (USD Million)

TABLE 42 Germany: Digital Shipyard Market, by Process, 2020–2030 (USD Million)

TABLE 43 Germany: Digital Shipyard Market, by Capacity, 2020–2030 (USD Million)

TABLE 44 Germany: Digital Shipyard Market, by Digitalization Level, 2020–2030 (USD Million)

TABLE 45 Germany: Digital Shipyard Market, by Shipyard Type, 2020–2030 (USD Million)

TABLE 46 Germany: Digital Shipyard Market, by Technology, 2020–2030 (USD Million)

TABLE 47 Germany: Digital Shipyard Market, by End Use, 2020–2030 (USD Million)

TABLE 48 France: Digital Shipyard Market, by Process, 2020–2030 (USD Million)

TABLE 49 France: Digital Shipyard Market, by Capacity, 2020–2030 (USD Million)

TABLE 50 France: Digital Shipyard Market, by Digitalization Level, 2020–2030 (USD Million)

TABLE 51 France: Digital Shipyard Market, by Shipyard Type, 2020–2030 (USD Million)

TABLE 52 France: Digital Shipyard Market, by Technology, 2020–2030 (USD Million)

TABLE 53 France: Digital Shipyard Market, by End Use, 2020–2030 (USD Million)

TABLE 54 Russia: Digital Shipyard Market, by Process, 2020–2030 (USD Million)

TABLE 55 Russia: Digital Shipyard Market, by Capacity, 2020–2030 (USD Million)

TABLE 56 Russia: Digital Shipyard Market, by Digitalization Level, 2020–2030 (USD Million)

TABLE 57 Russia: Digital Shipyard Market, by Shipyard Type, 2020–2030 (USD Million)

TABLE 58 Russia: Digital Shipyard Market, by Technology, 2020–2030 (USD Million)

TABLE 59 Russia: Digital Shipyard Market, by End Use, 2020–2030 (USD Million)

TABLE 60 Netherlands: Digital Shipyard Market, by Process, 2020–2030 (USD Million)

TABLE 61 Netherlands: Digital Shipyard Market, by Capacity, 2020–2030 (USD Million)

TABLE 62 Netherlands: Digital Shipyard Market, by Digitalization Level, 2020–2030 (USD Million)

TABLE 63 Netherlands: Digital Shipyard Market, by Shipyard Type, 2020–2030 (USD Million)

TABLE 64 Netherlands: Digital Shipyard Market, by Technology, 2020–2030 (USD Million)

TABLE 65 Netherlands: Digital Shipyard Market, by End Use, 2020–2030 (USD Million)

TABLE 66 Rest of Europe: Digital Shipyard Market, by Process, 2020–2030 (USD Million)

TABLE 67 Rest of Europe: Digital Shipyard Market, by Capacity, 2020–2030 (USD Million)

TABLE 68 Rest of Europe: Digital Shipyard Market, by Digitalization Level, 2020–2030 (USD Million)

TABLE 69 Rest of Europe: Digital Shipyard Market, by Shipyard Type, 2020–2030 (USD Million)

TABLE 70 Rest of Europe: Digital Shipyard Market, by Technology, 2020–2030 (USD Million)

TABLE 71 Rest of Europe: Digital Shipyard Market, by End Use, 2020–2030 (USD Million)

TABLE 72 Asia-Pacific: Digital Shipyard Market, by Country, 2020–2030 (USD Million)

TABLE 73 Asia-Pacific: Digital Shipyard Market, by Process, 2020–2030 (USD Million)

TABLE 74 Asia-Pacific: Digital Shipyard Market, by Capacity, 2020–2030 (USD Million)

TABLE 75 Asia-Pacific: Digital Shipyard Market, by Digitalization Level, 2020–2030 (USD Million)

TABLE 76 Asia-Pacific: Digital Shipyard Market, by Shipyard Type, 2020–2030 (USD Million)

TABLE 77 Asia-Pacific: Digital Shipyard Market, by Technology, 2020–2030 (USD Million)

TABLE 78 Asia-Pacific: Digital Shipyard Market, by End Use, 2020–2030 (USD Million)

TABLE 79 China: Digital Shipyard Market, by Process, 2020–2030 (USD Million)

TABLE 80 China: Digital Shipyard Market, by Capacity, 2020–2030 (USD Million)

TABLE 81 China: Digital Shipyard Market, by Digitalization Level, 2020–2030 (USD Million)

TABLE 82 China: Digital Shipyard Market, by Shipyard Type, 2020–2030 (USD Million)

TABLE 83 China: Digital Shipyard Market, by Technology, 2020–2030 (USD Million)

TABLE 84 China: Digital Shipyard Market, by End Use, 2020–2030 (USD Million)

TABLE 85 India: Digital Shipyard Market, by Process, 2020–2030 (USD Million)

TABLE 86 India: Digital Shipyard Market, by Capacity, 2020–2030 (USD Million)

TABLE 87 India: Digital Shipyard Market, by Digitalization Level, 2020–2030 (USD Million)

TABLE 88 India: Digital Shipyard Market, by Shipyard Type, 2020–2030 (USD Million)

TABLE 89 India: Digital Shipyard Market, by Technology, 2020–2030 (USD Million)

TABLE 90 India: Digital Shipyard Market, by End Use, 2020–2030 (USD Million)

TABLE 91 Japan: Digital Shipyard Market, by Process, 2020–2030 (USD Million)

TABLE 92 Japan: Digital Shipyard Market, by Capacity, 2020–2030 (USD Million)

TABLE 93 Japan: Digital Shipyard Market, by Digitalization Level, 2020–2030 (USD Million)

TABLE 94 Japan: Digital Shipyard Market, by Shipyard Type, 2020–2030 (USD Million)

TABLE 95 Japan: Digital Shipyard Market, by Technology, 2020–2030 (USD Million)

TABLE 96 Japan: Digital Shipyard Market, by End Use, 2020–2030 (USD Million)

TABLE 97 South Korea: Digital Shipyard Market, by Process, 2020–2030 (USD Million)

TABLE 98 South Korea: Digital Shipyard Market, by Capacity, 2020–2030 (USD Million)

TABLE 99 South Korea: Digital Shipyard Market, by Digitalization Level, 2020–2030 (USD Million)

TABLE 100 South Korea: Digital Shipyard Market, by Shipyard Type, 2020–2030 (USD Million)

TABLE 101 South Korea: Digital Shipyard Market, by Technology, 2020–2030 (USD Million)

TABLE 102 South Korea: Digital Shipyard Market, by End Use, 2020–2030 (USD Million)

TABLE 103 Rest of Asia-Pacific: Digital Shipyard Market, by Process, 2020–2030 (USD Million)

TABLE 104 Rest of Asia-Pacific: Digital Shipyard Market, by Capacity, 2020–2030 (USD Million)

TABLE 105 Rest of Asia-Pacific: Digital Shipyard Market, by Digitalization Level, 2020–2030 (USD Million)

TABLE 106 Rest of Asia-Pacific: Digital Shipyard Market, by Shipyard Type, 2020–2030 (USD Million)

TABLE 107 Rest of Asia-Pacific: Digital Shipyard Market, by Technology, 2020–2030 (USD Million)

TABLE 108 Rest of Asia-Pacific: Digital Shipyard Market, by End Use, 2020–2030 (USD Million)

TABLE 109 Middle East: Digital Shipyard Market, by Country, 2020–2030 (USD Million)

TABLE 110 Middle East: Digital Shipyard Market, by Process, 2020–2030 (USD Million)

TABLE 111 Middle East: Digital Shipyard Market, by Capacity, 2020–2030 (USD Million)

TABLE 112 Middle East: Digital Shipyard Market, by Digitalization Level, 2020–2030 (USD Million)

TABLE 113 Middle East: Digital Shipyard Market, by Shipyard Type, 2020–2030 (USD Million)

TABLE 114 Middle East: Digital Shipyard Market, by Technology, 2020–2030 (USD Million)

TABLE 115 Middle East: Digital Shipyard Market, by End Use, 2020–2030 (USD Million)

TABLE 116 UAE: Digital Shipyard Market, by Process, 2020–2030 (USD Million)

TABLE 117 UAE: Digital Shipyard Market, by Capacity, 2020–2030 (USD Million)

TABLE 118 UAE: Digital Shipyard Market, by Digitalization Level, 2020–2030 (USD Million)

TABLE 119 UAE: Digital Shipyard Market, by Shipyard Type, 2020–2030 (USD Million)

TABLE 120 UAE: Digital Shipyard Market, by Technology, 2020–2030 (USD Million)

TABLE 121 UAE: Digital Shipyard Market, by End Use, 2020–2030 (USD Million)

TABLE 122 Saudi Arabia: Digital Shipyard Market, by Process, 2020–2030 (USD Million)

TABLE 123 Saudi Arabia: Digital Shipyard Market, by Capacity, 2020–2030 (USD Million)

TABLE 124 Saudi Arabia: Digital Shipyard Market, by Digitalization Level, 2020–2030 (USD Million)

TABLE 125 Saudi Arabia: Digital Shipyard Market, by Shipyard Type, 2020–2030 (USD Million)

TABLE 126 Saudi Arabia: Digital Shipyard Market, by Technology, 2020–2030 (USD Million)

TABLE 127 Saudi Arabia: Digital Shipyard Market, by End Use, 2020–2030 (USD Million)

TABLE 128 Israel: Digital Shipyard Market, by Process, 2020–2030 (USD Million)

TABLE 129 Israel: Digital Shipyard Market, by Capacity, 2020–2030 (USD Million)

TABLE 130 Israel: Digital Shipyard Market, by Digitalization Level, 2020–2030 (USD Million)

TABLE 131 Israel: Digital Shipyard Market, by Shipyard Type, 2020–2030 (USD Million)

TABLE 132 Israel: Digital Shipyard Market, by Technology, 2020–2030 (USD Million)

TABLE 133 Israel: Digital Shipyard Market, by End Use, 2020–2030 (USD Million)

TABLE 134 Rest of the Middle East: Digital Shipyard Market, by Process, 2020–2030 (USD Million)

TABLE 135 Rest of the Middle East: Digital Shipyard Market, by Capacity, 2020–2030 (USD Million)

TABLE 136 Rest of the Middle East: Digital Shipyard Market, by Digitalization Level, 2020–2030 (USD Million)

TABLE 137 Rest of the Middle East: Digital Shipyard Market, by Shipyard Type, 2020–2030 (USD Million)

TABLE 138 Rest of the Middle East: Digital Shipyard Market, by Technology, 2020–2030 (USD Million)

TABLE 139 Rest of the Middle East: Digital Shipyard Market, by End Use, 2020–2030 (USD Million)

TABLE 140 Rest of the World: Digital Shipyard Market, by Region, 2020–2030 (USD Million)

TABLE 141 Rest of the World: Digital Shipyard Market, by Process, 2020–2030 (USD Million)

TABLE 142 Rest of the World: Digital Shipyard Market, by Capacity, 2020–2030 (USD Million)

TABLE 143 Rest of the World: Digital Shipyard Market, by Digitalization Level, 2020–2030 (USD Million)

TABLE 144 Rest of the World: Digital Shipyard Market, by Shipyard Type, 2020–2030 (USD Million)

TABLE 145 Rest of the World: Digital Shipyard Market, by Technology, 2020–2030 (USD Million)

TABLE 146 Rest of the World: Digital Shipyard Market, by End Use, 2020–2030 (USD Million)

TABLE 147 Latin America: Digital Shipyard Market, by Process, 2020–2030 (USD Million)

TABLE 148 Latin America: Digital Shipyard Market, by Capacity, 2020–2030 (USD Million)

TABLE 149 Latin America: Digital Shipyard Market, by Digitalization Level, 2020–2030 (USD Million)

TABLE 150 Latin America: Digital Shipyard Market, by Shipyard Type, 2020–2030 (USD Million)

TABLE 151 Latin America: Digital Shipyard Market, by Technology, 2020–2030 (USD Million)

TABLE 152 Latin America: Digital Shipyard Market, by End Use, 2020–2030 (USD Million)

TABLE 153 Africa: Digital Shipyard Market, by Process, 2020–2030 (USD Million)

TABLE 154 Africa: Digital Shipyard Market, by Capacity, 2020–2030 (USD Million)

TABLE 155 Africa: Digital Shipyard Market, by Digitalization Level, 2020–2030 (USD Million)

TABLE 156 Africa: Digital Shipyard Market, by Shipyard Type, 2020–2030 (USD Million)

TABLE 157 Africa: Digital Shipyard Market, by Technology, 2020–2030 (USD Million)

TABLE 158 Africa: Digital Shipyard Market, by End Use, 2020–2030 (USD Million)

TABLE 159 The Most Active Players in the Global Digital Shipyard Market

TABLE 160 Contracts & Agreements

TABLE 161 Mergers & Acquisitions

TABLE 162 Product/Service Developments

TABLE 163 Expansions & Investments

TABLE 164 Joint Ventures & Partnerships

List of Figures

Figure 1 Market Synopsis

Figure 2 Global Digital Shipyard Market: Market Attractiveness Analysis

Figure 3 Global Digital Shipyard Market Analysis, by Process

Figure 4 Global Digital Shipyard Market Analysis, by Capacity

Figure 5 Global Digital Shipyard Market Analysis, by Digitalization Level

Figure 6 Global Digital Shipyard Market Analysis, by Shipyard Type

Figure 7 Global Digital Shipyard Market Analysis, by Technology

Figure 8 Global Digital Shipyard Market Analysis, by End Use

Figure 9 Global Digital Shipyard Market Analysis, by Region

Figure 10 Global Digital Shipyard Market: Market Structure

Figure 11 Key Buying Criteria for Digital Shipyard Technologies

Figure 12 Research Process of MRFR

Figure 13 North America: Market Size & Market Share, by Country, 2020 vs 2030

Figure 14 Europe: Market Size & Market Share, by Country, 2020 vs 2030

Figure 15 Asia-Pacific: Market Size & Market Share, by Country, 2020 vs 2030

Figure 16 Middle East: Market Size & Market Share, by Country, 2020 vs 2030

Figure 17 Rest of the World: Market Size & Market Share, by Country, 2020 vs 2030

Figure 18 Market Dynamics Overview

Figure 19 Drivers Impact Analysis: Global Digital Shipyard Market

Figure 20 Restraints Impact Analysis: Global Digital Shipyard Market

Figure 21 Porter’s Five Forces Analysis of the Global Digital Shipyard Market

Figure 22 Supply Chain: Global Digital Shipyard Market

Figure 23 Global Digital Shipyard Market Share, by Process, 2020 (% Share)

Figure 24 Global Digital Shipyard Market Share, by Digitalization Level, 2020 (% Share)

Figure 25 Global Digital Shipyard Market Share, by Capacity, 2020 (% Share)

Figure 26 Global Digital Shipyard Market Share, by Shipyard Type, 2020 (% Share)

Figure 27 Global Digital Shipyard Market Share, by Technology, 2020 (% Share)

Figure 28 Global Digital Shipyard Market Share, by End Use, 2020 (% Share)

Figure 29 Global Digital Shipyard Market Share, by Region, 2020 (% Share)

Figure 30 North America: Digital Shipyard Market Share, by Country, 2020 (% Share)

Figure 31 Europe: Digital Shipyard Market Share, by Country, 2020 (% Share)

Figure 32 Asia-Pacific: Digital Shipyard Market Share, by Country, 2020 (% Share)

Figure 33 Middle East: Digital Shipyard Market Share, by Country, 2020 (% Share)

Figure 34 Rest of the World: Digital Shipyard Market Share, by Region, 2020 (% Share)

Figure 35 Competitor Dashboard: Global Digital Shipyard Market

Figure 36 Capital Market Ratio and Financial Matrix

Figure 37 Contracts & Agreements: The Major Strategy Adopted by Key Players in the Global Digital Shipyard Market

Figure 38 Benchmarking of Major Competitors

Figure 39 Major Service Providers Market Share Analysis, 2020

Purchase Option
Single User $ 4,950
Multiuser License $ 5,950
Enterprise User $ 7,250
Compare Licenses
Tailored for You
  • Dedicated Research on any specifics segment or region.
  • Focused Research on specific players in the market.
  • Custom Report based only on your requirements.
  • Flexibility to add or subtract any chapter in the study.
  • Historic data from 2014 and forecasts outlook till 2040.
  • Flexibility of providing data/insights in formats (PDF, PPT, Excel).
  • Provide cross segmentation in applicable scenario/markets.