Information and Communications Technology Market Segmentation
Information and Communications Technology By Component (USD Billion, 2025-2035)
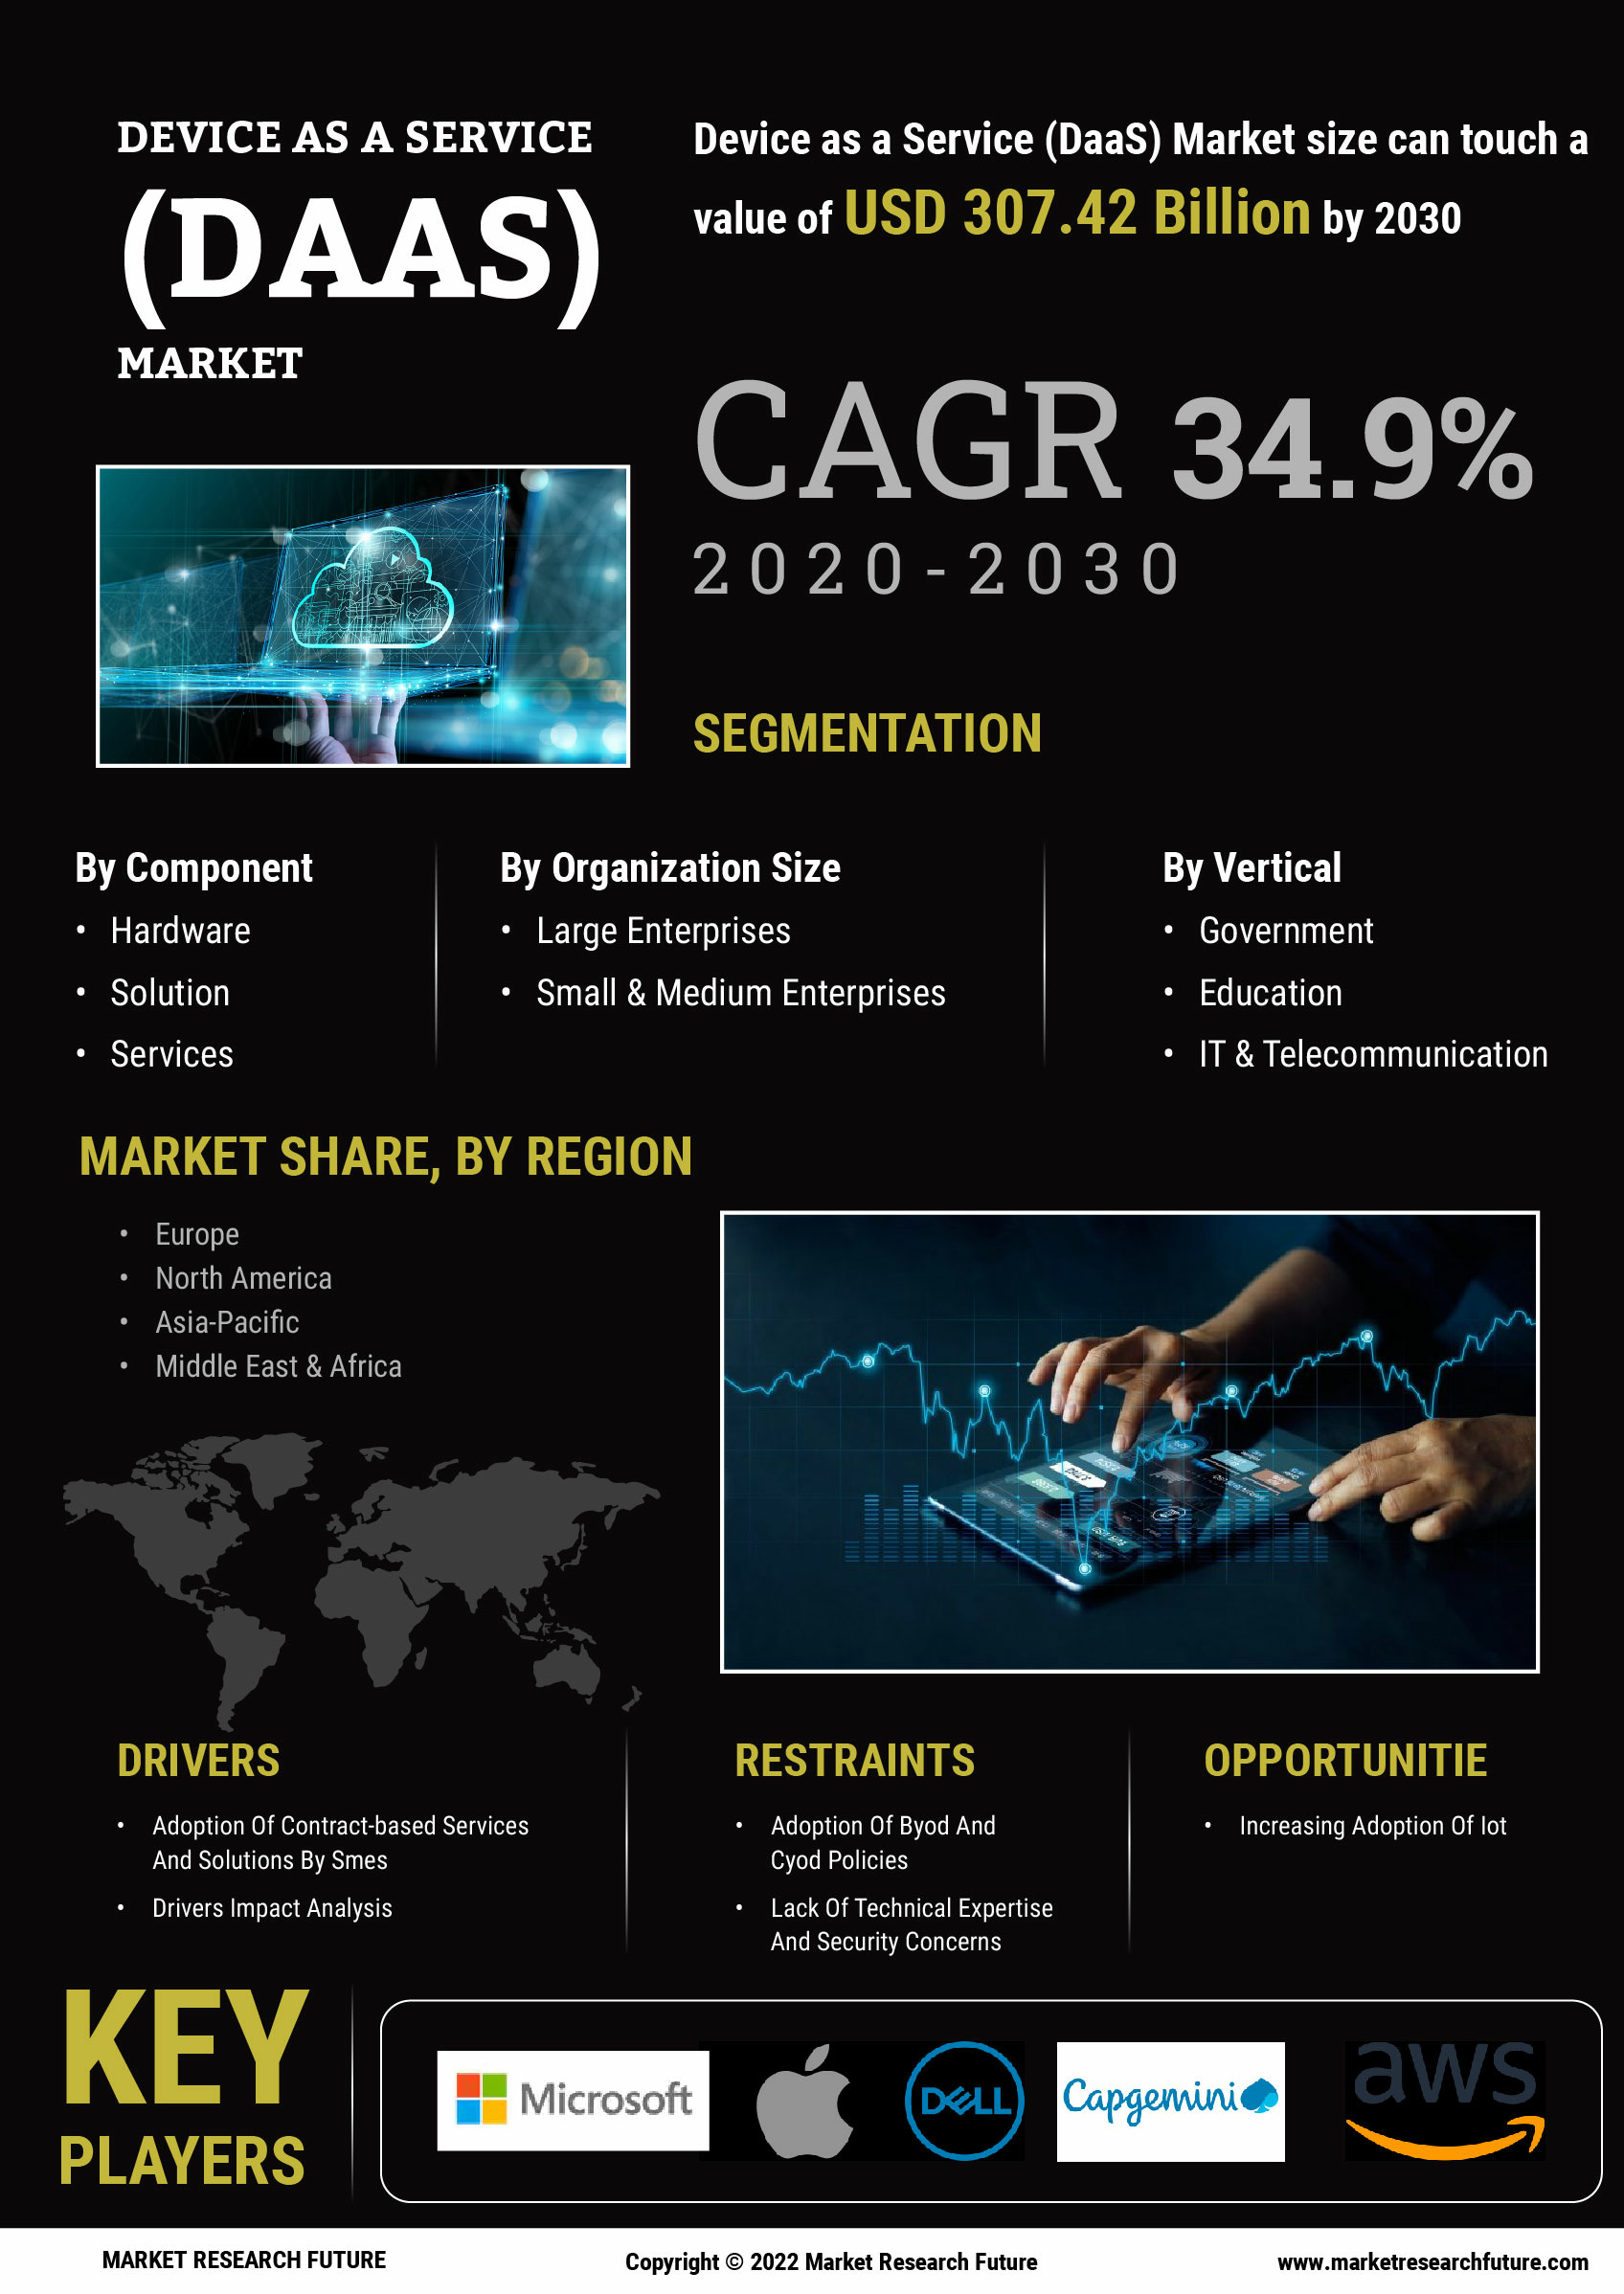
- Hardware
- Solution
- Device as a Service Markets
Information and Communications Technology By Organization Size (USD Billion, 2025-2035)
- SMEs
- Large Enterprises
Information and Communications Technology By Industry Vertical (USD Billion, 2025-2035)
- IT & Telecom
- BFSI
- Healthcare
- Retail
- Government
- Education
- Manufacturing
- Others