Dental Implants Market Summary
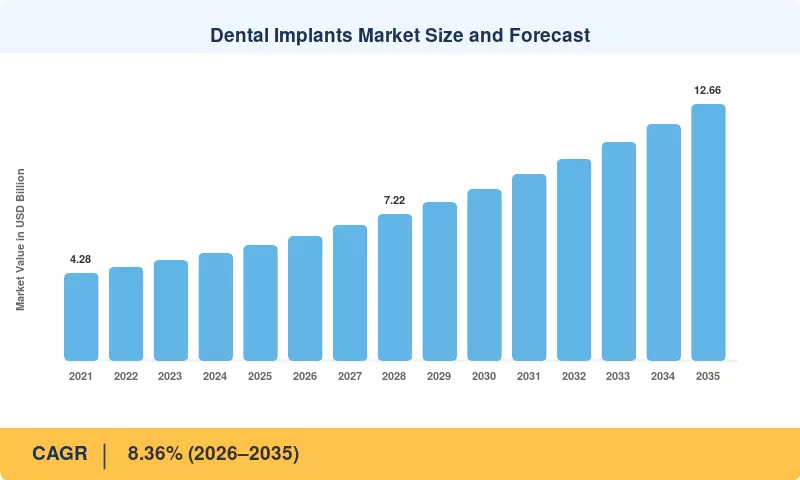
The Dental Implants Market was valued at USD 5.70 billion in 2025 and is projected to open the forecast period at USD 6.15 billion in 2026, reaching USD 12.66 billion by 2035 at a compound annual growth rate of 8.36% between 2026 and 2035. Two policy catalysts anchor this trajectory. South Korea's National Health Insurance Service extended partial implant coverage to beneficiaries aged 65 and above with a 30% patient copayment, converting a discretionary purchase into a subsidised one for roughly nine million citizens [3]. Germany's statutory fixed-subsidy structure for prosthetic dentures now channels public funds toward implant-retained restorations, lifting case volumes across Europe's largest dental economy [5].
Technology substitution is changing the way these devices reach patients. Intraoral scanners, five-axis milling and selective laser melting are replacing analog impression trays, stone models and courier-shipped casts, compressing a three-visit restorative sequence into one appointment. Between 2022 and 2025, investments of about USD 480 million by Straumann and Envista in digital workflow acquisitions and platform development, with centralized laboratories currently offering abutment tolerances within ±10 µm and a reduction in per-unit fabrication costs of approximately 30% [8][11]. This makes it easier for the average dentist to get involved, and that increases the number of clinicians who can place and restore fixtures.
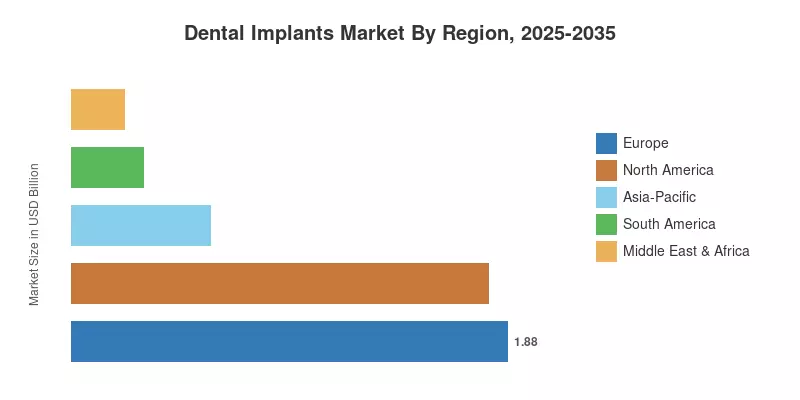
Europe retains 33.0% of the dental implants market in 2025, due to the deepest reimbursement architecture and highest implants-per-capita placement rate in the world. The fastest-expanding region is Asia-Pacific with a 10.60% CAGR through 2035, driven by Chinese volume-based procurement that drove system prices down and extended the targeted patient base. North America follows at USD 1.80 billion in 2025, where consolidation of dental service organizations is promoting standardization of procurement across thousands of offices. Dental Implants Market: Insights on Competitive Landscape: Suppliers integrating evidence-based surface science, with closed-loop digital ecosystems, will have a competitive edge until 2035.
Key Report Takeaways
• By Component
- Fixtures accounted for 71.0% of the Dental Implants Market in 2025, anchored by their role as the load-bearing osseointegrating unit.
- Abutments are the fastest-expanding component at a 9.90% CAGR through 2035 as centralised milling industrialises patient-specific fabrication.
• By Material
- Titanium implants commanded an 80.4% share in 2025 on the strength of five decades of clinical survival data.
- Zirconium implants are advancing at an 11.61% CAGR, the highest of any material class.
• By Design
- Tapered fixtures held a 65.5% share in 2025 because their macro-geometry delivers the insertion torque immediate loading requires
- Parallel-walled designs are growing at a 9.49% CAGR as clinicians address narrow inter-radicular anatomy.
• By Procedure Type
- Conventional two-stage protocols retained 61.2% of procedure volume in 2025
- Immediate-load procedures post the steepest trajectory in the Dental Implants Market at a 12.52% CAGR through 2035
• By End User
- Dental hospitals and clinics captured 51.8% of spend in 2025
- Dental laboratories record a 10.38% CAGR as fabrication migrates to regional hubs
• By Region
- Europe led the Dental Implants Market with a 33.0% share in 2025
- Asia-Pacific is the growth leader at a 10.60% CAGR through 2035
- North America generated USD 1.80 billion in 2025 revenue
Market Size and Forecast (2021–2035)
The Dental Implants Market is sized using bottom-up unit shipment reconciliation and top-down revenue triangulation. Volumes of fixture and abutment shipments were obtained from manufacturer disclosures, customs trade statistics and national dental association placement registries and compounded by blended average selling prices adjusted for regional discount structures and tender pricing. Revenue was cross-checked against segment reporting from publicly listed manufacturers, and against reimbursement claim numbers submitted to statutory insurers in Germany, France, South Korea and Japan. Historical years have been re-based to constant 2025 US dollars to prevent currency distortion.




 Noah Malgeri
Co-Founder

 Peter Groot koerkamp
Account and Business Manager

 Younghwan Choi
Senior Retail Manager

 Mark Irwin
Management Consultant

 Akif Moroglu
Strategy & Business Development Director

 Guilherme Gomes Martins
Product Management Director

 Joseph Aguayo
Sales Operations & Pricing Manager

 La Terria Dodd
Program Support Specialist

 Rob Kooiker
Group Product Manager HVAC & Fire Protection GMA


