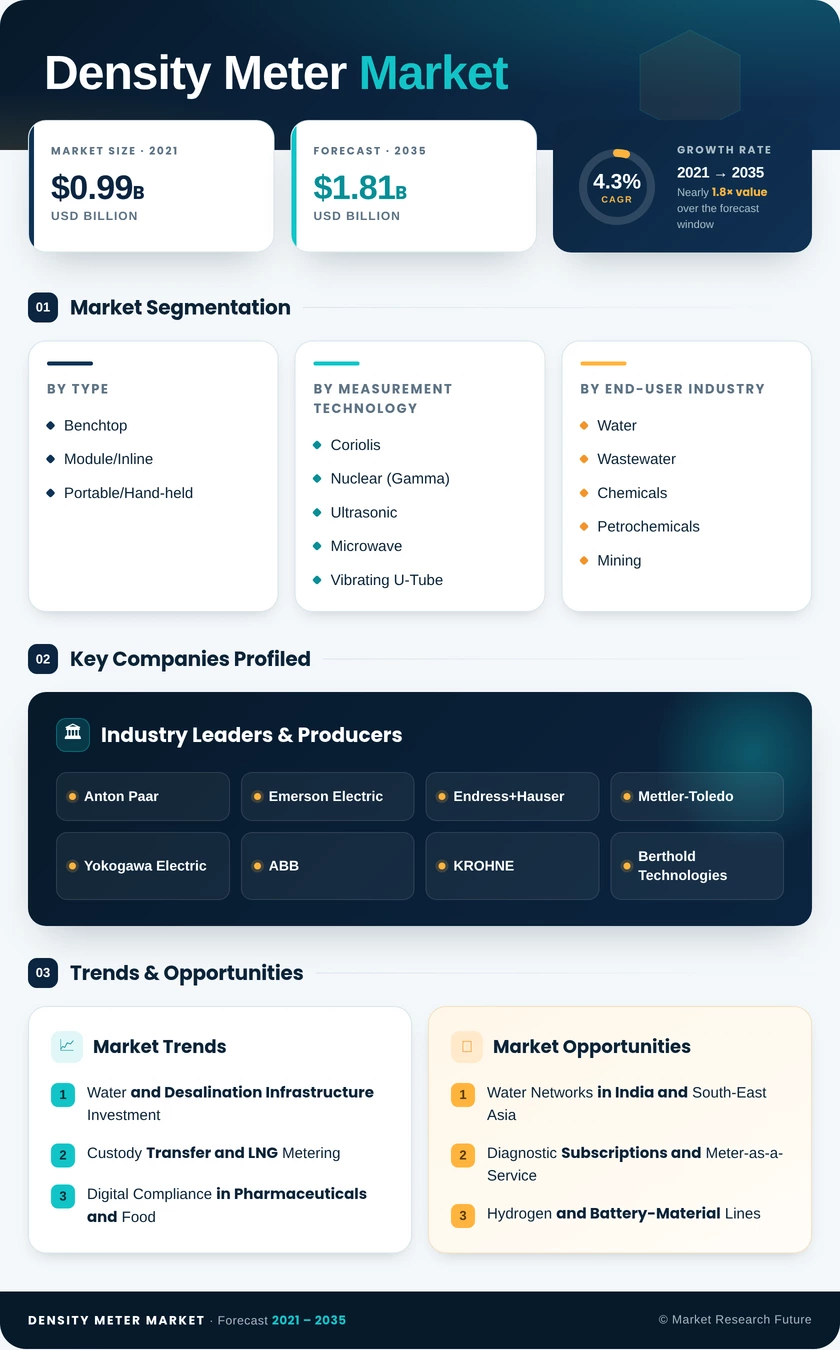
Density Meter Market (2026 - 2035)

ID: MRFR/SEM/6486-HCR 111 Pages Nirmit Biswas Last Updated: October 26, 2026
Density Meter Market Size, Share and Research Report By Type (Benchtop, Module/Inline, and Portable/Hand-Held), By Measurement Technology (Coriolis, Nuclear (Gamma), Ultrasonic, Microwave, Vibrating U-Tube, and Gravimetric (Hydrometer Replacement)), By End-User Industry (Water and Wastewater, Chemicals and Petrochemicals, Mining and Metal Processing, Food and Beverage, Healthcare and Pharmaceuticals, Electronics and Semiconductors, Oil and Gas (Upstream, Midstream, Downstream), Power and Utilities, and Research and Academic), By Fluid Medium (Liquids, Gases, and Slurries and Suspensions) And By Region (North America, Europe, Asia-Pacific, And Rest Of The World) – Industry Forecast Till 2035
Density Meter Market
Market Size
Forecast Period2026-2035
CAGR (2026-2035)4.3%
2025 Market SizeUSD 1.19 Billion
2035 Market SizeUSD 1.81 Billion
Key Players
Anton Paar
Emerson Electric
Endress+Hauser
Mettler-Toledo
Yokogawa Electric
ABB
Opportunities
  • Water Networks in India and South-East Asia
  • Diagnostic Subscriptions and Meter-as-a-Service
  • Hydrogen and Battery-Material Lines
  1. 1 Market Summary | |
  2. 2 Key Report Takeaways | |
    1. 2.1 By Type | |
    2. 2.2 By Measurement Technology | |
    3. 2.3 By End-user Industry | |
    4. 2.4 By Fluid Medium | |
    5. 2.5 By Region | |
  3. 3 Market Size and Forecast (2021–2035) | |
  4. 4 Driver Impact Analysis | |
    1. 4.1 Water and Desalination Infrastructure Investment | |
    2. 4.2 Custody Transfer and LNG Metering | |
    3. 4.3 Digital Compliance in Pharmaceuticals and Food | |
    4. 4.4 Critical-Mineral Mining Expansion | |
    5. 4.5 Biofuel and Sustainable Aviation Fuel Blending | |
    6. 4.6 Semiconductor Fab Construction | |
  5. 5 Restraints Impact Analysis | |
    1. 5.1 Radioactive Source Licensing and Disposal Burden | |
    2. 5.2 High Upfront Cost of Large-Bore Coriolis Meters | |
    3. 5.3 Shortage of Skilled Calibration Technicians | |
    4. 5.4 Contraction in European Chemical Output | |
    5. 5.5 Component Tariffs and Supply Volatility | |
  6. 6 Opportunities | |
    1. 6.1 Water Networks in India and South-East Asia | |
    2. 6.2 Diagnostic Subscriptions and Meter-as-a-Service | |
    3. 6.3 Hydrogen and Battery-Material Lines | |
    4. 6.4 Micro-Coriolis for Continuous Biomanufacturing | |
    5. 6.5 Measurement-Based Emissions Reporting | |
  7. 7 Regional Market Share and Country-Level Analysis | |
    1. 7.1 North America | | |
      1. 7.1.1 United States | | |
      2. 7.1.2 Canada | | |
      3. 7.1.3 Mexico | |
    2. 7.2 Europe | | |
      1. 7.2.1 Germany | | |
      2. 7.2.2 United Kingdom | | |
      3. 7.2.3 France | | |
      4. 7.2.4 Nordics | | |
      5. 7.2.5 Rest of Europe | |
    3. 7.3 South America | | |
      1. 7.3.1 Brazil | | |
      2. 7.3.2 Rest of South America | |
    4. 7.4 Asia-Pacific | | |
      1. 7.4.1 China | | |
      2. 7.4.2 Japan | | |
      3. 7.4.3 India | | |
      4. 7.4.4 South-East Asia | | |
      5. 7.4.5 Rest of Asia-Pacific | |
    5. 7.5 Middle East and Africa | | |
      1. 7.5.1 Middle East | | |
      2. 7.5.2 Gulf Cooperation Council Countries | | |
      3. 7.5.3 Turkey | | |
      4. 7.5.4 Rest of Middle East | | |
      5. 7.5.5 Africa | | |
      6. 7.5.6 South Africa | | |
      7. 7.5.7 Rest of Africa | |
  8. 8 Future Outlook (2026–2035) | |
    1. 8.1 Predictive Diagnostics Become the Core Product | |
    2. 8.2 Two-Wire Ethernet Reaches the Field | |
    3. 8.3 Energy-Transition Fuels Reshape Applications | |
    4. 8.4 Emissions and Sustainability Reporting | |
  9. 9 Segmentation Analysis | |
    1. 9.1 By Type | | |
      1. 9.1.1 Benchtop | | |
      2. 9.1.2 Module/Inline | | |
      3. 9.1.3 Portable/Hand-held | |
    2. 9.2 By Measurement Technology | | |
      1. 9.2.1 Coriolis | | |
      2. 9.2.2 Nuclear (Gamma) | | |
      3. 9.2.3 Ultrasonic | | |
      4. 9.2.4 Microwave | | |
      5. 9.2.5 Vibrating U-Tube | | |
      6. 9.2.6 Gravimetric (Hydrometer Replacement) | |
    3. 9.3 By End-user Industry | | |
      1. 9.3.1 Water and Wastewater | | |
      2. 9.3.2 Chemicals and Petrochemicals | | |
      3. 9.3.3 Mining and Metal Processing | | |
      4. 9.3.4 Food and Beverage | | |
      5. 9.3.5 Healthcare and Pharmaceuticals | | |
      6. 9.3.6 Electronics and Semiconductors | | |
      7. 9.3.7 Oil and Gas (Upstream, Midstream, Downstream) | | |
      8. 9.3.8 Power and Utilities | | |
      9. 9.3.9 Research and Academic | |
    4. 9.4 By Fluid Medium | | |
      1. 9.4.1 Liquids | | |
      2. 9.4.2 Gases | | |
      3. 9.4.3 Slurries and Suspensions | |
  10. 10 Competitive Landscape | |
    1. 10.1 Market Concentration Analysis | |
    2. 10.2 Competitive Benchmarking Table | |
    3. 10.3 Company Profiles | | |
      1. 10.3.1 Anton Paar | | |
      2. 10.3.2 Emerson Electric | | |
      3. 10.3.3 Endress+Hauser | | |
      4. 10.3.4 Mettler-Toledo | | |
      5. 10.3.5 Yokogawa Electric | | |
      6. 10.3.6 ABB | | |
      7. 10.3.7 KROHNE | | |
      8. 10.3.8 Berthold Technologies | | |
      9. 10.3.9 Thermo Fisher Scientific | | |
      10. 10.3.10 Rudolph Research Analytical | | |
      11. 10.3.11 Kyoto Electronics Manufacturing | |
  11. 11 Recent News & Developments | |
  12. 12 Report Scope and Methodology | |
  13. 13 Detailed Sources and Citations | |
  14. 14 Frequently Asked Questions (FAQs) | | LIST OF TABLES | |
  15. TABLE 1 Global Market Size & Forecast, by Revenue (USD Billion), 2021–2035 | |
  16. TABLE 2 Year-over-Year Growth Analysis, 2021–2035 | |
  17. TABLE 3 Driver Impact Analysis | |
  18. TABLE 4 Restraints Impact Analysis | |
  19. TABLE 5 Regional Summary, 2025 (USD Billion) | |
  20. TABLE 6 North America Market, by Country, 2021–2035 (USD Billion) | |
  21. TABLE 7 Europe Market, by Country, 2021–2035 (USD Billion) | |
  22. TABLE 8 South America Market, by Country, 2021–2035 (USD Billion) | |
  23. TABLE 9 Asia-Pacific Market, by Country, 2021–2035 (USD Billion) | |
  24. TABLE 10 Middle East and Africa Market, by Country, 2021–2035 (USD Billion) | |
  25. TABLE 11 Global Market, by Type, 2021–2035 (USD Billion) | |
  26. TABLE 12 Global Market, by Measurement Technology, 2021–2035 (USD Billion) | |
  27. TABLE 13 Global Market, by End-user Industry, 2021–2035 (USD Billion) | |
  28. TABLE 14 Global Market, by Fluid Medium, 2021–2035 (USD Billion) | |
  29. TABLE 15 Competitive Benchmarking Table, 2025 | |
  30. TABLE 16 Recent News & Developments, 2023–2025 | |
  31. TABLE 17 Report Scope and Methodology | |
  32. TABLE 18 Detailed Sources and Citations | | LIST OF FIGURES | |
  33. FIGURE 1 Market Dynamics Overview — Drivers, Restraints and Opportunities | |
  34. FIGURE 2 Industry Value Chain Analysis | |
  35. FIGURE 3 Porter's Five Forces Analysis | |
  36. FIGURE 4 Global Market Size Trend, 2021–2035 (USD Billion) | |
  37. FIGURE 5 Market Share by Type, 2025 | |
  38. FIGURE 6 Market Share by Measurement Technology, 2025 | |
  39. FIGURE 7 Market Share by End-user Industry, 2025 | |
  40. FIGURE 8 Market Share by Fluid Medium, 2025 | |
  41. FIGURE 9 Regional Market Share, 2025 | |
  42. FIGURE 10 Country-Level Growth Comparison, 2026–2035 | |
  43. FIGURE 11 Competitive Landscape — Estimated Revenue Share Ranges, 2025 | |
  44. FIGURE 12 Strategic Positioning Matrix of Key Players

Segmentation Quick Reference

DimensionSub-SegmentsDominant SegmentFastest Growing Segment
By TypeBenchtop; Module/Inline; Portable/Hand-heldBenchtop (47.2%)Portable/Hand-held (6.6% CAGR)
By Measurement TechnologyCoriolis; Nuclear (Gamma); Ultrasonic; Microwave; Vibrating U-Tube; Gravimetric (Hydrometer Replacement)Coriolis (36.6%)Ultrasonic (7.2% CAGR)
By End-user IndustryWater and Wastewater; Chemicals and Petrochemicals; Mining and Metal Processing; Food and Beverage; Healthcare and Pharmaceuticals; Electronics and Semiconductors; Oil and Gas (Upstream, Midstream, Downstream); Power and Utilities; Research and AcademicChemicals and Petrochemicals (29.2%)Water and Wastewater (6.3% CAGR)
By Fluid MediumLiquids; Gases; Slurries and SuspensionsLiquids (71.4%)Slurries and Suspensions (5.3% CAGR)
By RegionNorth America; Europe; South America; Asia-Pacific; Middle East and AfricaAsia-Pacific (38.5% share)Asia-Pacific (38.5% share)

Market Segmentation Overview

By Type

Sub-SegmentKey Trend
BenchtopIntegration with LIMS, electronic signatures and multi-parameter modules
Module/InlineEmbedded diagnostics and two-wire Ethernet connectivity
Portable/Hand-heldTemperature compensation, RFID sample tracking and wireless export

Benchtop leads at 47.2% because pharmaceutical and chemical labs need documented, high-resolution results under data-integrity rules. Portable/Hand-held grows fastest at 6.6% CAGR as beverage, mining and terminal operators move checks to the point of fill. Module/Inline sits between them, tied to capital projects rather than lab budgets.

By Measurement Technology

Sub-SegmentKey Trend
CoriolisSelf-diagnosis of coating and two-phase flow; longer recalibration intervals
Nuclear (Gamma)Gradual substitution driven by licensing and disposal costs
UltrasonicClamp-on designs avoiding line cuts and sanitation risk.
MicrowaveSolids monitoring in sludge and pulp
Vibrating U-TubeFive-decimal resolution for ASTM D4052 testing
Gravimetric (Hydrometer Replacement)Low-cost digital substitution for glass hydrometers

Coriolis holds 36.6% because one instrument delivers both mass flow and density for custody transfer and recipe control. Ultrasonic grows fastest at 7.2% CAGR, since clamp-on installation spares dairy, pulp and mining operators from shutdowns. Nuclear (Gamma) remains entrenched in abrasive slurries but faces slow erosion from source-licensing burdens.

By End-user Industry

Sub-SegmentKey Trend
Water and WastewaterDesalination brine control and IP68, NB-IoT-connected meters
Chemicals and PetrochemicalsBlending accuracy and emissions accounting
Mining and Metal ProcessingTailings consolidation and flotation pulp control
Food and BeverageDigital Brix and alcohol checks
Healthcare and PharmaceuticalsContinuous manufacturing and audit-trailed records
Electronics and SemiconductorsCMP slurry and ultra-pure chemical concentration control
Oil and Gas (Upstream, Midstream, Downstream)Fiscal metering at LNG and blending terminals
Power and UtilitiesBoiler chemistry and desulfurization slurry
Research and AcademicBenchtop purchases funded by research grants

Chemicals and Petrochemicals dominate with 29.2%, reliant on density control for blending, custody transfer and emissions accounting. Water and Wastewater grows fastest at 6.3% CAGR, propelled by Gulf desalination and potable-reuse projects where readings guide membrane fouling diagnostics. Electronics and Semiconductors and Healthcare and Pharmaceuticals add smaller but premium-priced demand.

By Fluid Medium

Sub-SegmentKey Trend
LiquidsBroadest installed base across chemicals, fuels and beverages
GasesLNG boil-off, fuel-gas calorific value and hydrogen blending
Slurries and SuspensionsNon-invasive acoustic and radiometric meters for abrasive flows

Liquids account for 71.4% because chemical, fuel, beverage and pharmaceutical streams make up most installations. Slurries and Suspensions grow fastest at 5.3% CAGR as miners and battery-material producers tighten solids control to improve recovery and coating quality. Gases stay a smaller niche, though hydrogen blending gives them a new growth lever.


Download PDF ×

We do not share your information with anyone. However, we may send you emails based on your report interest from time to time. You may contact us at any time to opt-out.