Data Center Liquid Cooling Market (2026 – 2035)

Data Center Liquid Cooling Market Size, Share and Research Report By Cooling Technology (Direct-to-Chip Liquid Cooling, Immersion Cooling, Rear-Door Heat Exchangers, Other Cooling Technologies), By Coolant Type (Single-Phase Hydrocarbon Fluids, Two-Phase Fluorocarbon Fluids, Water / Glycol Blends, Other Coolants), By Data Center Type (Hyperscale, Colocation, Enterprise, Edge & Micro Data Centers), By Application (AI / ML Workloads, High-Performance Computing, General Enterprise IT, Other Applications) and By Regional (North America, Europe, South America, South Africa, Asia Pacific, Middle East and Africa) - Industry Forecast to 2035.
ID: MRFR/ICT/23218-HCR 200 Pages Apoorva Priyadarshi, Aarti Dhapte Last Updated: September 17, 2026
Data Center Liquid Cooling Market
Market Size
Forecast Period2026-2035
CAGR (2026-2035)21.0%
2025 Market SizeUSD 5.90 Billion
2035 Market SizeUSD 40.25 Billion
Key Players
Vertiv Holdings
Schneider Electric
CoolIT Systems
Asetek
Iceotope Technologies
GRC
Opportunities
  • Colocation Providers Offering Liquid-Ready Pods
  • District Heating Integration in European Markets
  • Emerging-Market Sovereign AI Buildouts

Data Center Liquid Cooling Market Summary

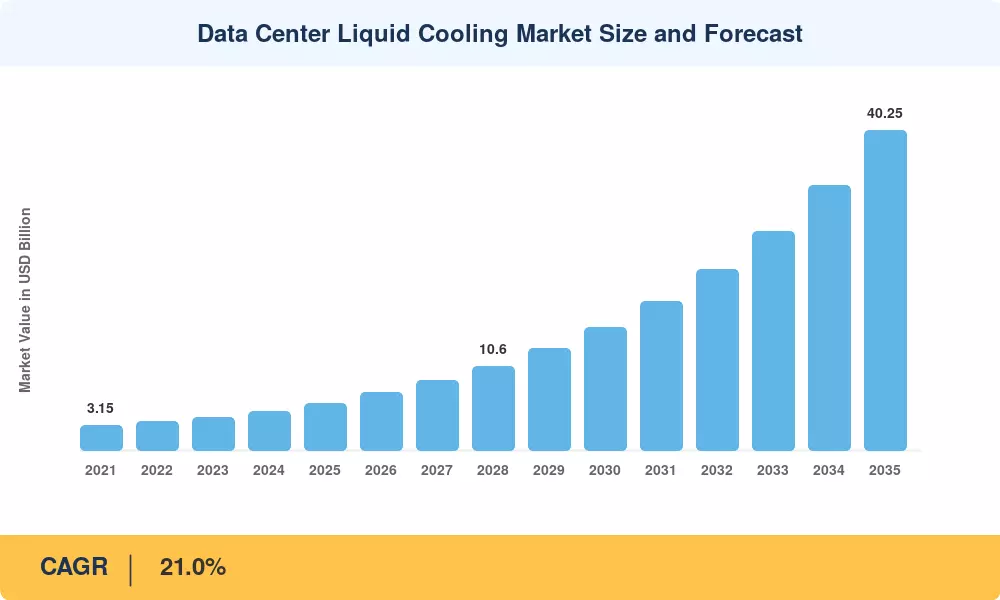
The data center liquid cooling market was valued at USD 5.90 billion in 2025 and is projected to reach USD 7.24 billion in 2026 before climbing to USD 40.25 billion by 2035, registering a CAGR of 21.0% across the 2026–2035 forecast window. Two catalysts are reshaping facility design at pace: rack power densities that now routinely exceed 30 kW per cabinet, and the U.S. Department of Energy's 2024 Federal Sustainability Plan, which set an aggressive PUE target of 1.2 or lower for all new government-funded facilities [1]. Together, these forces make air-based thermal management insufficient for next-generation compute clusters.

Hybrid and fully liquid-based thermal platforms are replacing legacy air-cooled architectures, which consist of perimeter CRAC/CRAH units and raised-floor plenum designs. In 2024, Microsoft disclosed that it has initiated the fleet-wide adoption of direct-to-chip cooling across Azure regions, underscoring the rapidity of the transition . Operators have reported capital savings of 15–20% on mechanical infrastructure when liquid replaces traditional hot-aisle/cold-aisle containment at densities exceeding 40 kW [3].

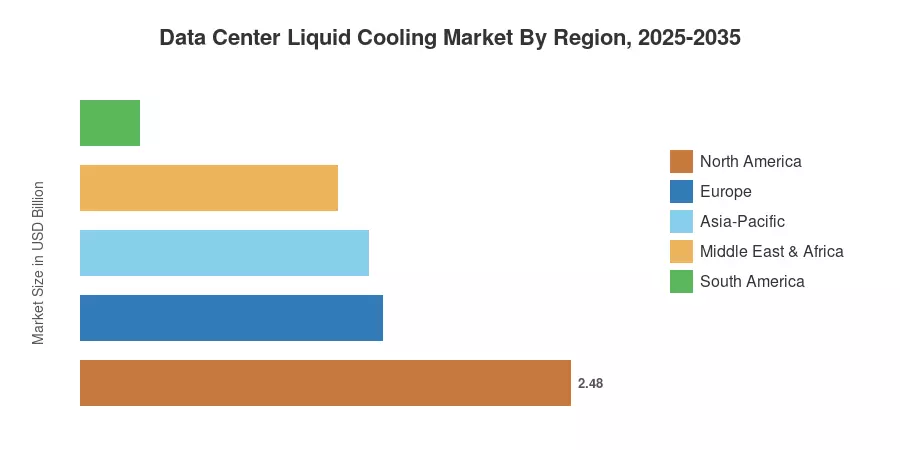
Approximately 42% of the data center liquid cooling market is dominated by North America, which is primarily driven by hyperscale buildouts in Virginia, Texas, and Oregon. The Asia-Pacific region is the fastest-growing, with a projected CAGR of 24.8%. This growth is primarily due to the USD 1.2 billion National Data Center Framework in India and sovereign AI mandates in Japan [4]. The EU Energy Efficiency Directive's heat-reuse provisions have propelled Europe to claim the second-largest share, which is approximately 26% [5]. The data center liquid cooling market is on the brink of a structural expansion cycle that will persist well beyond 2030.


Key Report Takeaways

• By Cooling Technology

  • Direct-to-chip captured approximately 46% of the data center liquid cooling market share in 2025, reflecting ease of retrofit into existing rack architectures.
  • Immersion cooling is projected to expand at a 24.5% CAGR through 2035, driven by two-phase thermal efficiencies that outperform single-phase alternatives in AI training clusters.
  • Rear-door heat exchangers accounted for an estimated USD 0.78 billion in 2025 revenue, serving as a low-disruption entry point for enterprise adopters.

• By Data Center Type

  • Hyperscale facilities held roughly 42% of spending in the data center liquid cooling market during 2025, as cloud operators converted pilot programs into fleet-wide deployments.
  • Edge and micro data centers are forecast to register the highest segment CAGR at 23.0% through 2035


• By Application

  • AI and machine-learning workloads represented approximately 37.5% of 2025 demand, and that concentration is intensifying as GPU cluster densities climb.
  • Edge and micro data centers are forecast to register the highest segment CAGR at 23.0% through 2035.

• By Region

  • North America led the data center liquid cooling market with a 42% revenue share in 2025.
  • Asia-Pacific is set to record a 24.8% CAGR — fastest among all regions — underpinned by China's east-data-west-compute program and Japan's Green Transformation bonds.
  • Europe contributed roughly 26% of global revenues, with the Nordic countries emerging as preferred sites for immersion-cooled facilities.


Data Center Liquid Cooling Market Size and Forecast (2021–2035)

Market Research Future's sizing model combines bottom-up component-level analysis — tracking cold plate, manifold, coolant distribution unit, and immersion tank shipments — with top-down validation against operator capital-expenditure disclosures and public procurement records. Historical figures (2021–2024) are reconciled against audited vendor revenues; forecast projections (2026–2035) apply demand-weighted regression calibrated to planned data center capacity additions globally.
Data Center Liquid Cooling Market Size and Forecast
Our Impact

Enabled $4.3B Revenue Impact for Fortune 500 and Leading Multinationals

Partnering with 2000+ Global Organizations Each Year

30K+ Citations by Top-Tier Firms in the Industry

Driver Impact Analysis

Driver ~% Impact on CAGR Geographic Relevance Impact Timeline
GPU/AI compute density escalation 25–30% Global Short-term (≤2 yr)
Hyperscale fleet-wide liquid rollouts 20–25% North America, APAC Short-term
Sustainability & PUE regulations 15–20% Europe, North America Medium-term (2–4 yr)
Heat-reuse monetization incentives 10–12% Europe, Nordics Medium-term
Edge & micro data center proliferation 8–10% APAC, South America Long-term (≥4 yr)
Coolant technology innovation (two-phase) 5–8% Global Long-term
Colocation competitive differentiation 4–6% North America, Europe Medium-term


GPU and AI Compute Density Escalation

Rack densities of 60–120 kW are achieved by NVIDIA's H100 and B200 accelerators, which dissipate 700 W and 1,000 W per chip, respectively, rendering air cooling physically impracticable [7]. This singular vector is causing the data center liquid cooling market to undergo its most severe demand inflection. The scale of commitment among top-tier operators is exemplified by Meta's 2024 disclosure of a 600 MW AI training campus in Louisiana, which is wholly designed around liquid-cooled racks [12].


Hyperscale Fleet-Wide Liquid Deployments

Cloud providers have progressed beyond the proof-of-concept phase. Microsoft has confirmed that direct-to-chip liquid cooling is a standard specification for new Azure regions. In the same year, Google's 2024 sustainability report identified liquid cooling as a critical component of the fleet-average PUE of 1.10 by 2030 [13]. Since 2022, this aggregated procurement volume has reduced per-rack costs by an estimated 12–18% and compressed supplier lead times.


Sustainability Mandates and PUE Regulation

The EU Energy Efficiency Directive (2023/1791) requires data centers above 500 kW to report PUE annually starting 2025, with binding improvement trajectories from 2027 [5]. In the United States, the DOE's Better Climate Challenge has enrolled over 150 commercial building operators — including several colocation providers — that have committed to halving carbon intensity within a decade [1]. Both regulatory frameworks reward liquid cooling's inherent efficiency advantage over air-based alternatives.

Heat-Reuse Monetization

Nordic operators such as Stockholm Data Parks and Helsinki's Fortum joint venture already sell rejected heat from liquid-cooled facilities into municipal district heating grids, generating USD 8–15 per MWh in supplemental revenue [10]. The data center liquid cooling market benefits directly, because closed-loop liquid systems capture thermal energy at 55–65°C — warm enough for residential heating — whereas air-cooled exhaust is too diffuse for practical recovery.


Restraints Impact Analysis

The restraint percentages below are directional estimates of headwind severity; they do not subtract linearly from the CAGR and should be read as relative drag factors within the broader demand model.

Restraint ~% Negative Impact on CAGR Geographic Relevance Impact Timeline
High upfront capital and retrofit costs 15–20% Global Short-term (≤2 yr)
Workforce skill gaps in liquid thermal systems 10–15% APAC, South America Medium-term (2–4 yr)
Coolant supply chain and environmental concerns 8–12% Europe, Global Medium-term
Facility structural limitations (floor loading, plumbing) 5–8% Enterprise, Colocation Short-term
Lack of standardized manifold interconnects 4–6% Global Long-term (≥4 yr)


High Upfront Capital and Retrofit Complexity

A full liquid cooling retrofit for a 1 MW data hall typically costs USD 2.5–4.0 million, compared with USD 1.0–1.5 million for a comparable air-cooled upgrade, according to Uptime Institute's 2024 cost benchmarking study [14]. This premium discourages mid-market enterprise operators who face 3–5-year payback horizons, particularly in regions where electricity tariffs are low enough to mask the operating-cost advantage of liquid cooling.

Workforce Skill Gaps

The Uptime Institute's 2024 Global Data Center Survey found that 53% of operators cite a shortage of staff trained in fluid-dynamics-based thermal management as a top barrier to liquid cooling adoption [15]. Training pipelines remain nascent — fewer than 20 accredited programs worldwide offer specialized certification in liquid cooling system design and maintenance.

Coolant Supply Chain and Regulatory Uncertainty

The European Chemicals Agency's proposed PFAS restriction could affect fluorinated two-phase coolants used in immersion systems . While exemptions for closed-loop data center applications are under discussion, the regulatory ambiguity has prompted some operators to delay immersion investments until the final rule — expected in late 2025 — clarifies permissible chemistries. This uncertainty constrains the fastest-growth segment of the data center liquid cooling market.


Data Center Liquid Cooling Market Opportunities

Colocation Providers Offering Liquid-Ready Pods

Colocation operators that pre-install liquid manifolds and coolant distribution units can command 20–30% rental premiums for high-density suites [11]. Equinix's xScale program and Digital Realty's PlatformDIGITAL have both introduced liquid-ready configurations, turning cooling capability into a competitive moat.

District Heating Integration in European Markets

The EU's revised Renewable Energy Directive incentivizes waste-heat capture, creating a revenue stream that improves liquid cooling payback by 1–2 years in Scandinavian and Northern European markets [10]. Operators in Stockholm, Helsinki, and Amsterdam are already monetizing this heat, and the model is replicable across any geography with district heating infrastructure.

Emerging-Market Sovereign AI Buildouts

India's National Data Centre Framework allocates USD 1.2 billion for domestic AI infrastructure, while Saudi Arabia's NEOM project includes a 100 MW hyperscale campus designed for liquid cooling from inception [4][17]. These greenfield deployments bypass legacy air-cooling constraints entirely, opening high-value order pipelines for cooling vendors with turnkey liquid solutions.

Cooling-as-a-Service and Subscription Models

Several vendors, including CoolIT Systems and Iceotope, have begun offering managed liquid cooling under OPEX-based subscription agreements, lowering the capital barrier for enterprise adopters. This business model shifts risk to the cooling provider and expands the addressable market of the data center liquid cooling market to mid-tier operators who previously could not justify upfront expenditure.

Next-Generation Dielectric Coolant Development

Two-phase hydrocarbon-based coolants with lower global warming potential are entering commercial trials, offering a regulatory-safe alternative to fluorinated fluids . If these chemistries achieve comparable thermal conductivity at scale, they could unlock the immersion segment in PFAS-restricted jurisdictions and accelerate the data center liquid cooling market across Europe.


Data Center Liquid Cooling Market Future Outlook

AI-Native Facility Design

By 2028, an estimated 40% of new hyperscale campuses will be designed as AI-native facilities where liquid cooling is the primary — not supplementary — thermal platform [7]. The data center liquid cooling market will shift from retrofit economics to greenfield specification, compressing system costs and standardizing plumbing architectures. The IEA projects global data center electricity consumption to exceed 1,000 TWh by 2030, and liquid cooling's efficiency gains will be central to managing that load sustainably [23].

Platform Economics and Cooling-as-a-Service

Subscription-based delivery models will reshape vendor economics across the data center liquid cooling market during 2027–2032. As CoolIT, Iceotope, and emerging players package hardware, coolant replenishment, and remote monitoring into single OPEX contracts, the total addressable market expands to include mid-tier enterprise operators who currently lack the capital or expertise for self-managed deployments [11].

Electrification Supercycle and Grid Integration

The convergence of data center growth and grid decarbonization creates a structural tailwind. The DOE's Liftoff Report on data centers (2024) estimated that U.S. data center power demand could reach 35 GW by 2030 — roughly double 2023 levels [1]. Liquid cooling's lower parasitic power load (fans, chillers) will become a grid-planning consideration, and some regulators may condition new interconnection permits on demonstrated PUE thresholds that effectively mandate liquid thermal solutions.

ESG Reporting and Scope 2 Pressure

The SEC's climate disclosure rule and the EU's Corporate Sustainability Reporting Directive both require large operators to quantify Scope 2 emissions from purchased electricity [5]. Liquid-cooled facilities that achieve PUE values of 1.05–1.15 can report materially lower emissions per compute unit than air-cooled peers at PUE 1.3–1.5. As investors scrutinize these disclosures, the data center liquid cooling market will benefit from capital allocation that increasingly favors low-PUE infrastructure.


Regional Market Share Analysis

Region Key Metric Primary Investment Themes
North America 42% revenue share (2025) Hyperscale AI campuses, federal PUE mandates
Europe 26% revenue share (2025) Heat-reuse regulation, PFAS coolant transition
Asia-Pacific 24.8% CAGR (2026–2035) Sovereign AI programs, new-build greenfield sites
South America USD 0.30 Billion (2025) Telecom edge expansion, Brazil cloud zones
Middle East & Africa 22.0% CAGR (2026–2035) NEOM/smart-city projects, UAE digital hubs
Total USD 5.90 Billion (2025) —

The data center liquid cooling market exhibits a clear geographic hierarchy shaped by hyperscale concentration, regulatory posture, and energy-cost structures. North America leads on installed base, while Asia-Pacific is scaling fastest on the back of sovereign digital-infrastructure programs.


North America

Country Key Metric Key Driver
United States 78% of regional share Virginia/Texas hyperscale corridor [1]
Canada 13.5% of regional share Quebec hydroelectric cost advantage [18]
Mexico USD 0.21 Billion (2025) Nearshoring-driven colocation growth [18]


The United States dominates the North American data center liquid cooling market thanks to the Northern Virginia cluster — the world's largest data center market — where operators including AWS, Microsoft, and Google have committed to liquid-cooled next-generation campuses. Canada's low-cost hydroelectric power in Quebec and Ontario attracts liquid-cooled HPC workloads, while Mexico is emerging as a nearshore colocation hub following recent cloud-zone announcements by Oracle and Equinix [18].

Europe

Country Key Metric Key Driver
Germany 24% of regional share Frankfurt financial data centers [5]
United Kingdom 21.5% CAGR (2026–2035) London campus expansions [19]
France USD 0.19 Billion (2025) Paris hyperscale corridor [19]
Italy 20.8% CAGR (2026–2035) Milan exchange proximity builds [19]
Spain USD 0.09 Billion (2025) Madrid cloud-zone growth [19]
Nordic Countries 28% of regional share Immersion-cooled heat-reuse pioneers [10]
Russia USD 0.05 Billion (2025) Domestic cloud sovereignty mandates [19]
Rest of Europe 11% of regional share Distributed colocation expansion [19]


European growth in the data center liquid cooling market is shaped by the EU Energy Efficiency Directive's PUE disclosure requirements and the Renewable Energy Directive's waste-heat provisions. Nordic countries punch above their weight because operators there combine cheap renewable power with established district heating networks, making immersion cooling financially attractive. Frankfurt, London, and Paris remain the continent's three largest data center markets by installed capacity, and each is seeing liquid cooling penetration rise in new-build campuses [5][10].

Asia-Pacific

Country Key Metric Key Driver
China 38% of regional share East-data-west-compute program [4]
India 27.2% CAGR (2026–2035) National Data Centre Framework [4]
Japan USD 0.18 Billion (2025) Green Transformation bond financing
South Korea 23.5% CAGR (2026–2035) Seoul metro hyperscale builds
ASEAN USD 0.11 Billion (2025) Singapore/Jakarta hub expansion
Rest of Asia-Pacific 22.0% CAGR (2026–2035) Distributed edge deployments


Asia-Pacific is the fastest-growing region within the data center liquid cooling market. China's government-backed east-data-west-compute initiative is funneling capacity into Guizhou, Gansu, and Inner Mongolia, where new facilities are being spec'd with liquid-cooled infrastructure from day one. India's Yotta, NTT, and Adani data center expansions collectively represent over 500 MW of planned liquid-ready capacity. At the same time, Japan's JPY 20 trillion Green Transformation bond program earmarks financing for sustainable data center infrastructure [4].

South America

Country Key Metric Key Driver
Brazil 62% of regional share São Paulo cloud zone anchor [21]
Argentina 18.5% CAGR (2026–2035) Vaca Muerta energy cost advantage [21]
Rest of South America USD 0.06 Billion (2025) Chile/Colombia edge deployments [21]


Brazil's São Paulo metro — home to Latin America's largest internet exchange — is the primary demand center for the data center liquid cooling market in South America. AWS, Google, and Equinix have all announced capacity expansions there, and rising AI workload densities are driving liquid cooling adoption in new builds [21].

Middle East & Africa

Country Key Metric Key Driver
Saudi Arabia 34% of regional share NEOM smart-city data campus [17]
UAE 30% of regional share Dubai Silicon Oasis expansion [17]
South Africa 19.8% CAGR (2026–2035) Johannesburg cloud zone growth [22]
Egypt USD 0.02 Billion (2025) Emerging colocation market [22]
Rest of MEA 17.5% CAGR (2026–2035) Government digitization programs [22]


Saudi Arabia and the UAE anchor the Middle Eastern data center liquid cooling market, with NEOM's 100 MW campus and Dubai's Khazna Data Centers both specifying liquid-cooled designs. Harsh ambient temperatures make liquid cooling especially compelling in Gulf Cooperation Council states, where air-cooled PUE penalties can exceed 0.3 [17].


Data Center Liquid Cooling Market By Region, 2025-2035

Data Center Liquid Cooling Market Segmentation

By Cooling Technology

Segment Key Metric Primary Demand Driver
Direct-to-Chip Liquid Cooling 46% share (2025) Retrofit compatibility with existing racks
Immersion Cooling 24.5% CAGR (2026–2035) Two-phase thermal efficiency for AI clusters
Rear-Door Heat Exchangers USD 0.78 Billion (2025) Low-disruption enterprise entry point
Other Cooling Technologies 18.0% CAGR (2026–2035) Spray and microfluidic R&D


Direct-to-chip liquid cooling commands the largest share of the data center liquid cooling market because it integrates with standard server form factors and requires minimal facility redesign. Cold plates mounted on CPUs and GPUs circulate water or propylene glycol through manifolds routed to facility-level coolant distribution units. Operators like Microsoft and Dell Technologies have validated this approach at scale, and the installed base is growing at a pace that drives component-cost deflation across the supply chain .

Immersion cooling — both single-phase and two-phase — is the fastest-expanding technology segment. In two-phase systems, servers are submerged in a dielectric fluid that boils at chip-surface temperatures, absorbing heat through phase change and delivering thermal resistance values roughly 10× lower than air . The data center liquid cooling market is seeing immersion deployments accelerate in AI training environments where rack densities of 80–120 kW make even direct-to-chip solutions marginal.

By Coolant Type

Segment Key Metric Primary Demand Driver
Single-Phase Hydrocarbon Fluids 41.5% share (2025) Lower cost, broad compatibility
Two-Phase Fluorocarbon Fluids 23.6% CAGR (2026–2035) Superior phase-change efficiency
Water / Glycol Blends USD 1.10 Billion (2025) Direct-to-chip standard medium
Other Coolants 19.5% CAGR (2026–2035) Next-gen low-GWP formulations


Single-phase hydrocarbon fluids dominate the data center liquid cooling market by volume because they are non-toxic, relatively inexpensive, and compatible with a wide range of server hardware. Two-phase fluorocarbon fluids, while more expensive, deliver the highest thermal performance and are the preferred medium for immersion tanks handling next-generation GPU clusters.

By Data Center Type

Segment Key Metric Primary Demand Driver
Hyperscale 42% share (2025) Fleet-wide AI infrastructure buildout
Colocation USD 1.18 Billion (2025) High-density tenant demand
Enterprise 19.5% CAGR (2026–2035) On-premises AI/ML adoption
Edge & Micro Data Centers 23.0% CAGR (2026–2035) Distributed inference workloads


Hyperscale operators shape the data center liquid cooling market's trajectory because their procurement volumes set pricing benchmarks for the entire ecosystem. Colocation providers are the second-largest revenue contributors; they are increasingly differentiating on liquid-ready capacity to attract AI-focused tenants who require 30+ kW per rack.

By Application

Segment Key Metric Primary Demand Driver
AI / ML Workloads 37.5% share (2025) GPU cluster thermal requirements
High-Performance Computing 21.0% CAGR (2026–2035) Scientific simulation density
General Enterprise IT USD 0.94 Billion (2025) Mixed workload densification
Other Applications 18.2% CAGR (2026–2035) Blockchain, rendering, financial HFT


AI and machine-learning workloads are the primary growth engine for the data center liquid cooling market, accounting for USD 2.21 billion of 2025 spending. Training runs on clusters of thousands of GPUs generate sustained thermal loads that exceed air-cooling capacity, making liquid systems a functional requirement rather than an efficiency upgrade.


Competitive Benchmarking

The data center liquid cooling market exhibits medium concentration, with an estimated top-five share of 38–45% and a Herfindahl-Hirschman Index in the 800–1,100 range. The landscape spans diversified infrastructure conglomerates (Vertiv, Schneider Electric), pure-play liquid cooling specialists (CoolIT Systems, Asetek, Iceotope), and immersion-focused innovators (GRC, Submer, ZutaCore). Competitive intensity is rising as hyperscale procurement volumes attract new entrants and established HVAC players expand into liquid modalities.

Company Est. Revenue Share Range Key Offerings Strategic Positioning
Vertiv Holdings ~8–11% Liebert XDU coolant distribution units, rear-door coolers Full-stack thermal infrastructure provider
Schneider Electric ~7–10% EcoStruxure liquid cooling modules, rack CDUs Integrated facility management ecosystem
CoolIT Systems ~6–9% DLC manifolds, cold plates for OEM server platforms Dominant OEM cold plate supplier
Asetek ~4–7% InRackIT direct liquid cooling, data center CDUs Pioneer in CPU/GPU cold plate technology
Iceotope Technologies ~3–6% Precision immersion, KyotoCooling integration Chassis-level immersion specialist
GRC (Green Revolution Cooling) ~3–5% ICEraQ single-phase immersion systems Immersion-first, open-tank architecture
Submer Technologies ~2–4% SmartPod immersion tanks, MicroPod edge units Modular immersion for colocation/edge
ZutaCore ~2–4% HyperCool two-phase direct-on-chip Waterless two-phase evaporative platform
Rittal GmbH ~2–4% LCP inline/rack liquid coolers, Blue e+ chillers European enterprise rack infrastructure
LiquidCool Solutions ~1–3% Rack-level total liquid submersion systems Full-submersion single-phase platform


Recent News & Developments

  • Microsoft (March 2024): Confirmed fleet-wide adoption of direct-to-chip liquid cooling for new Azure AI regions, signaling a structural shift away from air-only thermal designs .
  • NVIDIA (June 2024): Launched the GB200 NVL72 liquid-cooled rack architecture, delivering 72 Blackwell GPUs at 120 kW per rack and requiring closed-loop liquid cooling as standard [7].
  • Equinix (September 2024): Announced liquid-ready xScale deployments across 12 new metro markets, including São Paulo, Tokyo, and Frankfurt, with integrated CDU infrastructure [11].
  • European Chemicals Agency (November 2024): Published draft PFAS restriction proposal with a potential exemption pathway for closed-loop data center coolants, reducing regulatory uncertainty for immersion adopters .


  • U.S. Department of Energy (June 2025): Released updated data center energy efficiency guidelines recommending liquid cooling for any facility operating above 20 kW average rack density [1].


Data Center Liquid Cooling Market Report Scope

Parameter Detail
Market Scope Global data center liquid cooling market — hardware, coolants, and integrated services
Study Period 2021–2035
Historical Period 2021–2024
Base Year 2025
Forecast Period 2026–2035
CAGR (2026–2035) 21.0%
Market Size (2025) USD 5.90 Billion
Market Size (2035) USD 40.25 Billion
Fastest Growing Segment Immersion Cooling (by technology); Edge & Micro Data Centers (by type)
Companies Profiled Vertiv, Schneider Electric, CoolIT Systems, Asetek, Iceotope, GRC, Submer, ZutaCore, Rittal, LiquidCool Solutions
Valuation Currency USD Billion

FAQs

What is the typical payback period for a liquid cooling retrofit in an existing facility?
Most operators report a 2–3 year payback at rack densities above 30 kW, driven by electricity savings of 20–35% on mechanical cooling loads [3]. Payback compresses further when heat-reuse revenue is captured.
How do liquid cooling systems affect data center insurance premiums?
Insurers increasingly view liquid cooling favorably because it eliminates refrigerant leak risks associated with large chiller plants [14]. Facilities with closed-loop liquid systems have secured 5–10% premium reductions from select underwriters.
Can liquid cooling support multi-vendor server environments within the same rack?
Yes — most direct-to-chip manifold systems use standardized quick-disconnect fittings compatible with Dell, HPE, Lenovo, and Supermicro server platforms [16]. Interoperability testing by the Open Compute Project has accelerated cross-vendor adoption.
What staff certifications are recommended before deploying liquid cooling?
The Uptime Institute and ASHRAE both offer accredited thermal management courses covering fluid dynamics, leak detection, and coolant handling [15]. Vendors such as CoolIT and Vertiv also provide equipment-specific certification programs.
How does liquid cooling perform in high-ambient-temperature climates above 45°C?
Liquid systems decouple internal thermal loops from ambient air, maintaining consistent chip-junction temperatures even when outdoor conditions exceed 45°C [17]. Gulf-region deployments have demonstrated PUE values under 1.15 year-round.
Are there industry-standard specifications for liquid cooling manifold interconnects?
The Open Compute Project published the Advanced Cooling Facility specification in 2024, defining manifold dimensions, pressure ratings, and quick-connect standards [16]. Adoption remains voluntary but is accelerating among hyperscale buyers.
What is the environmental profile of dielectric immersion coolants at end of life?
Single-phase hydrocarbon coolants are generally recyclable and carry low global warming potential, while fluorinated two-phase fluids face scrutiny under the ECHA PFAS proposal . Operators should verify coolant chemistry against evolving regional regulations.    
Author
Author Author Profile Apoorva Priyadarshi LinkedIn Research Analyst
With 4+ years of experience in Market Intelligence and Strategic Research, Apoorv specializes in ICT, Semiconductor, and BFSI markets. Combining strong analytical capabilities with a deep understanding of technology-driven industries, he focuses on delivering data-driven insights that support strategic decision-making. With a background in technology and business research, Apoorv has contributed to numerous global market studies, competitive landscape analyses, and opportunity assessments across sectors such as semiconductors, digital banking, cybersecurity, and telecommunications.
Co-Author Co-Author Profile Aarti Dhapte LinkedIn AVP - Research
A consulting professional focused on helping businesses navigate complex markets through structured research and strategic insights. I partner with clients to solve high-impact business problems across market entry strategy, competitive intelligence, and opportunity assessment. Over the course of my experience, I have led and contributed to 100+ market research and consulting engagements, delivering insights across multiple industries and geographies, and supporting strategic decisions linked to $500M+ market opportunities. My core expertise lies in building robust market sizing, forecasting, and commercial models (top-down and bottom-up), alongside deep-dive competitive and industry analysis. I have played a key role in shaping go-to-market strategies, investment cases, and growth roadmaps, enabling clients to make confident, data-backed decisions in dynamic markets.
Download Free Sample

Kindly complete the form below to receive a free sample of this Report

Global Diameter Signaling Market
Case Study
Information and Communications Technology
Download PDF ×

We do not share your information with anyone. However, we may send you emails based on your report interest from time to time. You may contact us at any time to opt-out.