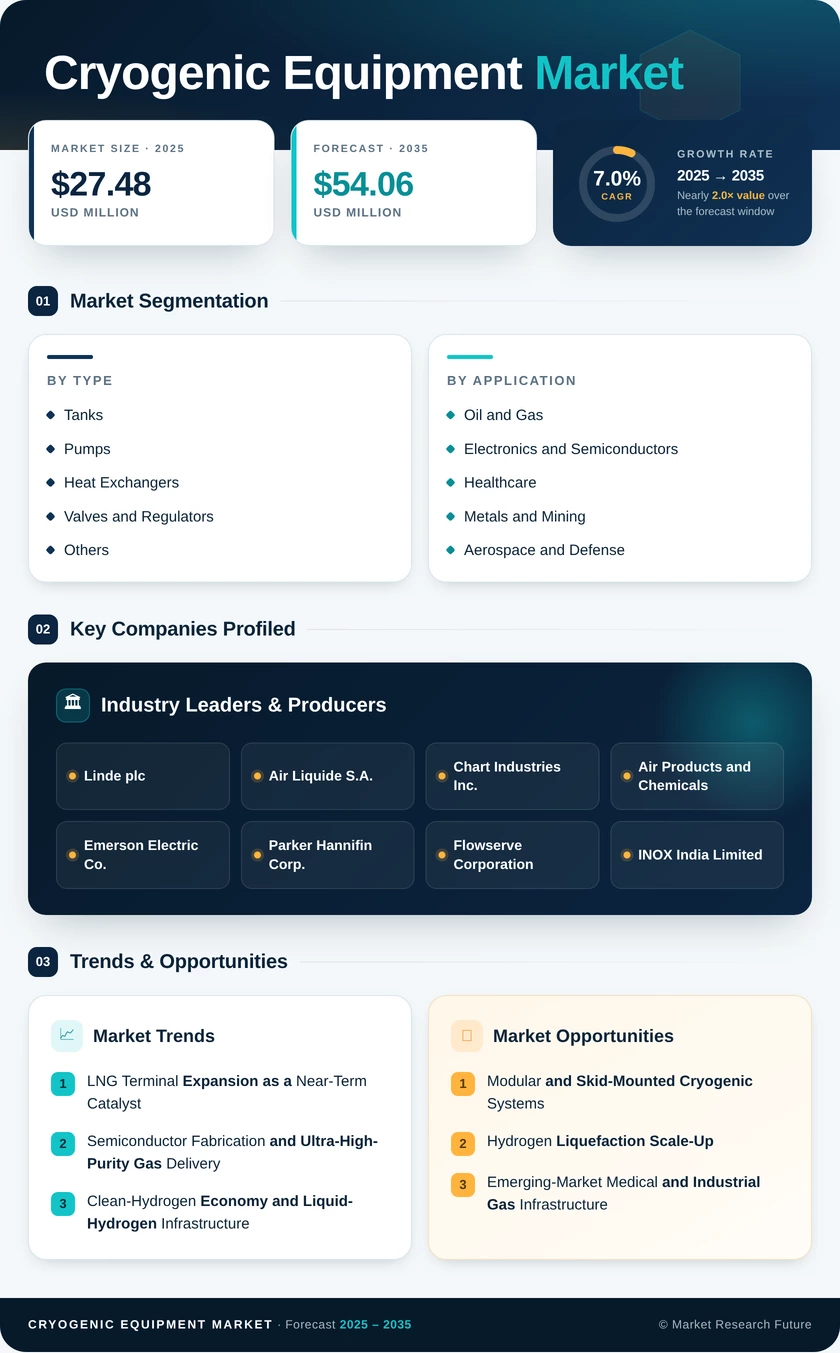
Cryogenic Equipment Market (2026 - 2035)

ID: MRFR/EnP/0758-CR
190 Pages
Chitranshi Jaiswal
Last Updated: August 24, 2026
Cryogenic Equipment Market Research Report By Gas Type (Liquid Nitrogen, Liquid Oxygen, Liquid Argon, Liquid Helium, Liquid Hydrogen, LNG), By Equipment Type (Tanks, Pumps, Heat Exchangers, Valves and Regulators, Others), By Application (Storage, Transportation and Distribution, Others), By End-User Industry (Oil and Gas, Electronics and Semiconductors, Healthcare, Metals and Mining, Aerospace and Defense, Others) and By Regional (North America, Europe, South America, Asia Pacific, Middle East and Africa) - Forecast to 2035
Cryogenic Equipment Market
Market Size
Forecast Period2026-2035
CAGR (2026-2035)7.0%
2025 Market SizeUSD 27.48 Billion
2035 Market SizeUSD 54.06 Billion
Key Players
Linde plc
Air Liquide S.A.
Chart Industries Inc.
Air Products and Chemicals
Emerson Electric Co.
Parker Hannifin Corp.
Opportunities
  • Modular and Skid-Mounted Cryogenic Systems
  • Hydrogen Liquefaction Scale-Up
  • Emerging-Market Medical and Industrial Gas Infrastructure
  1. 1 Market Overview |
    1. 1.1 Study Assumptions & Market Definition |
    2. 1.2 Scope of the Study |
    3. 1.3 Research Methodology
  2. 2 Market Summary & Key Takeaways
  3. 3 Market Dynamics |
    1. 3.1 Market Drivers Analysis | |
      1. 3.1.1 LNG Terminal Expansion | |
      2. 3.1.2 Semiconductor Fabrication and Ultra-High-Purity Gas Delivery | |
      3. 3.1.3 Clean-Hydrogen Economy and Liquid-Hydrogen Infrastructure | |
      4. 3.1.4 Healthcare Oxygen Demand in Emerging Markets | |
      5. 3.1.5 Space-Launch Cadence Increase | |
      6. 3.1.6 Industrial Gas Digitization Programs | |
      7. 3.1.7 Steel-Sector Decarbonization Mandates |
    2. 3.2 Market Restraints Analysis | |
      1. 3.2.1 Capital Intensity and Financing Barriers | |
      2. 3.2.2 Global Helium Supply Constraints | |
      3. 3.2.3 Permitting and Environmental Review Bottlenecks | |
      4. 3.2.4 Skilled-Workforce Shortages in Cryogenic Welding | |
      5. 3.2.5 Competition from Ambient-Temperature Alternatives |
    3. 3.3 Market Opportunity Analysis | |
      1. 3.3.1 Modular and Skid-Mounted Cryogenic Systems | |
      2. 3.3.2 Hydrogen Liquefaction Scale-Up | |
      3. 3.3.3 Emerging-Market Medical and Industrial Gas Infrastructure | |
      4. 3.3.4 Digital Services and Predictive-Maintenance Monetization | |
      5. 3.3.5 Space-Launch and Aerospace Propellant Demand |
    4. 3.4 Industry Value Chain Analysis |
    5. 3.5 Porter's Five Forces Analysis
  4. 4 Global Cryogenic Equipment Market Size & Forecast (2021–2035) |
    1. 4.1 Historical Market Size (2021–2025) |
    2. 4.2 Current & Forecast Market Size (2026–2035) |
    3. 4.3 Market Size by Revenue (USD Billion) |
    4. 4.4 Year-over-Year Growth Analysis
  5. 5 Segmentation Analysis |
    1. 5.1 By Gas Type | |
      1. 5.1.1 Liquid Nitrogen | |
      2. 5.1.2 Liquid Oxygen | |
      3. 5.1.3 Liquid Argon | |
      4. 5.1.4 Liquid Helium | |
      5. 5.1.5 Liquid Hydrogen | |
      6. 5.1.6 LNG |
    2. 5.2 By Equipment Type | |
      1. 5.2.1 Tanks | |
      2. 5.2.2 Pumps | |
      3. 5.2.3 Heat Exchangers | |
      4. 5.2.4 Valves and Regulators | |
      5. 5.2.5 Others |
    3. 5.3 By Application | |
      1. 5.3.1 Storage | |
      2. 5.3.2 Transportation and Distribution | |
      3. 5.3.3 Others |
    4. 5.4 By End-User Industry | |
      1. 5.4.1 Oil and Gas | |
      2. 5.4.2 Electronics and Semiconductors | |
      3. 5.4.3 Healthcare | |
      4. 5.4.4 Metals and Mining | |
      5. 5.4.5 Aerospace and Defense | |
      6. 5.4.6 Others
  6. 6 Regional Analysis |
    1. 6.1 North America | |
      1. 6.1.1 United States | |
      2. 6.1.2 Canada | |
      3. 6.1.3 Mexico |
    2. 6.2 Europe | |
      1. 6.2.1 Germany | |
      2. 6.2.2 United Kingdom | |
      3. 6.2.3 France | |
      4. 6.2.4 Italy | |
      5. 6.2.5 Spain | |
      6. 6.2.6 Nordic Countries | |
      7. 6.2.7 Russia | |
      8. 6.2.8 Rest of Europe |
    3. 6.3 Asia-Pacific | |
      1. 6.3.1 China | |
      2. 6.3.2 India | |
      3. 6.3.3 Japan | |
      4. 6.3.4 South Korea | |
      5. 6.3.5 ASEAN | |
      6. 6.3.6 Rest of Asia-Pacific |
    4. 6.4 South America | |
      1. 6.4.1 Brazil | |
      2. 6.4.2 Argentina | |
      3. 6.4.3 Rest of South America |
    5. 6.5 Middle East & Africa | |
      1. 6.5.1 Saudi Arabia | |
      2. 6.5.2 UAE | |
      3. 6.5.3 South Africa | |
      4. 6.5.4 Egypt | |
      5. 6.5.5 Rest of MEA
  7. 7 Competitive Landscape |
    1. 7.1 Market Share Analysis (2025) |
    2. 7.2 Competitive Benchmarking Matrix |
    3. 7.3 Company Profiles | |
      1. 7.3.1 Linde plc | |
      2. 7.3.2 Air Liquide S.A. | |
      3. 7.3.3 Chart Industries Inc. | |
      4. 7.3.4 Air Products and Chemicals Inc. | |
      5. 7.3.5 Emerson Electric Co. | |
      6. 7.3.6 Parker Hannifin Corporation | |
      7. 7.3.7 Flowserve Corporation | |
      8. 7.3.8 INOX India Limited | |
      9. 7.3.9 Taylor-Wharton International | |
      10. 7.3.10 Wessington Cryogenics Ltd.
  8. 8 Future Outlook & Strategic Recommendations (2026–2035) |
    1. 8.1 Digitization and Autonomous Cryogenic Operations |
    2. 8.2 Hydrogen as the Structural Growth Vector |
    3. 8.3 Electrification Supercycle and Grid-Scale Energy Storage |
    4. 8.4 ESG Reporting and Methane-Emission Reduction
  9. 9 Recent Developments & News
  10. 10 Frequently Asked Questions (FAQs)
  11. 11 Report Scope & Methodology |
    1. 11.1 Study Period & Base Year |
    2. 11.2 Data Sources & Citations |
    3. 11.3 Abbreviations
  12. 12 LIST OF TABLES |
  13. TABLE 1 Global Cryogenic Equipment Market Size & Forecast, by Revenue (USD Billion), 2021–2035 |
  14. TABLE 2 Global Cryogenic Equipment Market – Year-over-Year Growth Analysis, 2021–2035 |
  15. TABLE 3 Driver Impact Analysis – Cryogenic Equipment Market |
  16. TABLE 4 Restraint Impact Analysis – Cryogenic Equipment Market |
  17. TABLE 5 Regional Market Share Summary – Cryogenic Equipment Market, 2025 |
  18. TABLE 6 North America Cryogenic Equipment Market, by Country, 2021–2035 |
  19. TABLE 7 Europe Cryogenic Equipment Market, by Country, 2021–2035 |
  20. TABLE 8 Asia-Pacific Cryogenic Equipment Market, by Country, 2021–2035 |
  21. TABLE 9 South America Cryogenic Equipment Market, by Country, 2021–2035 |
  22. TABLE 10 Middle East & Africa Cryogenic Equipment Market, by Country, 2021–2035 |
  23. TABLE 11 Global Cryogenic Equipment Market Size, by Gas Type, 2021–2035 |
  24. TABLE 12 Global Cryogenic Equipment Market Size, by Equipment Type, 2021–2035 |
  25. TABLE 13 Global Cryogenic Equipment Market Size, by Application, 2021–2035 |
  26. TABLE 14 Global Cryogenic Equipment Market Size, by End-User Industry, 2021–2035 |
  27. TABLE 15 Competitive Benchmarking Matrix – Global Cryogenic Equipment Market, 2025 |
  28. TABLE 16 Company Profiles – Key Players, Global Cryogenic Equipment Market |
  29. TABLE 17 Recent Developments & Strategic Announcements, 2023–2025 |
  30. TABLE 18 Report Scope & Methodology Summary |
  31. TABLE 19 Detailed Sources and Citations
  32. 13 LIST OF FIGURES |
  33. FIGURE 1 Global Cryogenic Equipment Market Dynamics (Drivers, Restraints, Opportunities) |
  34. FIGURE 2 Industry Value Chain Analysis – Cryogenic Equipment Market |
  35. FIGURE 3 Porter's Five Forces Analysis – Cryogenic Equipment Market |
  36. FIGURE 4 Global Cryogenic Equipment Market Size Trend (USD Billion), 2021–2035 |
  37. FIGURE 5 Cryogenic Equipment Market Share, by Gas Type (%), 2025 |
  38. FIGURE 6 Cryogenic Equipment Market Share, by Equipment Type (%), 2025 |
  39. FIGURE 7 Cryogenic Equipment Market Share, by Application (%), 2025 |
  40. FIGURE 8 Cryogenic Equipment Market Share, by End-User Industry (%), 2025 |
  41. FIGURE 9 Cryogenic Equipment Market Share, by Region (%), 2025 |
  42. FIGURE 10 North America Cryogenic Equipment Market Share, by Country (%), 2025 |
  43. FIGURE 11 Europe Cryogenic Equipment Market Share, by Country (%), 2025 |
  44. FIGURE 12 Asia-Pacific Cryogenic Equipment Market Share, by Country (%), 2025 |
  45. FIGURE 13 South America Cryogenic Equipment Market Share, by Country (%), 2025 |
  46. FIGURE 14 Middle East & Africa Cryogenic Equipment Market Share, by Country (%), 2025 |
  47. FIGURE 15 Competitive Landscape – Market Share of Top 10 Players (%), 2025

Segmentation Quick Reference

DimensionSub-SegmentsDominant SegmentFastest Growing Segment
Gas TypeLiquid Nitrogen, Liquid Oxygen, Liquid Argon, Liquid Helium, Liquid Hydrogen, LNGLNGLiquid Hydrogen
Equipment TypeTanks, Pumps, Heat Exchangers, Valves and Regulators, OthersTanksHeat Exchangers
ApplicationStorage, Transportation and Distribution, OthersStorageTransportation and Distribution
End-User IndustryOil and Gas, Electronics and Semiconductors, Healthcare, Metals and Mining, Aerospace and Defense, OthersOil and GasAerospace and Defense
RegionNorth America, Europe, Asia-Pacific, South America, Middle East & AfricaAsia-PacificAsia-Pacific


Market Segmentation Overview

By Gas Type

Sub-SegmentKey Trend
Liquid NitrogenExpanding use in semiconductor wafer processing and rapid food-freezing applications
Liquid OxygenPost-pandemic medical infrastructure investment sustaining demand growth
Liquid ArgonGrowing adoption in advanced welding and additive-manufacturing shielding
Liquid HeliumSupply constraints driving recycling-system adoption and alternative-coolant R&D
Liquid HydrogenNational hydrogen strategies in 40+ countries accelerating liquefaction-plant orders
LNGRecord-high global LNG trade volumes driving terminal equipment procurement


The gas-type segmentation reflects the diversity of cryogenic temperature ranges and purity requirements across industries. LNG dominates by revenue share due to the capital intensity of liquefaction and regasification infrastructure, while Liquid Hydrogen is emerging as the structural growth story tied to global decarbonization ambitions.

By Equipment Type

Sub-SegmentKey Trend
TanksShift from field-erected to modular pre-fabricated designs reducing installation timelines
PumpsDemand for higher-flow submerged cryogenic pumps at LNG loading terminals
Heat ExchangersIncreasing adoption of brazed-aluminum designs for compact, high-efficiency applications
Valves and RegulatorsSmart-valve integration with IoT monitoring platforms for predictive maintenance
OthersGrowth in specialty piping, insulation systems, and cryogenic instrumentation


Equipment-type segmentation captures the full value chain of cryogenic systems from storage through process control. Tanks remain the largest category by revenue, but Heat Exchangers are gaining share as LNG processing complexity increases and hydrogen-liquefaction plants require purpose-built exchanger designs.

By Application

Sub-SegmentKey Trend
StorageFull-containment tank designs gaining specification preference for safety compliance
Transportation and DistributionSmall-scale LNG and virtual-pipeline logistics expanding in off-grid regions
OthersLaboratory, aerospace, and process-cooling applications diversifying demand


Application segmentation distinguishes between static-asset demand (storage) and dynamic-logistics demand (transportation and distribution). The transportation segment is growing faster as distributed energy models and virtual-pipeline concepts bring cryogenic logistics to regions without pipeline infrastructure.

By End-User Industry

Sub-SegmentKey Trend
Oil and GasLNG export-capacity buildout driving bulk of upstream and midstream equipment demand
Electronics and SemiconductorsCHIPS Act and equivalent programs in Japan, EU creating fab-level gas infrastructure demand
HealthcareMedical-oxygen plant construction accelerating across low- and middle-income countries
Metals and MiningSteel-sector decarbonization shifting oxygen supply from on-site ASUs to bulk cryogenic delivery
Aerospace and DefenseRising commercial-launch cadence increasing liquid-propellant infrastructure requirements
OthersFood-freezing, energy storage, and research applications contributing incremental demand


End-user segmentation reveals the cross-industry nature of cryogenic equipment demand. Oil and Gas dominates through the LNG value chain, but the fastest growth is occurring in Aerospace and Defense, driven by the commercial space industry's surge in launch frequency and propellant consumption.




Download PDF ×

We do not share your information with anyone. However, we may send you emails based on your report interest from time to time. You may contact us at any time to opt-out.