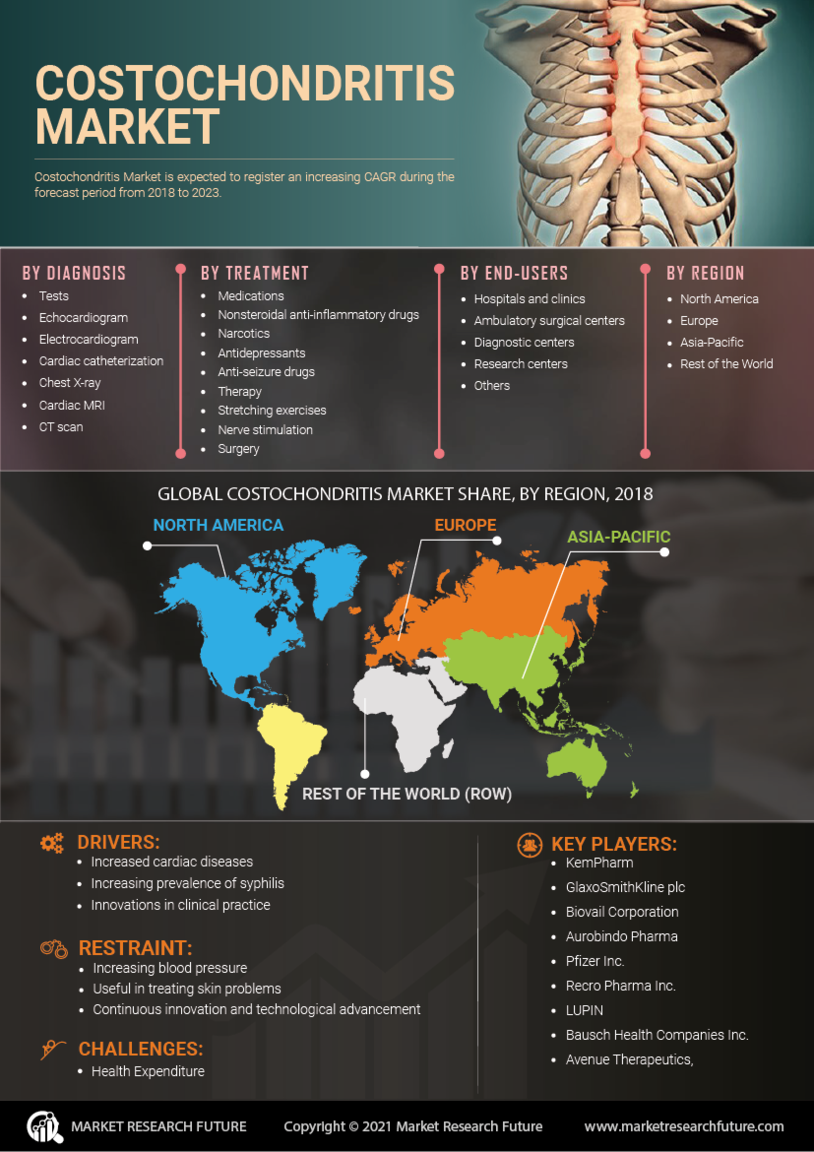
Costochondritis Market Research Report – Forecast to 2030

Costochondritis Market Research Report, by Diagnosis (Cardiac MRI Tests, CT scan), Treatment (Medications and Surgery), End-User (Hospitals and Clinics, Ambulatory Surgical Centers, Diagnostic Centers, Research Centers) – Forecast Till 2030

ID: MRFR/Pharma/5038-HCR | 90 Pages | Author: Rahul Gotadki | March 2024         

TABLE OF CONTENT

Chapter 1. Report Prologue

Chapter 2. Market Introduction

2.1 Definition

2.2 Scope of the Study

2.2.1 Research Objective

2.2.2 Assumptions

2.2.3 Limitations

Chapter 3. Research Methodology

3.1 Introduction

3.2 Primary Research

3.3 Secondary Research

3.4 Market Size Estimation

Chapter 4. Market Dynamics

4.1 Drivers

4.2 Restraints

4.3 Opportunities

4.4 Challenges

4.5 Macroeconomic Indicators

4.6 Technology Trends & Assessment

Chapter 5. Market Factor Analysis

5.1 Porter’s Five Forces Analysis

5.1.1 Bargaining Power of Suppliers

5.1.2 Bargaining Power of Buyers

5.1.3 Threat of New Entrants

5.1.4 Threat of Substitutes

5.1.5 Intensity of Rivalry

5.2 Value Chain Analysis

5.3 Investment Feasibility Analysis

5.4 Pricing Analysis

Chapter 6. Global Costochondritis Market, by Diagnosis

6.1 Introduction

6.2 Tests

6.2.1 Echocardiogram

6.2.2 Electrocardiogram

6.2.3 Cardiac catheterization

6.2.4 Chest X-ray

6.2.5 Cardiac MRI

6.2.6 CT scan

Chapter 7. Global Costochondritis Market, by Treatment

7.1 Introduction

7.2 Medications

7.2.1 Nonsteroidal anti-inflammatory drugs

7.2.2 Narcotics

7.2.3 Antidepressants

7.2.4 Anti-seizure drugs

7.3 Therapy

7.3.1 Stretching exercises

7.3.2 Nerve stimulation

7.4 Surgery

Chapter 8. Global Costochondritis Market, by End-Users

8.1 Introduction

8.2 Hospitals and clinics

8.3 Ambulatory Surgical Centers

8.4 Diagnostic Centers

8.5 Research centers

8.6 Others

Chapter 9. Global Costochondritis Market, by Region

9.1 Introduction

9.2 America

9.2.1 North America

9.2.1.1 US

9.2.1.2 Canada

9.2.2 South America

9.3 Europe

9.3.1 Western Europe

9.3.1.1 Germany

9.3.1.2 France

9.3.1.3 Italy

9.3.1.4 Spain

9.3.1.5 UK

9.3.1.6 Rest of Western Europe

9.3.2 Eastern Europe

9.4 Asia-Pacific

9.4.1 Japan

9.4.2 China

9.4.3 India

9.4.4 Australia

9.4.5 Republic of Korea

9.4.6 Rest of Asia-Pacific

9.5 Middle East & Africa

9.5.1 United Arab Emirates

9.5.2 Saudi Arabia

9.5.3 Oman

9.5.4 Kuwait

9.5.5 Qatar

9.5.6 Rest of the Middle East & Africa

Chapter 10. Company Landscape

10.1 Introduction

10.2 Market Share Analysis

10.3 Key Development & Strategies

10.3.1 Key Developments

Chapter 11 Company Profiles

11.1 KemPharm

11.1.1 Company Overview

11.1.2 Type Overview

11.1.3 Financials

11.2.4 Key Developments

11.1.5 SWOT Analysis

11.2 GlaxoSmithKline plc

11.2.1 Company Overview

11.2.2 Type Overview

11.2.3 Financial Overview

11.2.4 Key Developments

11.2.5 SWOT Analysis

11.3 Biovail Corporation

11.3.1 Company Overview

11.3.2 Type Overview

11.3.3 Financial Overview

11.3.4 Key Development

11.3.5 SWOT Analysis

11.4 Aurobindo Pharma

11.4.1 Company Overview

11.4.2 Type/Business Segment Overview

11.4.3 Financial Overview

11.4.4 Key Development

11.4.5 SWOT Analysis

11.5 Pfizer Inc.

11.5.1 Company Overview

11.5.2 Type Overview

11.5.3 Financial overview

11.5.4 Key Developments

11.5.5 SWOT Analysis

11.6 Recro Pharma Inc.

11.6.1 Company Overview

11.6.2 Type Overview

11.6.3 Financial Overview

11.6.4 Key Developments

11.6.5 SWOT Analysis

11.7 LUPIN

11.7.1 Overview

11.7.2 Type Overview

11.7.3 Financials

11.7.4 Key Developments

11.7.5 SWOT Analysis

11.8 BAUSCH HEALTH COMPANIES INC.

11.8.1 Overview

11.8.2 Type Overview

11.8.3 Financials

11.8.4 Key Developments

11.8.5 SWOT Analysis

11.9 Avenue Therapeutics

11.9.1 Overview

11.9.2 Type Overview

11.9.3 Financials

11.9.4 Key Developments

11.9.5 SWOT Analysis

11.10 Others

Chapter 12 Appendix

LIST OF TABLES

Table 1 Global Costochondritis Market Industry Synopsis, 2020–2027

Table 2 Global Costochondritis Market Estimates & Forecast, 2020–2027, (USD Million)

Table 3 Global Costochondritis Market, by Region, 2020–2027, (USD Million)

Table 4 Global Costochondritis Market, by Diagnosis, 2020–2027, (USD Million)

Table 5 Global Costochondritis Market, by Treatment, 2020–2027, (USD Million)

Table 6 Global Costochondritis Market, by End-User, 2020–2027, (USD Million)

Table 7 North America: Global Costochondritis Market, by Diagnosis, 2020–2027, (USD Million)

Table 8 North America: Global Costochondritis Market, by Treatment, 2020–2027, (USD Million)

Table 9 North America: Global Costochondritis Market, by End-User, 2020–2027, (USD Million)

Table 10 US: Global Costochondritis Market, by Diagnosis, 2020–2027, (USD Million)

Table 11 US: Global Costochondritis Market, by Treatment, 2020–2027, (USD Million)

Table 12 US: Global Costochondritis Market, by End-User, 2020–2027, (USD Million)

Table 13 Canada: Global Costochondritis Market, by Diagnosis, 2020–2027, (USD Million)

Table 14 Canada: Global Costochondritis Market, by Treatment, 2020–2027, (USD Million)

Table 15 Canada: Global Costochondritis Market, by End-User, 2020–2027, (USD Million)

Table 16 South America: Global Costochondritis Market, by Diagnosis, 2020–2027, (USD Million)

Table 17 South America: Global Costochondritis Market, by Treatment, 2020–2027, (USD Million)

Table 18 South America: Global Costochondritis Market, by End-User, 2020–2027, (USD Million)

Table 19 Europe: Global Costochondritis Market, Diagnosis, 2020–2027, (USD Million)

Table 20 Europe: Global Costochondritis Market, by Treatment, 2020–2027, (USD Million)

Table 21 Europe: Global Costochondritis Market, by End-User, 2020–2027, (USD Million)

Table 22 Western Europe: Global Costochondritis Market, by Diagnosis, 2020–2027, (USD Million)

Table 23 Western Europe: Global Costochondritis Market, by Treatment, 2020–2027, (USD Million)

Table 24 Western Europe: Global Costochondritis Market, by End-User, 2020–2027, (USD Million)

Table 25 Eastern Europe: Global Costochondritis Market, by Diagnosis, 2020–2027, (USD Million)

Table 26 Eastern Europe: Global Costochondritis Market, by Treatment, 2020–2027, (USD Million)

Table 27 Eastern Europe: Global Costochondritis Market, by End-User, 2020–2027, (USD Million)

Table 28 Asia-Pacific: Global Costochondritis Market, by Diagnosis, 2020–2027, (USD Million)

Table 29 Asia-Pacific: Global Costochondritis Market, by Treatment, 2020–2027, (USD Million)

Table 30 Asia-Pacific: Global Costochondritis Market, by End-User, 2020–2027, (USD Million)

Table 31 Middle East & Africa: Global Costochondritis Market, by Diagnosis, 2020–2027, (USD Million)

Table 32 Middle East & Africa: Global Costochondritis Market, by Treatment, 2020–2027, (USD Million)

Table 33 Middle East & Africa: Global Costochondritis Market, by End-User, 2020–2027, (USD Million)

LIST OF FIGURES

Figure 1 Research Process

Figure 2 Segmentation for the Global Costochondritis Market

Figure 3 Market Dynamics for the Global Costochondritis Market

Figure 4 Global Costochondritis Market Share, by diagnosis 2020

Figure 6 Global Costochondritis Market Share, by treatment, 2020

Figure 6 Global Costochondritis Market Share, by End-User, 2020

Figure 7 Global Costochondritis Market Share, by Region, 2020

Figure 8 North America Costochondritis Market Share, by Country, 2020

Figure 9 Europe Prescribed Health Apps Share, by Country, 2020

Figure 10 Asia-Pacific Costochondritis Market Share, by Country, 2020

Figure 11 Middle East & Africa Costochondritis Market Share, by Country, 2020

Figure 12 Global Costochondritis Market: Company Share Analysis, 2020 (%)

Figure 13 KemPharm: Key Financials

Figure 14 KemPharm: Segmental Revenue

Figure 15 KemPharm: Geographical Revenue

Figure 16 GlaxoSmithKline plc: Key Financials

Figure 17 GlaxoSmithKline plc: Segmental Revenue

Figure 18 GlaxoSmithKline plc: Geographical Revenue

Figure 19 Biovail Corporation: Key Financials

Figure 20 Biovail Corporation: Segmental Revenue

Figure 21 Biovail Corporation: Geographical Revenue

Figure 22 Aurobindo Pharma: Key Financials

Figure 23 Aurobindo Pharma: Segmental Revenue

Figure 24 Aurobindo Pharma: Geographical Revenue

Figure 25 Pfizer Inc.: Key Financials

Figure 26 Pfizer Inc.: Segmental Revenue

Figure 27 Pfizer Inc.: Geographical Revenue

Figure 28 Recro Pharma Inc.: Key Financials

Figure 29 Recro Pharma Inc.: Segmental Revenue

Figure 30 Recro Pharma Inc.: Geographical Revenue

Figure 31 LUPIN: Key Financials

Figure 32 LUPIN: Segmental Revenue

Figure 33 LUPIN: Geographical Revenue

Figure 34 Bausch Health Companies Inc.: Key Financials

Figure 35 Bausch Health Companies Inc.: Segmental Revenue

Figure 36 Bausch Health Companies Inc.: Geographical Revenue

Figure 37 Avenue Therapeutics: Key Financials

Figure 38 Avenue Therapeutics: Segmental Revenue

Figure 39 Avenue Therapeutics: Geographical Revenue

Leading companies partner with us for data-driven Insights.
Report List icon Report List icon Report List icon Report List icon Report List icon Report List icon Report List icon Report List icon Report List icon Report List icon Report List icon

Kindly complete the form below to receive a free sample of this Report

Please fill in Business Email for Quick Response
Invalid