×
  • Cat-intel
  • MedIntelliX
  • Resources
  • About Us
  • Hero Background
    English
    Chinese
    French
    Japanese
    Korean
    German
    Spanish

    Continuous Positive Airway Pressure Devices Market Size

    ID: MRFR/MED/0433-HCR
    80 Pages
    Kinjoll Dey
    October 2025

    Continuous Positive Airway Pressure (CPAP) Devices Market Research Report Information: By Product Type (CPAP Motors, CPAP Hoses, CPAP Mask, others), Features (Humidifier, Portability, Heated Tubing), Automation (Manual, Automatic) & End User (Hospitals, Private Clinics, Home Care) - Forecast till 2035

    Share:
    Download PDF ×

    We do not share your information with anyone. However, we may send you emails based on your report interest from time to time. You may contact us at any time to opt-out.

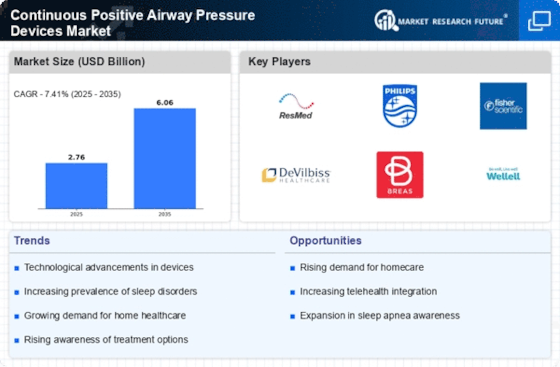
    Continuous Positive Airway Pressure Devices Market Infographic
    Purchase Options

    Continuous Positive Airway Pressure Devices Size

    Continuous Positive Airway Pressure Devices Market Growth Projections and Opportunities

    The Continuous Positive Airway Pressure (CPAP) devices market is influenced by various market factors that play a crucial role in shaping its dynamics. One of the primary drivers of this market is the rising prevalence of sleep apnea and other respiratory disorders. As awareness about these conditions grows, there is an increased demand for effective treatment options, with CPAP devices emerging as a preferred choice. The aging population is another significant factor contributing to the market's expansion, as elderly individuals are more susceptible to respiratory issues, thus driving the need for CPAP therapy.

    Technological advancements represent a pivotal market factor, continually enhancing the functionality and comfort of CPAP devices. Innovations such as quieter motors, compact designs, and smart features are gaining traction, improving patient compliance and overall satisfaction. Additionally, the integration of connectivity options, allowing remote monitoring by healthcare providers, has further augmented the market's appeal.

    Government initiatives and healthcare policies also significantly impact the CPAP devices market. Supportive regulations, reimbursement programs, and awareness campaigns contribute to increased adoption of these devices. The recognition of sleep apnea as a serious health concern by healthcare authorities globally has led to the inclusion of CPAP therapy in various treatment guidelines, positively influencing market growth.

    Economic factors, including disposable income and healthcare expenditure, play a role in shaping the CPAP devices market. As economies develop, individuals are more willing to invest in their health, leading to increased sales of CPAP devices. However, cost remains a significant concern, especially in developing regions, where affordability can hinder widespread adoption. Manufacturers are increasingly focusing on developing cost-effective solutions to address this challenge and tap into emerging markets.

    Market competition and the presence of a diverse range of CPAP devices contribute to market dynamics. The existence of various players, each offering unique features and pricing strategies, fosters competition and innovation. This competitive landscape not only benefits consumers by providing them with choices but also drives manufacturers to improve their products continually.

    The COVID-19 pandemic has had a dual impact on the CPAP devices market. On one hand, the increased awareness of respiratory health and the potential complications associated with infections has highlighted the importance of CPAP therapy. On the other hand, disruptions in the supply chain and healthcare priorities shifting towards pandemic management have posed challenges for market growth.

    Consumer preferences and lifestyle changes also influence the CPAP devices market. As individuals become more health-conscious and seek non-invasive treatment options, the demand for CPAP devices is likely to witness an upward trajectory. Moreover, the convenience of home-based therapy compared to hospital stays has driven the preference for CPAP devices, contributing to market growth.
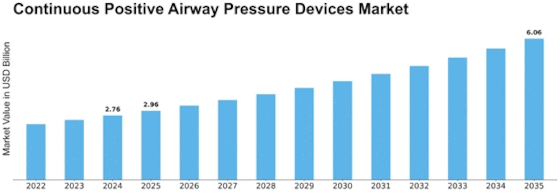
    Continuous Positive Airway Pressure Devices Market Size Graph
    Author
    Kinjoll Dey
    Research Analyst Level I

    He is an extremely curious individual currently working in Healthcare and Medical Devices Domain. Kinjoll is comfortably versed in data centric research backed by healthcare educational background. He leverages extensive data mining and analytics tools such as Primary and Secondary Research, Statistical Analysis, Machine Learning, Data Modelling. His key role also involves Technical Sales Support, Client Interaction and Project management within the Healthcare team. Lastly, he showcases extensive affinity towards learning new skills and remain fascinated in implementing them.

    Leave a Comment

    FAQs

    What are CPAP Devices?

    CPAP devices are widely used to treat sleep apnea and exert a positive pressure inside the patient’s respiratory tract in order to prevent snoring and other breathing-related problems.

    What is the CAGR of the Continuous Positive Airway Pressure (CPAP) Devices Market?

    The Continuous Positive Airway Pressure (CPAP) Devices Market is expected to exhibit a strong 7.45% CAGR over the forecast period from 2024 to 2032.

    What is the major driver for the Continuous Positive Airway Pressure (CPAP) Devices Market?

    Growing prevalence of sleep apnea is the major driver for the Continuous Positive Airway Pressure (CPAP) Devices Market.

    Which is the leading regional Continuous Positive Airway Pressure (CPAP) Devices Market?

    The Americas hold the largest share in the Global Continuous Positive Airway Pressure (CPAP) Devices Market.

    What are the leading Continuous Positive Airway Pressure (CPAP) Devices Market players?

    Leading players in the CPAP devices market include Koninklijke Philips, Medtronic, and 3B Medical, among others.

    Market Summary

    As per MRFR analysis, the Continuous Positive Airway Pressure Devices Market was estimated at 2.76 USD Billion in 2024. The Continuous Positive Airway Pressure Devices industry is projected to grow from 2.965 USD Billion in 2025 to 6.06 USD Billion by 2035, exhibiting a compound annual growth rate (CAGR) of 7.41 during the forecast period 2025 - 2035.

    Key Market Trends & Highlights

    The Continuous Positive Airway Pressure Devices Market is experiencing robust growth driven by technological advancements and increasing awareness of sleep disorders.

    • Technological advancements in CPAP devices are enhancing patient comfort and compliance, thereby driving market growth. North America remains the largest market for CPAP devices, while Asia-Pacific is emerging as the fastest-growing region. CPAP masks dominate the market, whereas CPAP motors are witnessing the fastest growth due to innovations in design and functionality. The rising prevalence of sleep apnea and increasing healthcare expenditure are key drivers propelling the market forward.

    Market Size & Forecast

    2024 Market Size 2.76 (USD Billion)
    2035 Market Size 6.06 (USD Billion)
    CAGR (2025 - 2035) 7.41%
    Largest Regional Market Share in 2024 North America

    Major Players

    <p><a href="https://newsroom.resmed.com/news-releases/news-details/2018/ResMeds-New-QuietAir-Diffuser-Vent-for-CPAP-Masks-Reduces-Noise-by-89-Percent/default.aspx">ResMed</a> (AU), Philips (NL), Fisher &amp; Paykel Healthcare (NZ), DeVilbiss Healthcare (US), Breas Medical (SE), Apex Medical (TW), Medtronic (US), Sleepnet Corporation (US)</p>

    Market Trends

    The Continuous Positive Airway Pressure Devices Market is currently experiencing a notable transformation, driven by advancements in technology and an increasing awareness of sleep-related disorders. The integration of smart technology into these devices appears to enhance patient compliance and comfort, which may lead to improved health outcomes. Furthermore, the growing prevalence of conditions such as obstructive sleep apnea is likely to propel demand for these devices, as healthcare providers seek effective solutions to manage these disorders. As a result, manufacturers are focusing on innovation, developing devices that are not only more efficient but also user-friendly, which could potentially reshape the competitive landscape of the market. In addition to technological advancements, the Continuous Positive Airway Pressure Devices Market is influenced by regulatory changes and evolving healthcare policies. Governments and health organizations seem to be placing greater emphasis on the importance of sleep health, which may lead to increased funding and support for research and development in this field. Moreover, the rise of telemedicine and remote monitoring solutions could facilitate better access to these devices, particularly in underserved regions. This evolving landscape suggests that the market is poised for growth, with opportunities for both established players and new entrants to capitalize on emerging trends and consumer needs.

    Technological Advancements

    The Continuous Positive Airway Pressure Devices Market is witnessing a surge in technological innovations. Manufacturers are increasingly incorporating smart features, such as connectivity and data tracking, into their devices. This trend appears to enhance user experience and adherence to therapy, as patients can monitor their progress and receive real-time feedback.

    Increased Awareness of Sleep Disorders

    There is a growing recognition of the impact of sleep disorders on overall health. This heightened awareness seems to drive demand for Continuous Positive Airway Pressure devices, as more individuals seek effective treatments for conditions like obstructive sleep apnea. Healthcare providers are likely to respond by recommending these devices more frequently.

    Regulatory Support and Policy Changes

    The regulatory environment surrounding sleep health is evolving, with governments and health organizations advocating for better sleep management solutions. This trend may lead to increased funding for research and development in the Continuous Positive Airway Pressure Devices Market, potentially fostering innovation and improving access to these essential devices.

    Continuous Positive Airway Pressure Devices Market Market Drivers

    Rising Healthcare Expenditure

    Rising healthcare expenditure is another critical driver influencing the Continuous Positive Airway Pressure Devices Market. As countries allocate more resources to healthcare, there is a corresponding increase in spending on medical devices, including CPAP machines. This trend is particularly evident in regions where healthcare reforms are underway, leading to improved access to treatment for sleep disorders. Increased funding for sleep studies and awareness campaigns further supports the growth of the market. Data indicates that healthcare spending is expected to rise significantly in the coming years, which may enhance the affordability and availability of CPAP devices. Consequently, this financial commitment to healthcare is likely to bolster the Continuous Positive Airway Pressure Devices Market.

    Increasing Geriatric Population

    The increasing geriatric population is a significant driver for the Continuous Positive Airway Pressure Devices Market. As individuals age, the likelihood of developing sleep apnea and other respiratory disorders escalates. According to demographic data, the global population aged 65 and older is projected to reach 1.5 billion by 2050, creating a substantial market for CPAP devices. Older adults often experience comorbidities that exacerbate sleep-related issues, necessitating effective management solutions. Healthcare systems are increasingly focusing on providing adequate care for this demographic, which includes the prescription of CPAP devices. This trend indicates a growing recognition of the importance of sleep health in the elderly, thereby driving demand within the Continuous Positive Airway Pressure Devices Market.

    Rising Prevalence of Sleep Apnea

    The rising prevalence of sleep apnea is a primary driver for the Continuous Positive Airway Pressure Devices Market. Studies indicate that approximately 22 million individuals in the United States suffer from sleep apnea, with a significant portion remaining undiagnosed. This condition, characterized by repeated interruptions in breathing during sleep, necessitates effective treatment options. As awareness of sleep disorders increases, more patients seek diagnosis and treatment, thereby propelling demand for CPAP devices. The market is projected to grow as healthcare providers emphasize the importance of managing sleep apnea to prevent associated health risks, such as cardiovascular diseases and diabetes. Consequently, the growing patient population is likely to stimulate innovation and expansion within the Continuous Positive Airway Pressure Devices Market.

    Growing Focus on Preventive Healthcare

    The growing focus on preventive healthcare is emerging as a vital driver for the Continuous Positive Airway Pressure Devices Market. As healthcare systems shift towards preventive measures, there is an increasing emphasis on early diagnosis and management of sleep disorders. This proactive approach encourages individuals to seek treatment before complications arise, thereby increasing the demand for CPAP devices. Public health initiatives aimed at educating the population about the risks associated with untreated sleep apnea are gaining traction. Market data suggests that this shift towards preventive healthcare is likely to result in higher adoption rates of CPAP devices, as patients become more aware of the importance of managing their sleep health. This trend is expected to significantly impact the Continuous Positive Airway Pressure Devices Market.

    Technological Innovations in CPAP Devices

    Technological innovations play a crucial role in shaping the Continuous Positive Airway Pressure Devices Market. Recent advancements have led to the development of more compact, user-friendly, and efficient CPAP devices. Features such as automatic pressure adjustments, integrated humidifiers, and connectivity with mobile applications enhance user experience and compliance. The introduction of smart CPAP devices, which monitor sleep patterns and provide real-time feedback, is particularly noteworthy. These innovations not only improve patient outcomes but also attract a broader consumer base. Market data suggests that the demand for technologically advanced CPAP devices is on the rise, with a notable increase in sales attributed to enhanced functionalities. As manufacturers continue to invest in research and development, the Continuous Positive Airway Pressure Devices Market is expected to witness sustained growth.

    Market Segment Insights

    By Product Type: CPAP Masks (Largest) vs. CPAP Motors (Fastest-Growing)

    <p>In the Continuous Positive Airway Pressure Devices Market, the product type segment shows a diverse distribution with CPAP masks dominating the landscape. They account for the largest share due to their fundamental role in delivering therapy to patients suffering from obstructive sleep apnea. Following them, CPAP motors and hoses, although smaller in comparison, play crucial roles in the functionality and efficiency of CPAP systems. The 'Others' category includes ancillary devices that, while not central, contribute to the overall market dynamics.</p>

    <p>CPAP Masks (Dominant) vs. CPAP Motors (Emerging)</p>

    <p>CPAP masks remain the dominant product type in the Continuous Positive Airway Pressure Devices Market, primarily because of their essential function in ensuring effective therapy delivery. They come in various styles, including nasal, full-face, and nasal pillow masks, addressing diverse patient needs and preferences. On the other hand, CPAP motors are emerging as a significant segment due to technological advancements that enhance operational efficiency and patient comfort. These motors are essential for the device's performance, and their growth is driven by increasing demand for quieter, compact, and energy-efficient solutions, allowing them to carve a niche in the market.</p>

    By Automation: Automatic (Largest) vs. Manual (Fastest-Growing)

    <p>In the Continuous Positive Airway Pressure (CPAP) Devices Market, the automation segment is led by Automatic devices, which account for the majority of the market share due to their advanced features and user-friendly designs. Automatic CPAPs adjust pressure levels automatically in response to the patient's breathing patterns, ensuring optimal therapy. In contrast, Manual CPAP devices hold a smaller share but are gaining traction among specific patient demographics seeking cost-effective solutions. This shift in preference is also indicative of broader trends in personal healthcare management, where patients increasingly desire control over their therapeutic options.</p>

    <p>Automation: Automatic (Dominant) vs. Manual (Emerging)</p>

    <p>Automatic CPAP devices dominate the market because they provide customizable pressure adjustments throughout the night, accommodating for varying respiratory needs. These devices are often equipped with advanced algorithms and data connectivity, enhancing patient adherence and comfort. In contrast, Manual CPAP devices, while offering cost advantages and simplicity, serve as an ideal choice for specific patient segments including those with stable conditions who prefer traditional settings. The emerging trends in manual devices are driven by increasing cost sensitivity among patients and efforts to expand access to therapy, showcasing a versatile landscape within the CPAP market.</p>

    By Features: Heated Tubing (Largest) vs. Humidifier (Fastest-Growing)

    <p>In the Continuous Positive Airway Pressure (CPAP) Devices Market, the features segment is diverse, with heated tubing holding a significant market share. This segment benefits from technological advancements that enhance patient comfort and compliance. Following this, humidifiers have emerged as a crucial feature, appealing to users who prioritize respiratory comfort. As patients increasingly seek therapeutic benefits, these features have become more integral to device offerings, thereby shaping market dynamics.</p>

    <p>Heated Tubing (Dominant) vs. Humidifier (Emerging)</p>

    <p>Heated tubing is recognized as the dominant feature within the CPAP devices market, providing essential benefits such as consistent temperature control and reduced condensation, which ultimately enhances user experience. By contrast, humidifiers are emerging as a vital complement to CPAP devices, rapidly gaining traction due to their ability to alleviate dryness and irritation during therapy. The growing preference for personalized patient care is shifting market demand towards features like humidifiers, which cater specifically to comfort and usability. Both features underline a trend towards improving user experience and adherence to therapy, highlighting their unique positions in the market.</p>

    By End-user: Home Care (Largest) vs. Hospitals (Fastest-Growing)

    <p>In the Continuous Positive Airway Pressure (CPAP) Devices Market, the distribution of market share among end-users shows that the home care segment is the largest contributor, significantly due to the increasing preference for at-home treatment solutions. Hospitals and private clinics follow, with a considerable share that reflects the reliance on these facilities for acute patient care. Moreover, the segment labeled 'Others' also plays a role, providing niche applications that cater to varied patient needs across different environments.</p>

    <p>Home Care (Dominant) vs. Hospitals (Emerging)</p>

    <p>The home care segment is dominant within the CPAP devices market, characterized by its strong customer base of patients requiring long-term management of sleep apnea and other respiratory conditions in familiar settings. The rise in home healthcare services, coupled with patients' preference for convenience, has propelled this segment. Conversely, hospitals represent an emerging segment, witnessing rapid growth due to advancements in technology and increasing patient admissions requiring immediate respiratory support. Hospitals often leverage cutting-edge CPAP devices to enhance patient outcomes, making this sector potentially the fastest-growing within the overall market.</p>

    Get more detailed insights about Continuous Positive Airway Pressure (CPAP) Devices Market Research Report - Forecast till 2035

    Regional Insights

    Key Companies in the Continuous Positive Airway Pressure Devices Market market include

    Industry Developments

    March 2024: ResMed (US) launched AirFit F40 ultra-compact, CPAP mask. This product will help with sleep apnea therapy compliance for users of high-pressure continuous positive airway pressure (CPAP) treatment. February 2024: ResMed (US) launched a new bi-level sleep apnea device AirCurve 11 as a CPAP alternative. The AirCurve 11 device, which is compatible with all ResMed’s masks, is currently available in the US with an international rollout on deck.

    Continuous Positive Airway Pressure (CPAP) Devices Market Trends

    CPAP industry Drivers

    A few factors may drive the continuous positive airway pressure devices market growth. The rising cases of obesity, sleep apnea, and Covid-19 around the world have led to a demand for breathing aid devices. However, this may also lead to high healthcare expenditure. Hence, CPAP devices serve as the ideal alternative to conventional breathing aids. These factors are expected to fuel the global market growth.

    CPAP industry Opportunities

    The major companies that account for the largest CPAP devices market share adopt various market trends such as new product launches in the field. The advancements in technology and research are adding to its growth. Moreover, most companies are also adopting R&D market trends. Hence, these factors serve as opportunities for global CPAP devices market growth.

    CPAP industry Restraints

    There are a few factors that may inhibit the growth of the continuous positive airway pressure devices industry. One of the most important of them is the high cost of the CPAP devices. They are often not affordable for everyone. Moreover, the use of these devices also has adverse effects on the patients. Hence, these factors may hinder the CPAP devices market growth in the long run.

    CPAP industry Challenges

    Most patients who use the CPAP devices have reported that devices feel uncomfortable and do not seem fit for everyday use. They also seem to have adverse side effects on the patients who use the device. Hence, the CPAP devices manufacturer companies often find it challenging to cater to the expectations of the consumers. This may slow down the continuous positive airway pressure devices market growth in the forecast period.

    CPAP industry Value Chain Analysis

    The continuous positive airway pressure devices market outlook is expected to be prosperous. This is because of the growing number of sleep apnea cases among the global population. The CPAP devices help increase the air pressure in the throat to prevent the airway from collapsing when breathing. These devices are suitable for everyday use at home while asleep.

    The CPAP devices are also available in two types of automation technology – manual and automatic. The automatic devices are run by automatically controlling the air pressure in the airway. The automatic CPAP device market is witnessed the fastest growth rate over the forecast years. Post the pandemic, people affected with Covid-19 often suffer from breathing issues. Hence, continuous positive airway pressure devices can be used to aid patients in breathing.

    Future Outlook

    Continuous Positive Airway Pressure Devices Market Future Outlook

    <p>The Continuous Positive Airway Pressure Devices Market is projected to grow at a 7.41% CAGR from 2024 to 2035, driven by increasing prevalence of sleep apnea and technological advancements.</p>

    New opportunities lie in:

    • <p>Expansion into telehealth services for remote patient monitoring.</p><p>Development of portable CPAP devices for travel convenience.</p><p>Partnerships with sleep clinics for integrated care solutions.</p>

    <p>By 2035, the market is expected to be robust, reflecting substantial growth and innovation.</p>

    Market Segmentation

    Continuous Positive Airway Pressure Devices Market End-user Outlook

    • Home care
    • Hospitals
    • Private clinics
    • Others

    Continuous Positive Airway Pressure Devices Market Features Outlook

    • Heated tubing
    • Humidifier
    • Portability
    • Others

    Continuous Positive Airway Pressure Devices Market Automation Outlook

    • Automatic
    • Manual

    Continuous Positive Airway Pressure Devices Market Product Type Outlook

    • CPAP mask
    • CPAP motors
    • CPAP hoses
    • Others

    Report Scope

    MARKET SIZE 20242.76(USD Billion)
    MARKET SIZE 20252.965(USD Billion)
    MARKET SIZE 20356.06(USD Billion)
    COMPOUND ANNUAL GROWTH RATE (CAGR)7.41% (2024 - 2035)
    REPORT COVERAGERevenue Forecast, Competitive Landscape, Growth Factors, and Trends
    BASE YEAR2024
    Market Forecast Period2025 - 2035
    Historical Data2019 - 2024
    Market Forecast UnitsUSD Billion
    Key Companies ProfiledMarket analysis in progress
    Segments CoveredMarket segmentation analysis in progress
    Key Market OpportunitiesIntegration of telehealth solutions enhances patient monitoring in the Continuous Positive Airway Pressure Devices Market.
    Key Market DynamicsTechnological advancements and regulatory changes drive innovation and competition in the Continuous Positive Airway Pressure Devices market.
    Countries CoveredNorth America, Europe, APAC, South America, MEA

    FAQs

    What are CPAP Devices?

    CPAP devices are widely used to treat sleep apnea and exert a positive pressure inside the patient’s respiratory tract in order to prevent snoring and other breathing-related problems.

    What is the CAGR of the Continuous Positive Airway Pressure (CPAP) Devices Market?

    The Continuous Positive Airway Pressure (CPAP) Devices Market is expected to exhibit a strong 7.45% CAGR over the forecast period from 2024 to 2032.

    What is the major driver for the Continuous Positive Airway Pressure (CPAP) Devices Market?

    Growing prevalence of sleep apnea is the major driver for the Continuous Positive Airway Pressure (CPAP) Devices Market.

    Which is the leading regional Continuous Positive Airway Pressure (CPAP) Devices Market?

    The Americas hold the largest share in the Global Continuous Positive Airway Pressure (CPAP) Devices Market.

    What are the leading Continuous Positive Airway Pressure (CPAP) Devices Market players?

    Leading players in the CPAP devices market include Koninklijke Philips, Medtronic, and 3B Medical, among others.

    1. SECTION I: EXECUTIVE SUMMARY AND KEY HIGHLIGHTS
      1. | 1.1 EXECUTIVE SUMMARY
      2. | | 1.1.1 Market Overview
      3. | | 1.1.2 Key Findings
      4. | | 1.1.3 Market Segmentation
      5. | | 1.1.4 Competitive Landscape
      6. | | 1.1.5 Challenges and Opportunities
      7. | | 1.1.6 Future Outlook
    2. SECTION II: SCOPING, METHODOLOGY AND MARKET STRUCTURE
      1. | 2.1 MARKET INTRODUCTION
      2. | | 2.1.1 Definition
      3. | | 2.1.2 Scope of the study
      4. | | | 2.1.2.1 Research Objective
      5. | | | 2.1.2.2 Assumption
      6. | | | 2.1.2.3 Limitations
      7. | 2.2 RESEARCH METHODOLOGY
      8. | | 2.2.1 Overview
      9. | | 2.2.2 Data Mining
      10. | | 2.2.3 Secondary Research
      11. | | 2.2.4 Primary Research
      12. | | | 2.2.4.1 Primary Interviews and Information Gathering Process
      13. | | | 2.2.4.2 Breakdown of Primary Respondents
      14. | | 2.2.5 Forecasting Model
      15. | | 2.2.6 Market Size Estimation
      16. | | | 2.2.6.1 Bottom-Up Approach
      17. | | | 2.2.6.2 Top-Down Approach
      18. | | 2.2.7 Data Triangulation
      19. | | 2.2.8 Validation
    3. SECTION III: QUALITATIVE ANALYSIS
      1. | 3.1 MARKET DYNAMICS
      2. | | 3.1.1 Overview
      3. | | 3.1.2 Drivers
      4. | | 3.1.3 Restraints
      5. | | 3.1.4 Opportunities
      6. | 3.2 MARKET FACTOR ANALYSIS
      7. | | 3.2.1 Value chain Analysis
      8. | | 3.2.2 Porter's Five Forces Analysis
      9. | | | 3.2.2.1 Bargaining Power of Suppliers
      10. | | | 3.2.2.2 Bargaining Power of Buyers
      11. | | | 3.2.2.3 Threat of New Entrants
      12. | | | 3.2.2.4 Threat of Substitutes
      13. | | | 3.2.2.5 Intensity of Rivalry
      14. | | 3.2.3 COVID-19 Impact Analysis
      15. | | | 3.2.3.1 Market Impact Analysis
      16. | | | 3.2.3.2 Regional Impact
      17. | | | 3.2.3.3 Opportunity and Threat Analysis
    4. SECTION IV: QUANTITATIVE ANALYSIS
      1. | 4.1 Healthcare, BY Product Type (USD Billion)
      2. | | 4.1.1 CPAP mask
      3. | | 4.1.2 CPAP motors
      4. | | 4.1.3 CPAP hoses
      5. | | 4.1.4 Others
      6. | 4.2 Healthcare, BY Automation (USD Billion)
      7. | | 4.2.1 Automatic
      8. | | 4.2.2 Manual
      9. | 4.3 Healthcare, BY Features (USD Billion)
      10. | | 4.3.1 Heated tubing
      11. | | 4.3.2 Humidifier
      12. | | 4.3.3 Portability
      13. | | 4.3.4 Others
      14. | 4.4 Healthcare, BY End-user (USD Billion)
      15. | | 4.4.1 Home care
      16. | | 4.4.2 Hospitals
      17. | | 4.4.3 Private clinics
      18. | | 4.4.4 Others
      19. | 4.5 Healthcare, BY Region (USD Billion)
      20. | | 4.5.1 North America
      21. | | | 4.5.1.1 US
      22. | | | 4.5.1.2 Canada
      23. | | 4.5.2 Europe
      24. | | | 4.5.2.1 Germany
      25. | | | 4.5.2.2 UK
      26. | | | 4.5.2.3 France
      27. | | | 4.5.2.4 Russia
      28. | | | 4.5.2.5 Italy
      29. | | | 4.5.2.6 Spain
      30. | | | 4.5.2.7 Rest of Europe
      31. | | 4.5.3 APAC
      32. | | | 4.5.3.1 China
      33. | | | 4.5.3.2 India
      34. | | | 4.5.3.3 Japan
      35. | | | 4.5.3.4 South Korea
      36. | | | 4.5.3.5 Malaysia
      37. | | | 4.5.3.6 Thailand
      38. | | | 4.5.3.7 Indonesia
      39. | | | 4.5.3.8 Rest of APAC
      40. | | 4.5.4 South America
      41. | | | 4.5.4.1 Brazil
      42. | | | 4.5.4.2 Mexico
      43. | | | 4.5.4.3 Argentina
      44. | | | 4.5.4.4 Rest of South America
      45. | | 4.5.5 MEA
      46. | | | 4.5.5.1 GCC Countries
      47. | | | 4.5.5.2 South Africa
      48. | | | 4.5.5.3 Rest of MEA
    5. SECTION V: COMPETITIVE ANALYSIS
      1. | 5.1 Competitive Landscape
      2. | | 5.1.1 Overview
      3. | | 5.1.2 Competitive Analysis
      4. | | 5.1.3 Market share Analysis
      5. | | 5.1.4 Major Growth Strategy in the Healthcare
      6. | | 5.1.5 Competitive Benchmarking
      7. | | 5.1.6 Leading Players in Terms of Number of Developments in the Healthcare
      8. | | 5.1.7 Key developments and growth strategies
      9. | | | 5.1.7.1 New Product Launch/Service Deployment
      10. | | | 5.1.7.2 Merger & Acquisitions
      11. | | | 5.1.7.3 Joint Ventures
      12. | | 5.1.8 Major Players Financial Matrix
      13. | | | 5.1.8.1 Sales and Operating Income
      14. | | | 5.1.8.2 Major Players R&D Expenditure. 2023
      15. | 5.2 Company Profiles
      16. | | 5.2.1 ResMed (AU)
      17. | | | 5.2.1.1 Financial Overview
      18. | | | 5.2.1.2 Products Offered
      19. | | | 5.2.1.3 Key Developments
      20. | | | 5.2.1.4 SWOT Analysis
      21. | | | 5.2.1.5 Key Strategies
      22. | | 5.2.2 Philips (NL)
      23. | | | 5.2.2.1 Financial Overview
      24. | | | 5.2.2.2 Products Offered
      25. | | | 5.2.2.3 Key Developments
      26. | | | 5.2.2.4 SWOT Analysis
      27. | | | 5.2.2.5 Key Strategies
      28. | | 5.2.3 Fisher & Paykel Healthcare (NZ)
      29. | | | 5.2.3.1 Financial Overview
      30. | | | 5.2.3.2 Products Offered
      31. | | | 5.2.3.3 Key Developments
      32. | | | 5.2.3.4 SWOT Analysis
      33. | | | 5.2.3.5 Key Strategies
      34. | | 5.2.4 DeVilbiss Healthcare (US)
      35. | | | 5.2.4.1 Financial Overview
      36. | | | 5.2.4.2 Products Offered
      37. | | | 5.2.4.3 Key Developments
      38. | | | 5.2.4.4 SWOT Analysis
      39. | | | 5.2.4.5 Key Strategies
      40. | | 5.2.5 Breas Medical (SE)
      41. | | | 5.2.5.1 Financial Overview
      42. | | | 5.2.5.2 Products Offered
      43. | | | 5.2.5.3 Key Developments
      44. | | | 5.2.5.4 SWOT Analysis
      45. | | | 5.2.5.5 Key Strategies
      46. | | 5.2.6 Apex Medical (TW)
      47. | | | 5.2.6.1 Financial Overview
      48. | | | 5.2.6.2 Products Offered
      49. | | | 5.2.6.3 Key Developments
      50. | | | 5.2.6.4 SWOT Analysis
      51. | | | 5.2.6.5 Key Strategies
      52. | | 5.2.7 Medtronic (US)
      53. | | | 5.2.7.1 Financial Overview
      54. | | | 5.2.7.2 Products Offered
      55. | | | 5.2.7.3 Key Developments
      56. | | | 5.2.7.4 SWOT Analysis
      57. | | | 5.2.7.5 Key Strategies
      58. | | 5.2.8 Sleepnet Corporation (US)
      59. | | | 5.2.8.1 Financial Overview
      60. | | | 5.2.8.2 Products Offered
      61. | | | 5.2.8.3 Key Developments
      62. | | | 5.2.8.4 SWOT Analysis
      63. | | | 5.2.8.5 Key Strategies
      64. | 5.3 Appendix
      65. | | 5.3.1 References
      66. | | 5.3.2 Related Reports
    6. LIST OF FIGURES
      1. | 6.1 MARKET SYNOPSIS
      2. | 6.2 NORTH AMERICA MARKET ANALYSIS
      3. | 6.3 US MARKET ANALYSIS BY PRODUCT TYPE
      4. | 6.4 US MARKET ANALYSIS BY AUTOMATION
      5. | 6.5 US MARKET ANALYSIS BY FEATURES
      6. | 6.6 US MARKET ANALYSIS BY END-USER
      7. | 6.7 CANADA MARKET ANALYSIS BY PRODUCT TYPE
      8. | 6.8 CANADA MARKET ANALYSIS BY AUTOMATION
      9. | 6.9 CANADA MARKET ANALYSIS BY FEATURES
      10. | 6.10 CANADA MARKET ANALYSIS BY END-USER
      11. | 6.11 EUROPE MARKET ANALYSIS
      12. | 6.12 GERMANY MARKET ANALYSIS BY PRODUCT TYPE
      13. | 6.13 GERMANY MARKET ANALYSIS BY AUTOMATION
      14. | 6.14 GERMANY MARKET ANALYSIS BY FEATURES
      15. | 6.15 GERMANY MARKET ANALYSIS BY END-USER
      16. | 6.16 UK MARKET ANALYSIS BY PRODUCT TYPE
      17. | 6.17 UK MARKET ANALYSIS BY AUTOMATION
      18. | 6.18 UK MARKET ANALYSIS BY FEATURES
      19. | 6.19 UK MARKET ANALYSIS BY END-USER
      20. | 6.20 FRANCE MARKET ANALYSIS BY PRODUCT TYPE
      21. | 6.21 FRANCE MARKET ANALYSIS BY AUTOMATION
      22. | 6.22 FRANCE MARKET ANALYSIS BY FEATURES
      23. | 6.23 FRANCE MARKET ANALYSIS BY END-USER
      24. | 6.24 RUSSIA MARKET ANALYSIS BY PRODUCT TYPE
      25. | 6.25 RUSSIA MARKET ANALYSIS BY AUTOMATION
      26. | 6.26 RUSSIA MARKET ANALYSIS BY FEATURES
      27. | 6.27 RUSSIA MARKET ANALYSIS BY END-USER
      28. | 6.28 ITALY MARKET ANALYSIS BY PRODUCT TYPE
      29. | 6.29 ITALY MARKET ANALYSIS BY AUTOMATION
      30. | 6.30 ITALY MARKET ANALYSIS BY FEATURES
      31. | 6.31 ITALY MARKET ANALYSIS BY END-USER
      32. | 6.32 SPAIN MARKET ANALYSIS BY PRODUCT TYPE
      33. | 6.33 SPAIN MARKET ANALYSIS BY AUTOMATION
      34. | 6.34 SPAIN MARKET ANALYSIS BY FEATURES
      35. | 6.35 SPAIN MARKET ANALYSIS BY END-USER
      36. | 6.36 REST OF EUROPE MARKET ANALYSIS BY PRODUCT TYPE
      37. | 6.37 REST OF EUROPE MARKET ANALYSIS BY AUTOMATION
      38. | 6.38 REST OF EUROPE MARKET ANALYSIS BY FEATURES
      39. | 6.39 REST OF EUROPE MARKET ANALYSIS BY END-USER
      40. | 6.40 APAC MARKET ANALYSIS
      41. | 6.41 CHINA MARKET ANALYSIS BY PRODUCT TYPE
      42. | 6.42 CHINA MARKET ANALYSIS BY AUTOMATION
      43. | 6.43 CHINA MARKET ANALYSIS BY FEATURES
      44. | 6.44 CHINA MARKET ANALYSIS BY END-USER
      45. | 6.45 INDIA MARKET ANALYSIS BY PRODUCT TYPE
      46. | 6.46 INDIA MARKET ANALYSIS BY AUTOMATION
      47. | 6.47 INDIA MARKET ANALYSIS BY FEATURES
      48. | 6.48 INDIA MARKET ANALYSIS BY END-USER
      49. | 6.49 JAPAN MARKET ANALYSIS BY PRODUCT TYPE
      50. | 6.50 JAPAN MARKET ANALYSIS BY AUTOMATION
      51. | 6.51 JAPAN MARKET ANALYSIS BY FEATURES
      52. | 6.52 JAPAN MARKET ANALYSIS BY END-USER
      53. | 6.53 SOUTH KOREA MARKET ANALYSIS BY PRODUCT TYPE
      54. | 6.54 SOUTH KOREA MARKET ANALYSIS BY AUTOMATION
      55. | 6.55 SOUTH KOREA MARKET ANALYSIS BY FEATURES
      56. | 6.56 SOUTH KOREA MARKET ANALYSIS BY END-USER
      57. | 6.57 MALAYSIA MARKET ANALYSIS BY PRODUCT TYPE
      58. | 6.58 MALAYSIA MARKET ANALYSIS BY AUTOMATION
      59. | 6.59 MALAYSIA MARKET ANALYSIS BY FEATURES
      60. | 6.60 MALAYSIA MARKET ANALYSIS BY END-USER
      61. | 6.61 THAILAND MARKET ANALYSIS BY PRODUCT TYPE
      62. | 6.62 THAILAND MARKET ANALYSIS BY AUTOMATION
      63. | 6.63 THAILAND MARKET ANALYSIS BY FEATURES
      64. | 6.64 THAILAND MARKET ANALYSIS BY END-USER
      65. | 6.65 INDONESIA MARKET ANALYSIS BY PRODUCT TYPE
      66. | 6.66 INDONESIA MARKET ANALYSIS BY AUTOMATION
      67. | 6.67 INDONESIA MARKET ANALYSIS BY FEATURES
      68. | 6.68 INDONESIA MARKET ANALYSIS BY END-USER
      69. | 6.69 REST OF APAC MARKET ANALYSIS BY PRODUCT TYPE
      70. | 6.70 REST OF APAC MARKET ANALYSIS BY AUTOMATION
      71. | 6.71 REST OF APAC MARKET ANALYSIS BY FEATURES
      72. | 6.72 REST OF APAC MARKET ANALYSIS BY END-USER
      73. | 6.73 SOUTH AMERICA MARKET ANALYSIS
      74. | 6.74 BRAZIL MARKET ANALYSIS BY PRODUCT TYPE
      75. | 6.75 BRAZIL MARKET ANALYSIS BY AUTOMATION
      76. | 6.76 BRAZIL MARKET ANALYSIS BY FEATURES
      77. | 6.77 BRAZIL MARKET ANALYSIS BY END-USER
      78. | 6.78 MEXICO MARKET ANALYSIS BY PRODUCT TYPE
      79. | 6.79 MEXICO MARKET ANALYSIS BY AUTOMATION
      80. | 6.80 MEXICO MARKET ANALYSIS BY FEATURES
      81. | 6.81 MEXICO MARKET ANALYSIS BY END-USER
      82. | 6.82 ARGENTINA MARKET ANALYSIS BY PRODUCT TYPE
      83. | 6.83 ARGENTINA MARKET ANALYSIS BY AUTOMATION
      84. | 6.84 ARGENTINA MARKET ANALYSIS BY FEATURES
      85. | 6.85 ARGENTINA MARKET ANALYSIS BY END-USER
      86. | 6.86 REST OF SOUTH AMERICA MARKET ANALYSIS BY PRODUCT TYPE
      87. | 6.87 REST OF SOUTH AMERICA MARKET ANALYSIS BY AUTOMATION
      88. | 6.88 REST OF SOUTH AMERICA MARKET ANALYSIS BY FEATURES
      89. | 6.89 REST OF SOUTH AMERICA MARKET ANALYSIS BY END-USER
      90. | 6.90 MEA MARKET ANALYSIS
      91. | 6.91 GCC COUNTRIES MARKET ANALYSIS BY PRODUCT TYPE
      92. | 6.92 GCC COUNTRIES MARKET ANALYSIS BY AUTOMATION
      93. | 6.93 GCC COUNTRIES MARKET ANALYSIS BY FEATURES
      94. | 6.94 GCC COUNTRIES MARKET ANALYSIS BY END-USER
      95. | 6.95 SOUTH AFRICA MARKET ANALYSIS BY PRODUCT TYPE
      96. | 6.96 SOUTH AFRICA MARKET ANALYSIS BY AUTOMATION
      97. | 6.97 SOUTH AFRICA MARKET ANALYSIS BY FEATURES
      98. | 6.98 SOUTH AFRICA MARKET ANALYSIS BY END-USER
      99. | 6.99 REST OF MEA MARKET ANALYSIS BY PRODUCT TYPE
      100. | 6.100 REST OF MEA MARKET ANALYSIS BY AUTOMATION
      101. | 6.101 REST OF MEA MARKET ANALYSIS BY FEATURES
      102. | 6.102 REST OF MEA MARKET ANALYSIS BY END-USER
      103. | 6.103 KEY BUYING CRITERIA OF HEALTHCARE
      104. | 6.104 RESEARCH PROCESS OF MRFR
      105. | 6.105 DRO ANALYSIS OF HEALTHCARE
      106. | 6.106 DRIVERS IMPACT ANALYSIS: HEALTHCARE
      107. | 6.107 RESTRAINTS IMPACT ANALYSIS: HEALTHCARE
      108. | 6.108 SUPPLY / VALUE CHAIN: HEALTHCARE
      109. | 6.109 HEALTHCARE, BY PRODUCT TYPE, 2024 (% SHARE)
      110. | 6.110 HEALTHCARE, BY PRODUCT TYPE, 2024 TO 2035 (USD Billion)
      111. | 6.111 HEALTHCARE, BY AUTOMATION, 2024 (% SHARE)
      112. | 6.112 HEALTHCARE, BY AUTOMATION, 2024 TO 2035 (USD Billion)
      113. | 6.113 HEALTHCARE, BY FEATURES, 2024 (% SHARE)
      114. | 6.114 HEALTHCARE, BY FEATURES, 2024 TO 2035 (USD Billion)
      115. | 6.115 HEALTHCARE, BY END-USER, 2024 (% SHARE)
      116. | 6.116 HEALTHCARE, BY END-USER, 2024 TO 2035 (USD Billion)
      117. | 6.117 BENCHMARKING OF MAJOR COMPETITORS
    7. LIST OF TABLES
      1. | 7.1 LIST OF ASSUMPTIONS
      2. | | 7.1.1
      3. | 7.2 North America MARKET SIZE ESTIMATES; FORECAST
      4. | | 7.2.1 BY PRODUCT TYPE, 2025-2035 (USD Billion)
      5. | | 7.2.2 BY AUTOMATION, 2025-2035 (USD Billion)
      6. | | 7.2.3 BY FEATURES, 2025-2035 (USD Billion)
      7. | | 7.2.4 BY END-USER, 2025-2035 (USD Billion)
      8. | 7.3 US MARKET SIZE ESTIMATES; FORECAST
      9. | | 7.3.1 BY PRODUCT TYPE, 2025-2035 (USD Billion)
      10. | | 7.3.2 BY AUTOMATION, 2025-2035 (USD Billion)
      11. | | 7.3.3 BY FEATURES, 2025-2035 (USD Billion)
      12. | | 7.3.4 BY END-USER, 2025-2035 (USD Billion)
      13. | 7.4 Canada MARKET SIZE ESTIMATES; FORECAST
      14. | | 7.4.1 BY PRODUCT TYPE, 2025-2035 (USD Billion)
      15. | | 7.4.2 BY AUTOMATION, 2025-2035 (USD Billion)
      16. | | 7.4.3 BY FEATURES, 2025-2035 (USD Billion)
      17. | | 7.4.4 BY END-USER, 2025-2035 (USD Billion)
      18. | 7.5 Europe MARKET SIZE ESTIMATES; FORECAST
      19. | | 7.5.1 BY PRODUCT TYPE, 2025-2035 (USD Billion)
      20. | | 7.5.2 BY AUTOMATION, 2025-2035 (USD Billion)
      21. | | 7.5.3 BY FEATURES, 2025-2035 (USD Billion)
      22. | | 7.5.4 BY END-USER, 2025-2035 (USD Billion)
      23. | 7.6 Germany MARKET SIZE ESTIMATES; FORECAST
      24. | | 7.6.1 BY PRODUCT TYPE, 2025-2035 (USD Billion)
      25. | | 7.6.2 BY AUTOMATION, 2025-2035 (USD Billion)
      26. | | 7.6.3 BY FEATURES, 2025-2035 (USD Billion)
      27. | | 7.6.4 BY END-USER, 2025-2035 (USD Billion)
      28. | 7.7 UK MARKET SIZE ESTIMATES; FORECAST
      29. | | 7.7.1 BY PRODUCT TYPE, 2025-2035 (USD Billion)
      30. | | 7.7.2 BY AUTOMATION, 2025-2035 (USD Billion)
      31. | | 7.7.3 BY FEATURES, 2025-2035 (USD Billion)
      32. | | 7.7.4 BY END-USER, 2025-2035 (USD Billion)
      33. | 7.8 France MARKET SIZE ESTIMATES; FORECAST
      34. | | 7.8.1 BY PRODUCT TYPE, 2025-2035 (USD Billion)
      35. | | 7.8.2 BY AUTOMATION, 2025-2035 (USD Billion)
      36. | | 7.8.3 BY FEATURES, 2025-2035 (USD Billion)
      37. | | 7.8.4 BY END-USER, 2025-2035 (USD Billion)
      38. | 7.9 Russia MARKET SIZE ESTIMATES; FORECAST
      39. | | 7.9.1 BY PRODUCT TYPE, 2025-2035 (USD Billion)
      40. | | 7.9.2 BY AUTOMATION, 2025-2035 (USD Billion)
      41. | | 7.9.3 BY FEATURES, 2025-2035 (USD Billion)
      42. | | 7.9.4 BY END-USER, 2025-2035 (USD Billion)
      43. | 7.10 Italy MARKET SIZE ESTIMATES; FORECAST
      44. | | 7.10.1 BY PRODUCT TYPE, 2025-2035 (USD Billion)
      45. | | 7.10.2 BY AUTOMATION, 2025-2035 (USD Billion)
      46. | | 7.10.3 BY FEATURES, 2025-2035 (USD Billion)
      47. | | 7.10.4 BY END-USER, 2025-2035 (USD Billion)
      48. | 7.11 Spain MARKET SIZE ESTIMATES; FORECAST
      49. | | 7.11.1 BY PRODUCT TYPE, 2025-2035 (USD Billion)
      50. | | 7.11.2 BY AUTOMATION, 2025-2035 (USD Billion)
      51. | | 7.11.3 BY FEATURES, 2025-2035 (USD Billion)
      52. | | 7.11.4 BY END-USER, 2025-2035 (USD Billion)
      53. | 7.12 Rest of Europe MARKET SIZE ESTIMATES; FORECAST
      54. | | 7.12.1 BY PRODUCT TYPE, 2025-2035 (USD Billion)
      55. | | 7.12.2 BY AUTOMATION, 2025-2035 (USD Billion)
      56. | | 7.12.3 BY FEATURES, 2025-2035 (USD Billion)
      57. | | 7.12.4 BY END-USER, 2025-2035 (USD Billion)
      58. | 7.13 APAC MARKET SIZE ESTIMATES; FORECAST
      59. | | 7.13.1 BY PRODUCT TYPE, 2025-2035 (USD Billion)
      60. | | 7.13.2 BY AUTOMATION, 2025-2035 (USD Billion)
      61. | | 7.13.3 BY FEATURES, 2025-2035 (USD Billion)
      62. | | 7.13.4 BY END-USER, 2025-2035 (USD Billion)
      63. | 7.14 China MARKET SIZE ESTIMATES; FORECAST
      64. | | 7.14.1 BY PRODUCT TYPE, 2025-2035 (USD Billion)
      65. | | 7.14.2 BY AUTOMATION, 2025-2035 (USD Billion)
      66. | | 7.14.3 BY FEATURES, 2025-2035 (USD Billion)
      67. | | 7.14.4 BY END-USER, 2025-2035 (USD Billion)
      68. | 7.15 India MARKET SIZE ESTIMATES; FORECAST
      69. | | 7.15.1 BY PRODUCT TYPE, 2025-2035 (USD Billion)
      70. | | 7.15.2 BY AUTOMATION, 2025-2035 (USD Billion)
      71. | | 7.15.3 BY FEATURES, 2025-2035 (USD Billion)
      72. | | 7.15.4 BY END-USER, 2025-2035 (USD Billion)
      73. | 7.16 Japan MARKET SIZE ESTIMATES; FORECAST
      74. | | 7.16.1 BY PRODUCT TYPE, 2025-2035 (USD Billion)
      75. | | 7.16.2 BY AUTOMATION, 2025-2035 (USD Billion)
      76. | | 7.16.3 BY FEATURES, 2025-2035 (USD Billion)
      77. | | 7.16.4 BY END-USER, 2025-2035 (USD Billion)
      78. | 7.17 South Korea MARKET SIZE ESTIMATES; FORECAST
      79. | | 7.17.1 BY PRODUCT TYPE, 2025-2035 (USD Billion)
      80. | | 7.17.2 BY AUTOMATION, 2025-2035 (USD Billion)
      81. | | 7.17.3 BY FEATURES, 2025-2035 (USD Billion)
      82. | | 7.17.4 BY END-USER, 2025-2035 (USD Billion)
      83. | 7.18 Malaysia MARKET SIZE ESTIMATES; FORECAST
      84. | | 7.18.1 BY PRODUCT TYPE, 2025-2035 (USD Billion)
      85. | | 7.18.2 BY AUTOMATION, 2025-2035 (USD Billion)
      86. | | 7.18.3 BY FEATURES, 2025-2035 (USD Billion)
      87. | | 7.18.4 BY END-USER, 2025-2035 (USD Billion)
      88. | 7.19 Thailand MARKET SIZE ESTIMATES; FORECAST
      89. | | 7.19.1 BY PRODUCT TYPE, 2025-2035 (USD Billion)
      90. | | 7.19.2 BY AUTOMATION, 2025-2035 (USD Billion)
      91. | | 7.19.3 BY FEATURES, 2025-2035 (USD Billion)
      92. | | 7.19.4 BY END-USER, 2025-2035 (USD Billion)
      93. | 7.20 Indonesia MARKET SIZE ESTIMATES; FORECAST
      94. | | 7.20.1 BY PRODUCT TYPE, 2025-2035 (USD Billion)
      95. | | 7.20.2 BY AUTOMATION, 2025-2035 (USD Billion)
      96. | | 7.20.3 BY FEATURES, 2025-2035 (USD Billion)
      97. | | 7.20.4 BY END-USER, 2025-2035 (USD Billion)
      98. | 7.21 Rest of APAC MARKET SIZE ESTIMATES; FORECAST
      99. | | 7.21.1 BY PRODUCT TYPE, 2025-2035 (USD Billion)
      100. | | 7.21.2 BY AUTOMATION, 2025-2035 (USD Billion)
      101. | | 7.21.3 BY FEATURES, 2025-2035 (USD Billion)
      102. | | 7.21.4 BY END-USER, 2025-2035 (USD Billion)
      103. | 7.22 South America MARKET SIZE ESTIMATES; FORECAST
      104. | | 7.22.1 BY PRODUCT TYPE, 2025-2035 (USD Billion)
      105. | | 7.22.2 BY AUTOMATION, 2025-2035 (USD Billion)
      106. | | 7.22.3 BY FEATURES, 2025-2035 (USD Billion)
      107. | | 7.22.4 BY END-USER, 2025-2035 (USD Billion)
      108. | 7.23 Brazil MARKET SIZE ESTIMATES; FORECAST
      109. | | 7.23.1 BY PRODUCT TYPE, 2025-2035 (USD Billion)
      110. | | 7.23.2 BY AUTOMATION, 2025-2035 (USD Billion)
      111. | | 7.23.3 BY FEATURES, 2025-2035 (USD Billion)
      112. | | 7.23.4 BY END-USER, 2025-2035 (USD Billion)
      113. | 7.24 Mexico MARKET SIZE ESTIMATES; FORECAST
      114. | | 7.24.1 BY PRODUCT TYPE, 2025-2035 (USD Billion)
      115. | | 7.24.2 BY AUTOMATION, 2025-2035 (USD Billion)
      116. | | 7.24.3 BY FEATURES, 2025-2035 (USD Billion)
      117. | | 7.24.4 BY END-USER, 2025-2035 (USD Billion)
      118. | 7.25 Argentina MARKET SIZE ESTIMATES; FORECAST
      119. | | 7.25.1 BY PRODUCT TYPE, 2025-2035 (USD Billion)
      120. | | 7.25.2 BY AUTOMATION, 2025-2035 (USD Billion)
      121. | | 7.25.3 BY FEATURES, 2025-2035 (USD Billion)
      122. | | 7.25.4 BY END-USER, 2025-2035 (USD Billion)
      123. | 7.26 Rest of South America MARKET SIZE ESTIMATES; FORECAST
      124. | | 7.26.1 BY PRODUCT TYPE, 2025-2035 (USD Billion)
      125. | | 7.26.2 BY AUTOMATION, 2025-2035 (USD Billion)
      126. | | 7.26.3 BY FEATURES, 2025-2035 (USD Billion)
      127. | | 7.26.4 BY END-USER, 2025-2035 (USD Billion)
      128. | 7.27 MEA MARKET SIZE ESTIMATES; FORECAST
      129. | | 7.27.1 BY PRODUCT TYPE, 2025-2035 (USD Billion)
      130. | | 7.27.2 BY AUTOMATION, 2025-2035 (USD Billion)
      131. | | 7.27.3 BY FEATURES, 2025-2035 (USD Billion)
      132. | | 7.27.4 BY END-USER, 2025-2035 (USD Billion)
      133. | 7.28 GCC Countries MARKET SIZE ESTIMATES; FORECAST
      134. | | 7.28.1 BY PRODUCT TYPE, 2025-2035 (USD Billion)
      135. | | 7.28.2 BY AUTOMATION, 2025-2035 (USD Billion)
      136. | | 7.28.3 BY FEATURES, 2025-2035 (USD Billion)
      137. | | 7.28.4 BY END-USER, 2025-2035 (USD Billion)
      138. | 7.29 South Africa MARKET SIZE ESTIMATES; FORECAST
      139. | | 7.29.1 BY PRODUCT TYPE, 2025-2035 (USD Billion)
      140. | | 7.29.2 BY AUTOMATION, 2025-2035 (USD Billion)
      141. | | 7.29.3 BY FEATURES, 2025-2035 (USD Billion)
      142. | | 7.29.4 BY END-USER, 2025-2035 (USD Billion)
      143. | 7.30 Rest of MEA MARKET SIZE ESTIMATES; FORECAST
      144. | | 7.30.1 BY PRODUCT TYPE, 2025-2035 (USD Billion)
      145. | | 7.30.2 BY AUTOMATION, 2025-2035 (USD Billion)
      146. | | 7.30.3 BY FEATURES, 2025-2035 (USD Billion)
      147. | | 7.30.4 BY END-USER, 2025-2035 (USD Billion)
      148. | 7.31 PRODUCT LAUNCH/PRODUCT DEVELOPMENT/APPROVAL
      149. | | 7.31.1
      150. | 7.32 ACQUISITION/PARTNERSHIP
      151. | | 7.32.1

    Continuous Positive Airway Pressure (CPAP) Devices Market Segmentation

    Market Segmentation Overview

    • Detailed segmentation data will be available in the full report
    • Comprehensive analysis by multiple parameters
    • Regional and country-level breakdowns
    • Market size forecasts by segment
    Infographic

    Free Sample Request

    Kindly complete the form below to receive a free sample of this Report

    Get Free Sample

    Customer Strories

    “I am very pleased with how market segments have been defined in a relevant way for my purposes (such as "Portable Freezers & refrigerators" and "last-mile"). In general the report is well structured. Thanks very much for your efforts.”

    Victoria Milne

    Founder
    Case Study
    Chemicals and Materials

    Compare Licence

    ×
    Features License Type
    Single User Multiuser License Enterprise User
    Price $4,950 $5,950 $7,250
    Maximum User Access Limit 1 User Upto 10 Users Unrestricted Access Throughout the Organization
    Free Customization
    Direct Access to Analyst
    Deliverable Format
    Platform Access
    Discount on Next Purchase 10% 15% 15%
    Printable Versions