×
  • Cat-intel
  • MedIntelliX
  • Resources
  • About Us
  • Hero Background
    English
    Chinese
    French
    Japanese
    Korean
    German
    Spanish

    Collimating Lens Market Size

    ID: MRFR/SEM/5831-CR
    200 Pages
    Ankit Gupta
    April 2023

    Collimating Lens Market Research Report Information By Light Source (LED, Laser, Xenon Lamp, Infrared Light, RGB), Material (Molded Glass, Molded Plastic, Others), Wavelength (Less Than-1000 Nm, 1001-1500 Nm, 1501-2000 Nm, 2001Nm And Above), End User (Automobile, Medical, Lidar, Light And Display Measurement, Spectroscopy, Interferometry, Others), and By Region (North America, Europe, Asia-Paci...

    Share:
    Download PDF ×

    We do not share your information with anyone. However, we may send you emails based on your report interest from time to time. You may contact us at any time to opt-out.

    Collimating Lens Market Infographic
    Purchase Options

    Collimating Lens Size

    Collimating Lens Market Growth Projections and Opportunities

    This study about collimating lenses worldwide gives us a lot of information about how they are used and where. It talks about things like trends in the industry, how the market behaves, how big it is, who the competitors are, and where there are chances for growth. They sorted the information based on the source of light, the material used, the wavelength, who uses them, and in which part of the world. A collimating lens is something that helps light move in a straight line without spreading out. For example, they use these lenses in devices like spectrometers or light meters to make sure the light going in is all parallel and covers the right area for measurement. These lenses are very helpful in controlling what we can see, how well a device works, and how clear the pictures or measurements are. They also help make the light beams narrower, which makes things more visible. Collimating lenses are not just for measurement tools; they are also used in things like display measurements. When we measure displays, like screens on phones or TVs, collimating lenses help analyze things like color, brightness, response time, and more. The design of these lenses is crucial in getting accurate measurements and making high-quality displays. These lenses are also used in measuring light, especially when looking at surfaces that give off light, like OLED panels. Depending on the device used for measurement, we can find out things like the type of light, its color, and if there is any flickering. The market for collimating lenses is divided based on the light source, materials, wavelength, and who uses them. For instance, when it comes to light sources, they are divided into categories like LED, laser, xenon lamps, infrared light, and RGB. The study says that the laser category had the biggest market share in 2021 and is expected to keep growing. In terms of materials, they use things like molded glass or molded plastic for these lenses. The study found that molded glass had the most significant market share in 2021 and is expected to stay on top. When it comes to the color of light (wavelength), they grouped it into different categories. The study says that light with a wavelength of less than 1000 Nm had the biggest market share in 2021. But, they predict that the categories with a wavelength of 2001 Nm and above will grow the most from 2022 to 2030. Collimating lenses are used in various fields like automobiles, medical devices, lidar, light and display measurements, spectroscopy, interferometry, and more. According to the study, the Light and Display Measurement category had the most significant market share in 2021 and is expected to lead the market in the coming years. This study also looked at the regions of the world. Asia-Pacific is expected to be the leader in the collimating lens market during the study period. The global market for collimating lenses is competitive, with many companies offering different solutions. Some of the major companies mentioned in the study include Lightpath Technologies, Ocean Insight, INGENRIC, Trioptics GmbH, Avantes BV, Auer Lighting GmbH, Optikos, IPG Photonics Corporation, The Optoelectronics company, Thorlabs, Inc., AMS Technology AG, Axetris AG, Bentham, Focuslight Technologies Inc., Edmund Optics Inc., and Quarton Inc.
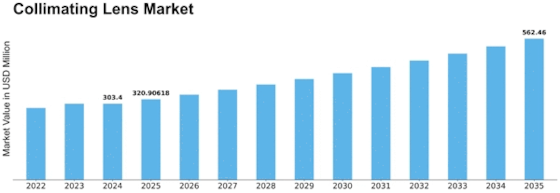
    Collimating Lens Market Size Graph
    Author
    Ankit Gupta
    Senior Research Analyst

    Ankit Gupta is an analyst in market research industry in ICT and SEMI industry. With post-graduation in "Telecom and Marketing Management" and graduation in "Electronics and Telecommunication" vertical he is well versed with recent development in ICT industry as a whole. Having worked on more than 150+ reports including consultation for fortune 500 companies such as Microsoft and Rio Tinto in identifying solutions with respect to business problems his opinions are inclined towards mixture of technical and managerial aspects.

    Leave a Comment

    FAQs

    What is the projected market valuation for the Collimating Lens Market in 2035?

    The projected market valuation for the Collimating Lens Market in 2035 is 562.46 USD Million.

    What was the overall market valuation of the Collimating Lens Market in 2024?

    The overall market valuation of the Collimating Lens Market in 2024 was 303.4 USD Million.

    What is the expected CAGR for the Collimating Lens Market during the forecast period 2025 - 2035?

    The expected CAGR for the Collimating Lens Market during the forecast period 2025 - 2035 is 5.77%.

    Which companies are considered key players in the Collimating Lens Market?

    Key players in the Collimating Lens Market include Thorlabs, Edmund Optics, Newport Corporation, and others.

    What are the primary segments of the Collimating Lens Market based on light sources?

    The primary segments based on light sources include LED, Laser, Xenon Lamp, Infrared Light, and RGB.

    Market Summary

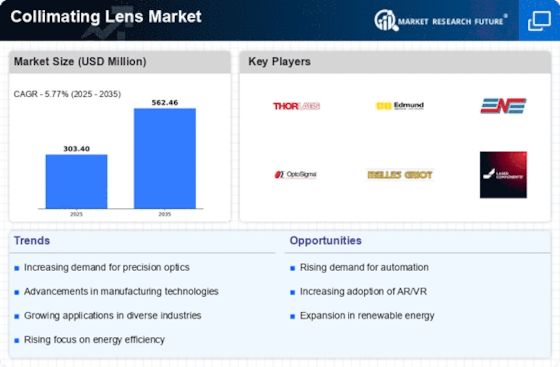
    As per MRFR analysis, the Collimating Lens Market Size was estimated at 303.4 USD Million in 2024. The Collimating Lens industry is projected to grow from 320.91 in 2025 to 562.46 by 2035, exhibiting a compound annual growth rate (CAGR) of 5.77 during the forecast period 2025 - 2035.

    Key Market Trends & Highlights

    The Collimating Lens Market is poised for substantial growth driven by technological advancements and increasing applications across various sectors.

    • Technological advancements are propelling the development of more efficient collimating lenses, particularly in North America.
    • The demand for collimating lenses in telecommunications is surging, reflecting the region's status as the largest market.
    • In the Asia-Pacific region, the market for laser collimating lenses is expanding rapidly, indicating a shift towards faster-growing segments.
    • Rising adoption of laser technologies and increased investment in research and development are key drivers fueling market growth.

    Market Size & Forecast

    2024 Market Size 303.4 (USD Million)
    2035 Market Size 562.46 (USD Million)
    CAGR (2025 - 2035) 5.77%
    Largest Regional Market Share in 2024 Asia Pacific

    Major Players

    <p>Thorlabs (US), Edmund Optics (US), Newport Corporation (US), OptoSigma (JP), Melles Griot (US), Laser Components (DE), Sill Optics (DE), Linos (DE), Optical Surfaces (GB)</p>

    Market Trends

    The Collimating Lens Market is currently experiencing a dynamic evolution, driven by advancements in optical technologies and increasing applications across various sectors. The demand for high-precision optical components is on the rise, particularly in industries such as telecommunications, medical devices, and defense. As these sectors continue to innovate, the need for efficient light management solutions becomes paramount. This trend suggests a growing emphasis on the development of specialized collimating lenses that can enhance performance and reliability in diverse applications. Moreover, the integration of collimating lenses in emerging technologies, such as augmented reality and laser-based systems, indicates a potential shift in market dynamics. Manufacturers are likely focusing on creating lenses that not only meet current specifications but also adapt to future technological advancements. The emphasis on sustainability and energy efficiency may further influence product development, as stakeholders seek environmentally friendly materials and processes. Overall, the Collimating Lens Market appears poised for substantial growth, with opportunities for innovation and expansion across multiple industries.

    Technological Advancements

    The Collimating Lens Market is witnessing rapid technological advancements, particularly in the design and manufacturing processes. Innovations in materials and coatings are enhancing the performance of collimating lenses, allowing for improved light transmission and reduced aberrations. This trend is likely to drive the development of more sophisticated optical systems, catering to the needs of various applications.

    Increased Demand in Telecommunications

    The telecommunications sector is increasingly relying on collimating lenses to optimize signal transmission and reception. As the demand for high-speed data transfer continues to grow, the need for efficient optical components becomes critical. This trend suggests that manufacturers may focus on creating lenses specifically tailored for telecommunications applications, potentially leading to new product lines.

    Sustainability Initiatives

    There is a noticeable shift towards sustainability within the Collimating Lens Market, as manufacturers explore eco-friendly materials and production methods. This trend indicates a growing awareness of environmental impacts and a commitment to reducing carbon footprints. Companies may invest in research to develop sustainable alternatives, aligning with global efforts to promote greener technologies.

    Collimating Lens Market Market Drivers

    Expansion of Consumer Electronics

    The expansion of the consumer electronics sector is another significant driver for the Collimating Lens Market. With the proliferation of devices such as smartphones, tablets, and smart home products, the demand for high-quality optical components has surged. Collimating lenses play a crucial role in enhancing the performance of cameras and display technologies, which are integral to these devices. Market data indicates that the consumer electronics industry is expected to witness a growth rate of around 4% annually, further fueling the need for efficient optical solutions. As manufacturers focus on improving image quality and device functionality, the Collimating Lens Market is likely to experience increased demand, prompting innovation and development in lens design and manufacturing processes.

    Rising Adoption of Laser Technologies

    The increasing adoption of laser technologies across various sectors is a primary driver for the Collimating Lens Market. Lasers are extensively utilized in applications such as manufacturing, medical devices, and telecommunications. The demand for high-precision optical components, including collimating lenses, is expected to rise as industries seek to enhance efficiency and accuracy. According to recent data, the laser market is projected to grow at a compound annual growth rate of approximately 5.5% over the next few years. This growth is likely to stimulate the need for advanced collimating lenses, which are essential for directing laser beams with minimal divergence. As a result, the Collimating Lens Market is positioned to benefit significantly from this trend, as manufacturers strive to meet the evolving requirements of laser applications.

    Growth in Medical Imaging Applications

    The growth in medical imaging applications is a vital driver for the Collimating Lens Market. Technologies such as endoscopy, optical coherence tomography, and various imaging modalities rely heavily on high-quality optical components to ensure accurate diagnostics and treatment. The medical imaging market is anticipated to expand at a rate of approximately 6% per year, driven by advancements in healthcare technology and an aging population. As healthcare providers seek to enhance imaging capabilities, the demand for specialized collimating lenses that improve image clarity and precision is likely to rise. This trend presents a substantial opportunity for the Collimating Lens Market, as manufacturers develop tailored solutions to meet the specific needs of medical applications.

    Emerging Applications in Automotive Sector

    Emerging applications in the automotive sector are increasingly driving the Collimating Lens Market. With the rise of advanced driver-assistance systems (ADAS) and autonomous vehicles, the need for high-quality optical components has become paramount. Collimating lenses are essential for various applications, including LiDAR systems and camera-based sensors, which are integral to enhancing vehicle safety and navigation. The automotive optics market is expected to grow at a rate of around 5% annually, reflecting the industry's shift towards more sophisticated technologies. As automotive manufacturers prioritize safety and efficiency, the demand for reliable collimating lenses is likely to increase, presenting a significant opportunity for the Collimating Lens Market to expand its reach and influence.

    Increased Investment in Research and Development

    Increased investment in research and development across various industries is a notable driver for the Collimating Lens Market. Organizations are allocating more resources to innovate and improve optical technologies, which directly impacts the demand for high-performance collimating lenses. This trend is particularly evident in sectors such as aerospace, defense, and telecommunications, where precision optics are critical. Data suggests that R&D spending in these sectors is projected to grow by approximately 7% annually, indicating a robust commitment to advancing optical technologies. As companies strive to develop cutting-edge solutions, the Collimating Lens Market is likely to benefit from enhanced product offerings and increased demand for specialized lenses that meet rigorous performance standards.

    Market Segment Insights

    By Light Source: LED (Largest) vs. Laser (Fastest-Growing)

    <p>The Collimating Lens Market exhibits a diverse distribution of light source technologies, with LED technology commanding the largest market share due to its energy efficiency and longevity. Laser sources are rising rapidly, capturing interest as they become more prevalent in various applications, particularly in precision and industrial settings, though the share remains lower than LEDs currently. Looking ahead, the growth in the collimating lens segment is propelled by advancements in LED technology and the increasing demand for laser systems in high-performance applications. Consumers are drawn to the brightness, energy savings, and performance improvements provided by LED solutions, while lasers are gaining traction in sectors that require accuracy and efficiency, marking an exciting trend as both technologies evolve and expand their reach.</p>

    <p>LED (Dominant) vs. Laser (Emerging)</p>

    <p>LED technology has established itself as the dominant player in the light source segment of the Collimating Lens Market, largely due to its high efficiency, reduced energy consumption, and long lifespan. This makes it an attractive option for many applications, including general lighting, automotive, and electronics, where long-term operation is key. In contrast, Laser technology is viewed as an emerging contender, particularly in niche markets such as medical and industrial applications. Lasers offer unique benefits, such as high precision and the ability to generate focused beams of light, appealing to specialized industries. As demand continues to grow for high-performance and energy-efficient lighting solutions, both LED and Laser technologies are expected to play pivotal roles, each catering to specific market needs.</p>

    By Material: Molded Glass (Largest) vs. Molded Plastic (Fastest-Growing)

    <p>In the Collimating Lens Market, the segment distribution shows that Molded Glass holds the largest share due to its superior optical qualities and durability. This material is preferred for applications demanding high precision and performance, making it a staple in industries like automotive and aerospace. In contrast, Molded Plastic, while currently smaller in overall share, is rapidly gaining traction, attributed to its lightweight properties and cost-effectiveness, fitting well with the evolving needs of various sectors.</p>

    <p>Molded Glass (Dominant) vs. Molded Plastic (Emerging)</p>

    <p>Molded Glass is recognized as the dominant material in the Collimating Lens Market due to its exceptional light transmission and resilience to environmental factors. Its applications span across highly specialized areas such as military optics and advanced lighting systems. On the other hand, Molded Plastic is emerging as a significant contender, appealing to manufacturers looking for economical solutions without compromising on quality. Its advantages include lower weight, ease of manufacturing, and flexibility in design, appealing to industries like consumer electronics and healthcare. The growth of Molded Plastic reflects a market trend towards lightweight and cost-effective alternatives.</p>

    By Wavelength: Less Than-1000 Nm (Largest) vs. 1001-1500 Nm (Fastest-Growing)

    <p>The Collimating Lens Market showcases a diverse segmentation based on wavelength, with the 'Less Than-1000 Nm' segment standing out as the largest contributor to market share. This segment dominates the landscape due to its wide applicability in various optical systems, making it a reliable choice for high-performance applications. Conversely, the '1001-1500 Nm' segment is recognized as the fastest-growing, attracting significant interest due to advances in technology and increasing demand for longer wavelength applications in multiple industries.</p>

    <p>Wavelength: Less Than-1000 Nm (Dominant) vs. 1001-1500 Nm (Emerging)</p>

    <p>The 'Less Than-1000 Nm' segment of the Collimating Lens Market is characterized by its established presence and high demand across sectors such as telecommunications, imaging, and laser technologies. Its robust applications in critical high-precision fields highlight its dominance. Meanwhile, the '1001-1500 Nm' segment is rapidly emerging, fueled by technological advancements and an increased focus on infrared applications. This segment is anticipated to play a vital role in innovative developments, especially in areas requiring enhanced optical performance and efficiency.</p>

    By End User: Automobile (Largest) vs. Medical (Fastest-Growing)

    <p>In the Collimating Lens Market, the end user segment is diverse, with significant contributions from the automobile and medical sectors. The automobile industry holds the largest share, leveraging collimating lenses for advanced lighting and optical applications in vehicles. Meanwhile, the medical sector is rapidly expanding, utilizing these lenses in various diagnostic and therapeutic equipment. As technological advancements continue, both sectors showcase unique demands and trends, influencing market dynamics.</p>

    <p>Automobile: Dominant vs. Medical: Emerging</p>

    <p>The automobile sector stands out as a dominant player in the Collimating Lens Market due to its extensive use in headlights and advanced driver-assistance systems (ADAS). The demand for high-performance lighting solutions drives continuous innovations in lens design and materials. In contrast, the medical sector, while currently smaller, is emerging rapidly as a significant user of collimating lenses in applications such as endoscopy and laser surgery. The increasing focus on precision and improved patient outcomes in medical technologies enhances the growth potential of collimating lenses in this field, as manufacturers seek to integrate more advanced optical solutions into their products.</p>

    Get more detailed insights about Collimating Lens Market Research Report – Forecast till 2035

    Regional Insights

    North America : Innovation and Market Leadership

    North America is the largest market for collimating lenses, holding approximately 45% of the global share. The region benefits from a robust technological infrastructure, significant investments in R&D, and a growing demand for advanced optical systems in sectors like telecommunications and healthcare. Regulatory support for innovation and quality standards further drives market growth, making it a key player in the global landscape. The United States leads the North American market, with major companies like Thorlabs, Edmund Optics, and Newport Corporation driving competition. These firms are known for their cutting-edge technologies and extensive product portfolios. The presence of established players fosters a competitive environment, encouraging innovation and enhancing product offerings to meet diverse customer needs.

    Europe : Emerging Market with Strong Regulations

    Europe is the second-largest market for collimating lenses, accounting for around 30% of the global market share. The region's growth is propelled by stringent regulations that ensure high-quality optical products, alongside increasing demand from industries such as automotive and aerospace. The European Union's focus on innovation and sustainability also acts as a catalyst for market expansion, encouraging companies to adopt advanced technologies. Germany, the UK, and France are the leading countries in this market, with key players like Laser Components and Sill Optics contributing significantly. The competitive landscape is characterized by a mix of established firms and innovative startups, fostering a dynamic environment. The presence of research institutions and collaborations further enhances the region's capabilities in optical technologies.

    Asia-Pacific : Rapid Growth and Technological Advancements

    Asia-Pacific is witnessing rapid growth in the collimating lens market, driven by increasing industrialization and technological advancements. The region holds approximately 20% of the global market share, with countries like Japan and China leading the charge. The demand for high-precision optical components in sectors such as electronics and manufacturing is a significant growth driver, supported by favorable government policies promoting innovation and technology adoption. Japan is home to key players like OptoSigma, which enhances the competitive landscape with its advanced product offerings. China is also emerging as a significant market, with a growing number of local manufacturers entering the field. The region's focus on research and development, coupled with a skilled workforce, positions it as a formidable player in The Collimating Lens.

    Middle East and Africa : Untapped Potential and Growth Opportunities

    The Middle East and Africa region represents an emerging market for collimating lenses, holding about 5% of the global share. The growth is primarily driven by increasing investments in infrastructure and technology, particularly in sectors like telecommunications and healthcare. However, challenges such as limited local manufacturing capabilities and regulatory hurdles can impede faster growth. Governments are increasingly recognizing the importance of optical technologies, which may lead to supportive policies in the future. Countries like South Africa and the UAE are at the forefront of this market, with a growing number of companies exploring opportunities in optical technologies. The competitive landscape is still developing, with both local and international players vying for market share. As the region continues to invest in technology and infrastructure, the potential for growth in the collimating lens market remains significant.

    Key Players and Competitive Insights

    The Collimating Lens Market is currently characterized by a dynamic competitive landscape, driven by technological advancements and increasing demand across various sectors, including telecommunications, medical devices, and industrial applications. Key players such as Thorlabs (US), Edmund Optics (US), and Newport Corporation (US) are strategically positioned to leverage their extensive product portfolios and innovative capabilities. Thorlabs (US) focuses on expanding its optical component offerings, while Edmund Optics (US) emphasizes customization and customer-centric solutions. Newport Corporation (US) appears to be enhancing its market presence through strategic partnerships and collaborations, which collectively shape a competitive environment that is increasingly reliant on innovation and customer engagement.

    In terms of business tactics, companies are increasingly localizing manufacturing to reduce lead times and enhance supply chain efficiency. The market structure is moderately fragmented, with several players vying for market share, yet the influence of major companies remains substantial. This competitive structure allows for a diverse range of products and services, catering to various customer needs while fostering innovation through competition.

    In August 2025, Thorlabs (US) announced the launch of a new line of high-performance collimating lenses designed specifically for laser applications. This strategic move not only enhances their product portfolio but also positions Thorlabs (US) as a leader in the high-precision optics segment. The introduction of these lenses is expected to meet the growing demand for advanced optical solutions in research and industrial applications, thereby solidifying their market position.

    In September 2025, Edmund Optics (US) unveiled a new customization service that allows customers to tailor collimating lenses to their specific requirements. This initiative reflects a strategic focus on customer-centricity and innovation, enabling the company to differentiate itself in a competitive market. By offering bespoke solutions, Edmund Optics (US) is likely to attract a broader customer base, enhancing its competitive edge.

    In July 2025, Newport Corporation (US) entered into a strategic partnership with a leading technology firm to develop next-generation optical systems. This collaboration is indicative of Newport's commitment to innovation and technological advancement. By aligning with a technology partner, Newport Corporation (US) aims to integrate cutting-edge technologies into its product offerings, potentially leading to enhanced performance and new market opportunities.

    As of October 2025, the Collimating Lens Market is witnessing trends such as digitalization, sustainability, and the integration of artificial intelligence in product development. Strategic alliances are increasingly shaping the competitive landscape, allowing companies to pool resources and expertise. Looking ahead, competitive differentiation is likely to evolve from traditional price-based competition to a focus on innovation, technological advancements, and supply chain reliability. This shift underscores the importance of agility and responsiveness in meeting the evolving demands of the market.

    Key Companies in the Collimating Lens Market market include

    Industry Developments

    • Q1 2024: Thorlabs Launches New AI-Optimized Collimating Lens Series for Fiber Optics and Laser Systems Thorlabs announced the release of a new series of high-precision collimating lenses featuring AI-powered optical alignment, targeting fiber optics and advanced laser applications.
    • Q2 2024: Edmund Optics Introduces Customizable Aspheric Collimating Lenses with High-Efficiency Coatings Edmund Optics launched a new product line of customizable aspheric collimating lenses designed for improved beam shaping and efficiency in industrial and medical imaging systems.
    • Q2 2024: Excelitas Technologies Unveils Collimating Lenses for Next-Generation LiDAR and Medical Imaging Excelitas Technologies announced new collimating lens products optimized for LiDAR systems in autonomous vehicles and high-resolution medical imaging devices.
    • Q3 2024: IPG Photonics Launches High-Power Fiber Laser Collimating Optics with AI-Driven Wavelength Optimization IPG Photonics introduced a new line of collimating optics for fiber lasers, featuring AI-driven wavelength optimization for enhanced precision in industrial laser applications.
    • Q3 2024: Optikos Corporation Debuts AI-Powered Collimation Testing and Calibration Services Optikos Corporation announced new services for AI-powered collimating lens testing and calibration, aimed at improving performance and reliability for optical manufacturers.
    • Q4 2024: Thorlabs Opens New Manufacturing Facility for Advanced Collimating Lens Production Thorlabs inaugurated a new facility dedicated to the production of advanced collimating lenses, expanding its manufacturing capacity to meet growing global demand.
    • Q1 2025: Edmund Optics Announces Strategic Partnership with Leading Photonics Firm for Collimating Lens Innovation Edmund Optics entered a partnership with a major photonics company to co-develop next-generation collimating lenses for emerging applications in AR/VR and autonomous vehicles.
    • Q1 2025: Excelitas Technologies Wins Major Contract to Supply Collimating Lenses for European Automotive LiDAR Project Excelitas Technologies secured a contract to provide collimating lenses for a large-scale European automotive LiDAR initiative, supporting the rollout of advanced driver-assistance systems.
    • Q2 2025: IPG Photonics Expands Collimating Lens Portfolio with New Precision Beam Delivery Systems IPG Photonics expanded its product portfolio with new collimating lens solutions designed for precision beam delivery in industrial and medical laser systems.
    • Q2 2025: Optikos Corporation Appoints New Chief Technology Officer to Lead Collimating Lens R&D Optikos Corporation announced the appointment of a new CTO to spearhead research and development in collimating lens technology and optical metrology.
    • Q3 2025: Thorlabs Secures Funding for Expansion of Collimating Lens R&D Programs Thorlabs received new funding to accelerate research and development of advanced collimating lens technologies for next-generation photonics applications.
    • Q3 2025: Edmund Optics Launches Miniaturized Collimating Lens Solutions for Wearable Devices Edmund Optics introduced a new line of miniaturized collimating lenses designed for integration into wearable devices and compact optical systems.

    Future Outlook

    Collimating Lens Market Future Outlook

    <p>The Collimating Lens Market is projected to grow at a 5.77% CAGR from 2024 to 2035, driven by advancements in optical technologies and increasing demand in various applications.</p>

    New opportunities lie in:

    • <p>Development of high-efficiency LED collimating lenses for energy-saving applications.</p>
    • <p>Expansion into emerging markets with tailored optical solutions.</p>
    • <p>Partnerships with tech firms for integrated optical systems in consumer electronics.</p>

    <p>By 2035, the Collimating Lens Market is expected to achieve robust growth and innovation.</p>

    Market Segmentation

    Collimating Lens Market End User Outlook

    • Automobile
    • Medical
    • Lidar
    • Light And Display Measurement
    • Spectroscopy
    • Interferometry
    • Others

    Collimating Lens Market Material Outlook

    • Molded Glass
    • Molded Plastic
    • Others

    Collimating Lens Market Wavelength Outlook

    • Less Than-1000 Nm
    • 1001-1500 Nm
    • 1501-2000 Nm
    • 2001 Nm And Above

    Collimating Lens Market Light Source Outlook

    • LED
    • Laser
    • Xenon Lamp
    • Infrared Light
    • RGB

    Report Scope

    MARKET SIZE 2024303.4(USD Million)
    MARKET SIZE 2025320.91(USD Million)
    MARKET SIZE 2035562.46(USD Million)
    COMPOUND ANNUAL GROWTH RATE (CAGR)5.77% (2024 - 2035)
    REPORT COVERAGERevenue Forecast, Competitive Landscape, Growth Factors, and Trends
    BASE YEAR2024
    Market Forecast Period2025 - 2035
    Historical Data2019 - 2024
    Market Forecast UnitsUSD Million
    Key Companies ProfiledMarket analysis in progress
    Segments CoveredMarket segmentation analysis in progress
    Key Market OpportunitiesAdvancements in optical technologies drive demand in the Collimating Lens Market for diverse applications.
    Key Market DynamicsTechnological advancements drive demand for collimating lenses in diverse applications, enhancing optical performance and efficiency.
    Countries CoveredNorth America, Europe, APAC, South America, MEA

    FAQs

    What is the projected market valuation for the Collimating Lens Market in 2035?

    The projected market valuation for the Collimating Lens Market in 2035 is 562.46 USD Million.

    What was the overall market valuation of the Collimating Lens Market in 2024?

    The overall market valuation of the Collimating Lens Market in 2024 was 303.4 USD Million.

    What is the expected CAGR for the Collimating Lens Market during the forecast period 2025 - 2035?

    The expected CAGR for the Collimating Lens Market during the forecast period 2025 - 2035 is 5.77%.

    Which companies are considered key players in the Collimating Lens Market?

    Key players in the Collimating Lens Market include Thorlabs, Edmund Optics, Newport Corporation, and others.

    What are the primary segments of the Collimating Lens Market based on light sources?

    The primary segments based on light sources include LED, Laser, Xenon Lamp, Infrared Light, and RGB.

    1. SECTION I: EXECUTIVE SUMMARY AND KEY HIGHLIGHTS
      1. | 1.1 EXECUTIVE SUMMARY
      2. | | 1.1.1 Market Overview
      3. | | 1.1.2 Key Findings
      4. | | 1.1.3 Market Segmentation
      5. | | 1.1.4 Competitive Landscape
      6. | | 1.1.5 Challenges and Opportunities
      7. | | 1.1.6 Future Outlook
    2. SECTION II: SCOPING, METHODOLOGY AND MARKET STRUCTURE
      1. | 2.1 MARKET INTRODUCTION
      2. | | 2.1.1 Definition
      3. | | 2.1.2 Scope of the study
      4. | | | 2.1.2.1 Research Objective
      5. | | | 2.1.2.2 Assumption
      6. | | | 2.1.2.3 Limitations
      7. | 2.2 RESEARCH METHODOLOGY
      8. | | 2.2.1 Overview
      9. | | 2.2.2 Data Mining
      10. | | 2.2.3 Secondary Research
      11. | | 2.2.4 Primary Research
      12. | | | 2.2.4.1 Primary Interviews and Information Gathering Process
      13. | | | 2.2.4.2 Breakdown of Primary Respondents
      14. | | 2.2.5 Forecasting Model
      15. | | 2.2.6 Market Size Estimation
      16. | | | 2.2.6.1 Bottom-Up Approach
      17. | | | 2.2.6.2 Top-Down Approach
      18. | | 2.2.7 Data Triangulation
      19. | | 2.2.8 Validation
    3. SECTION III: QUALITATIVE ANALYSIS
      1. | 3.1 MARKET DYNAMICS
      2. | | 3.1.1 Overview
      3. | | 3.1.2 Drivers
      4. | | 3.1.3 Restraints
      5. | | 3.1.4 Opportunities
      6. | 3.2 MARKET FACTOR ANALYSIS
      7. | | 3.2.1 Value chain Analysis
      8. | | 3.2.2 Porter's Five Forces Analysis
      9. | | | 3.2.2.1 Bargaining Power of Suppliers
      10. | | | 3.2.2.2 Bargaining Power of Buyers
      11. | | | 3.2.2.3 Threat of New Entrants
      12. | | | 3.2.2.4 Threat of Substitutes
      13. | | | 3.2.2.5 Intensity of Rivalry
      14. | | 3.2.3 COVID-19 Impact Analysis
      15. | | | 3.2.3.1 Market Impact Analysis
      16. | | | 3.2.3.2 Regional Impact
      17. | | | 3.2.3.3 Opportunity and Threat Analysis
    4. SECTION IV: QUANTITATIVE ANALYSIS
      1. | 4.1 Semiconductor & Electronics, BY Light Source (USD Million)
      2. | | 4.1.1 LED
      3. | | 4.1.2 Laser
      4. | | 4.1.3 Xenon Lamp
      5. | | 4.1.4 Infrared Light
      6. | | 4.1.5 RGB
      7. | 4.2 Semiconductor & Electronics, BY Material (USD Million)
      8. | | 4.2.1 Molded Glass
      9. | | 4.2.2 Molded Plastic
      10. | | 4.2.3 Others
      11. | 4.3 Semiconductor & Electronics, BY Wavelength (USD Million)
      12. | | 4.3.1 Less Than-1000 Nm
      13. | | 4.3.2 1001-1500 Nm
      14. | | 4.3.3 1501-2000 Nm
      15. | | 4.3.4 2001 Nm And Above
      16. | 4.4 Semiconductor & Electronics, BY End User (USD Million)
      17. | | 4.4.1 Automobile
      18. | | 4.4.2 Medical
      19. | | 4.4.3 Lidar
      20. | | 4.4.4 Light And Display Measurement
      21. | | 4.4.5 Spectroscopy
      22. | | 4.4.6 Interferometry
      23. | | 4.4.7 Others
      24. | 4.5 Semiconductor & Electronics, BY Region (USD Million)
      25. | | 4.5.1 North America
      26. | | | 4.5.1.1 US
      27. | | | 4.5.1.2 Canada
      28. | | 4.5.2 Europe
      29. | | | 4.5.2.1 Germany
      30. | | | 4.5.2.2 UK
      31. | | | 4.5.2.3 France
      32. | | | 4.5.2.4 Russia
      33. | | | 4.5.2.5 Italy
      34. | | | 4.5.2.6 Spain
      35. | | | 4.5.2.7 Rest of Europe
      36. | | 4.5.3 APAC
      37. | | | 4.5.3.1 China
      38. | | | 4.5.3.2 India
      39. | | | 4.5.3.3 Japan
      40. | | | 4.5.3.4 South Korea
      41. | | | 4.5.3.5 Malaysia
      42. | | | 4.5.3.6 Thailand
      43. | | | 4.5.3.7 Indonesia
      44. | | | 4.5.3.8 Rest of APAC
      45. | | 4.5.4 South America
      46. | | | 4.5.4.1 Brazil
      47. | | | 4.5.4.2 Mexico
      48. | | | 4.5.4.3 Argentina
      49. | | | 4.5.4.4 Rest of South America
      50. | | 4.5.5 MEA
      51. | | | 4.5.5.1 GCC Countries
      52. | | | 4.5.5.2 South Africa
      53. | | | 4.5.5.3 Rest of MEA
    5. SECTION V: COMPETITIVE ANALYSIS
      1. | 5.1 Competitive Landscape
      2. | | 5.1.1 Overview
      3. | | 5.1.2 Competitive Analysis
      4. | | 5.1.3 Market share Analysis
      5. | | 5.1.4 Major Growth Strategy in the Semiconductor & Electronics
      6. | | 5.1.5 Competitive Benchmarking
      7. | | 5.1.6 Leading Players in Terms of Number of Developments in the Semiconductor & Electronics
      8. | | 5.1.7 Key developments and growth strategies
      9. | | | 5.1.7.1 New Product Launch/Service Deployment
      10. | | | 5.1.7.2 Merger & Acquisitions
      11. | | | 5.1.7.3 Joint Ventures
      12. | | 5.1.8 Major Players Financial Matrix
      13. | | | 5.1.8.1 Sales and Operating Income
      14. | | | 5.1.8.2 Major Players R&D Expenditure. 2023
      15. | 5.2 Company Profiles
      16. | | 5.2.1 Thorlabs (US)
      17. | | | 5.2.1.1 Financial Overview
      18. | | | 5.2.1.2 Products Offered
      19. | | | 5.2.1.3 Key Developments
      20. | | | 5.2.1.4 SWOT Analysis
      21. | | | 5.2.1.5 Key Strategies
      22. | | 5.2.2 Edmund Optics (US)
      23. | | | 5.2.2.1 Financial Overview
      24. | | | 5.2.2.2 Products Offered
      25. | | | 5.2.2.3 Key Developments
      26. | | | 5.2.2.4 SWOT Analysis
      27. | | | 5.2.2.5 Key Strategies
      28. | | 5.2.3 Newport Corporation (US)
      29. | | | 5.2.3.1 Financial Overview
      30. | | | 5.2.3.2 Products Offered
      31. | | | 5.2.3.3 Key Developments
      32. | | | 5.2.3.4 SWOT Analysis
      33. | | | 5.2.3.5 Key Strategies
      34. | | 5.2.4 OptoSigma (JP)
      35. | | | 5.2.4.1 Financial Overview
      36. | | | 5.2.4.2 Products Offered
      37. | | | 5.2.4.3 Key Developments
      38. | | | 5.2.4.4 SWOT Analysis
      39. | | | 5.2.4.5 Key Strategies
      40. | | 5.2.5 Melles Griot (US)
      41. | | | 5.2.5.1 Financial Overview
      42. | | | 5.2.5.2 Products Offered
      43. | | | 5.2.5.3 Key Developments
      44. | | | 5.2.5.4 SWOT Analysis
      45. | | | 5.2.5.5 Key Strategies
      46. | | 5.2.6 Laser Components (DE)
      47. | | | 5.2.6.1 Financial Overview
      48. | | | 5.2.6.2 Products Offered
      49. | | | 5.2.6.3 Key Developments
      50. | | | 5.2.6.4 SWOT Analysis
      51. | | | 5.2.6.5 Key Strategies
      52. | | 5.2.7 Sill Optics (DE)
      53. | | | 5.2.7.1 Financial Overview
      54. | | | 5.2.7.2 Products Offered
      55. | | | 5.2.7.3 Key Developments
      56. | | | 5.2.7.4 SWOT Analysis
      57. | | | 5.2.7.5 Key Strategies
      58. | | 5.2.8 Linos (DE)
      59. | | | 5.2.8.1 Financial Overview
      60. | | | 5.2.8.2 Products Offered
      61. | | | 5.2.8.3 Key Developments
      62. | | | 5.2.8.4 SWOT Analysis
      63. | | | 5.2.8.5 Key Strategies
      64. | | 5.2.9 Optical Surfaces (GB)
      65. | | | 5.2.9.1 Financial Overview
      66. | | | 5.2.9.2 Products Offered
      67. | | | 5.2.9.3 Key Developments
      68. | | | 5.2.9.4 SWOT Analysis
      69. | | | 5.2.9.5 Key Strategies
      70. | 5.3 Appendix
      71. | | 5.3.1 References
      72. | | 5.3.2 Related Reports
    6. LIST OF FIGURES
      1. | 6.1 MARKET SYNOPSIS
      2. | 6.2 NORTH AMERICA MARKET ANALYSIS
      3. | 6.3 US MARKET ANALYSIS BY LIGHT SOURCE
      4. | 6.4 US MARKET ANALYSIS BY MATERIAL
      5. | 6.5 US MARKET ANALYSIS BY WAVELENGTH
      6. | 6.6 US MARKET ANALYSIS BY END USER
      7. | 6.7 CANADA MARKET ANALYSIS BY LIGHT SOURCE
      8. | 6.8 CANADA MARKET ANALYSIS BY MATERIAL
      9. | 6.9 CANADA MARKET ANALYSIS BY WAVELENGTH
      10. | 6.10 CANADA MARKET ANALYSIS BY END USER
      11. | 6.11 EUROPE MARKET ANALYSIS
      12. | 6.12 GERMANY MARKET ANALYSIS BY LIGHT SOURCE
      13. | 6.13 GERMANY MARKET ANALYSIS BY MATERIAL
      14. | 6.14 GERMANY MARKET ANALYSIS BY WAVELENGTH
      15. | 6.15 GERMANY MARKET ANALYSIS BY END USER
      16. | 6.16 UK MARKET ANALYSIS BY LIGHT SOURCE
      17. | 6.17 UK MARKET ANALYSIS BY MATERIAL
      18. | 6.18 UK MARKET ANALYSIS BY WAVELENGTH
      19. | 6.19 UK MARKET ANALYSIS BY END USER
      20. | 6.20 FRANCE MARKET ANALYSIS BY LIGHT SOURCE
      21. | 6.21 FRANCE MARKET ANALYSIS BY MATERIAL
      22. | 6.22 FRANCE MARKET ANALYSIS BY WAVELENGTH
      23. | 6.23 FRANCE MARKET ANALYSIS BY END USER
      24. | 6.24 RUSSIA MARKET ANALYSIS BY LIGHT SOURCE
      25. | 6.25 RUSSIA MARKET ANALYSIS BY MATERIAL
      26. | 6.26 RUSSIA MARKET ANALYSIS BY WAVELENGTH
      27. | 6.27 RUSSIA MARKET ANALYSIS BY END USER
      28. | 6.28 ITALY MARKET ANALYSIS BY LIGHT SOURCE
      29. | 6.29 ITALY MARKET ANALYSIS BY MATERIAL
      30. | 6.30 ITALY MARKET ANALYSIS BY WAVELENGTH
      31. | 6.31 ITALY MARKET ANALYSIS BY END USER
      32. | 6.32 SPAIN MARKET ANALYSIS BY LIGHT SOURCE
      33. | 6.33 SPAIN MARKET ANALYSIS BY MATERIAL
      34. | 6.34 SPAIN MARKET ANALYSIS BY WAVELENGTH
      35. | 6.35 SPAIN MARKET ANALYSIS BY END USER
      36. | 6.36 REST OF EUROPE MARKET ANALYSIS BY LIGHT SOURCE
      37. | 6.37 REST OF EUROPE MARKET ANALYSIS BY MATERIAL
      38. | 6.38 REST OF EUROPE MARKET ANALYSIS BY WAVELENGTH
      39. | 6.39 REST OF EUROPE MARKET ANALYSIS BY END USER
      40. | 6.40 APAC MARKET ANALYSIS
      41. | 6.41 CHINA MARKET ANALYSIS BY LIGHT SOURCE
      42. | 6.42 CHINA MARKET ANALYSIS BY MATERIAL
      43. | 6.43 CHINA MARKET ANALYSIS BY WAVELENGTH
      44. | 6.44 CHINA MARKET ANALYSIS BY END USER
      45. | 6.45 INDIA MARKET ANALYSIS BY LIGHT SOURCE
      46. | 6.46 INDIA MARKET ANALYSIS BY MATERIAL
      47. | 6.47 INDIA MARKET ANALYSIS BY WAVELENGTH
      48. | 6.48 INDIA MARKET ANALYSIS BY END USER
      49. | 6.49 JAPAN MARKET ANALYSIS BY LIGHT SOURCE
      50. | 6.50 JAPAN MARKET ANALYSIS BY MATERIAL
      51. | 6.51 JAPAN MARKET ANALYSIS BY WAVELENGTH
      52. | 6.52 JAPAN MARKET ANALYSIS BY END USER
      53. | 6.53 SOUTH KOREA MARKET ANALYSIS BY LIGHT SOURCE
      54. | 6.54 SOUTH KOREA MARKET ANALYSIS BY MATERIAL
      55. | 6.55 SOUTH KOREA MARKET ANALYSIS BY WAVELENGTH
      56. | 6.56 SOUTH KOREA MARKET ANALYSIS BY END USER
      57. | 6.57 MALAYSIA MARKET ANALYSIS BY LIGHT SOURCE
      58. | 6.58 MALAYSIA MARKET ANALYSIS BY MATERIAL
      59. | 6.59 MALAYSIA MARKET ANALYSIS BY WAVELENGTH
      60. | 6.60 MALAYSIA MARKET ANALYSIS BY END USER
      61. | 6.61 THAILAND MARKET ANALYSIS BY LIGHT SOURCE
      62. | 6.62 THAILAND MARKET ANALYSIS BY MATERIAL
      63. | 6.63 THAILAND MARKET ANALYSIS BY WAVELENGTH
      64. | 6.64 THAILAND MARKET ANALYSIS BY END USER
      65. | 6.65 INDONESIA MARKET ANALYSIS BY LIGHT SOURCE
      66. | 6.66 INDONESIA MARKET ANALYSIS BY MATERIAL
      67. | 6.67 INDONESIA MARKET ANALYSIS BY WAVELENGTH
      68. | 6.68 INDONESIA MARKET ANALYSIS BY END USER
      69. | 6.69 REST OF APAC MARKET ANALYSIS BY LIGHT SOURCE
      70. | 6.70 REST OF APAC MARKET ANALYSIS BY MATERIAL
      71. | 6.71 REST OF APAC MARKET ANALYSIS BY WAVELENGTH
      72. | 6.72 REST OF APAC MARKET ANALYSIS BY END USER
      73. | 6.73 SOUTH AMERICA MARKET ANALYSIS
      74. | 6.74 BRAZIL MARKET ANALYSIS BY LIGHT SOURCE
      75. | 6.75 BRAZIL MARKET ANALYSIS BY MATERIAL
      76. | 6.76 BRAZIL MARKET ANALYSIS BY WAVELENGTH
      77. | 6.77 BRAZIL MARKET ANALYSIS BY END USER
      78. | 6.78 MEXICO MARKET ANALYSIS BY LIGHT SOURCE
      79. | 6.79 MEXICO MARKET ANALYSIS BY MATERIAL
      80. | 6.80 MEXICO MARKET ANALYSIS BY WAVELENGTH
      81. | 6.81 MEXICO MARKET ANALYSIS BY END USER
      82. | 6.82 ARGENTINA MARKET ANALYSIS BY LIGHT SOURCE
      83. | 6.83 ARGENTINA MARKET ANALYSIS BY MATERIAL
      84. | 6.84 ARGENTINA MARKET ANALYSIS BY WAVELENGTH
      85. | 6.85 ARGENTINA MARKET ANALYSIS BY END USER
      86. | 6.86 REST OF SOUTH AMERICA MARKET ANALYSIS BY LIGHT SOURCE
      87. | 6.87 REST OF SOUTH AMERICA MARKET ANALYSIS BY MATERIAL
      88. | 6.88 REST OF SOUTH AMERICA MARKET ANALYSIS BY WAVELENGTH
      89. | 6.89 REST OF SOUTH AMERICA MARKET ANALYSIS BY END USER
      90. | 6.90 MEA MARKET ANALYSIS
      91. | 6.91 GCC COUNTRIES MARKET ANALYSIS BY LIGHT SOURCE
      92. | 6.92 GCC COUNTRIES MARKET ANALYSIS BY MATERIAL
      93. | 6.93 GCC COUNTRIES MARKET ANALYSIS BY WAVELENGTH
      94. | 6.94 GCC COUNTRIES MARKET ANALYSIS BY END USER
      95. | 6.95 SOUTH AFRICA MARKET ANALYSIS BY LIGHT SOURCE
      96. | 6.96 SOUTH AFRICA MARKET ANALYSIS BY MATERIAL
      97. | 6.97 SOUTH AFRICA MARKET ANALYSIS BY WAVELENGTH
      98. | 6.98 SOUTH AFRICA MARKET ANALYSIS BY END USER
      99. | 6.99 REST OF MEA MARKET ANALYSIS BY LIGHT SOURCE
      100. | 6.100 REST OF MEA MARKET ANALYSIS BY MATERIAL
      101. | 6.101 REST OF MEA MARKET ANALYSIS BY WAVELENGTH
      102. | 6.102 REST OF MEA MARKET ANALYSIS BY END USER
      103. | 6.103 KEY BUYING CRITERIA OF SEMICONDUCTOR & ELECTRONICS
      104. | 6.104 RESEARCH PROCESS OF MRFR
      105. | 6.105 DRO ANALYSIS OF SEMICONDUCTOR & ELECTRONICS
      106. | 6.106 DRIVERS IMPACT ANALYSIS: SEMICONDUCTOR & ELECTRONICS
      107. | 6.107 RESTRAINTS IMPACT ANALYSIS: SEMICONDUCTOR & ELECTRONICS
      108. | 6.108 SUPPLY / VALUE CHAIN: SEMICONDUCTOR & ELECTRONICS
      109. | 6.109 SEMICONDUCTOR & ELECTRONICS, BY LIGHT SOURCE, 2024 (% SHARE)
      110. | 6.110 SEMICONDUCTOR & ELECTRONICS, BY LIGHT SOURCE, 2024 TO 2035 (USD Million)
      111. | 6.111 SEMICONDUCTOR & ELECTRONICS, BY MATERIAL, 2024 (% SHARE)
      112. | 6.112 SEMICONDUCTOR & ELECTRONICS, BY MATERIAL, 2024 TO 2035 (USD Million)
      113. | 6.113 SEMICONDUCTOR & ELECTRONICS, BY WAVELENGTH, 2024 (% SHARE)
      114. | 6.114 SEMICONDUCTOR & ELECTRONICS, BY WAVELENGTH, 2024 TO 2035 (USD Million)
      115. | 6.115 SEMICONDUCTOR & ELECTRONICS, BY END USER, 2024 (% SHARE)
      116. | 6.116 SEMICONDUCTOR & ELECTRONICS, BY END USER, 2024 TO 2035 (USD Million)
      117. | 6.117 BENCHMARKING OF MAJOR COMPETITORS
    7. LIST OF TABLES
      1. | 7.1 LIST OF ASSUMPTIONS
      2. | | 7.1.1
      3. | 7.2 North America MARKET SIZE ESTIMATES; FORECAST
      4. | | 7.2.1 BY LIGHT SOURCE, 2025-2035 (USD Million)
      5. | | 7.2.2 BY MATERIAL, 2025-2035 (USD Million)
      6. | | 7.2.3 BY WAVELENGTH, 2025-2035 (USD Million)
      7. | | 7.2.4 BY END USER, 2025-2035 (USD Million)
      8. | 7.3 US MARKET SIZE ESTIMATES; FORECAST
      9. | | 7.3.1 BY LIGHT SOURCE, 2025-2035 (USD Million)
      10. | | 7.3.2 BY MATERIAL, 2025-2035 (USD Million)
      11. | | 7.3.3 BY WAVELENGTH, 2025-2035 (USD Million)
      12. | | 7.3.4 BY END USER, 2025-2035 (USD Million)
      13. | 7.4 Canada MARKET SIZE ESTIMATES; FORECAST
      14. | | 7.4.1 BY LIGHT SOURCE, 2025-2035 (USD Million)
      15. | | 7.4.2 BY MATERIAL, 2025-2035 (USD Million)
      16. | | 7.4.3 BY WAVELENGTH, 2025-2035 (USD Million)
      17. | | 7.4.4 BY END USER, 2025-2035 (USD Million)
      18. | 7.5 Europe MARKET SIZE ESTIMATES; FORECAST
      19. | | 7.5.1 BY LIGHT SOURCE, 2025-2035 (USD Million)
      20. | | 7.5.2 BY MATERIAL, 2025-2035 (USD Million)
      21. | | 7.5.3 BY WAVELENGTH, 2025-2035 (USD Million)
      22. | | 7.5.4 BY END USER, 2025-2035 (USD Million)
      23. | 7.6 Germany MARKET SIZE ESTIMATES; FORECAST
      24. | | 7.6.1 BY LIGHT SOURCE, 2025-2035 (USD Million)
      25. | | 7.6.2 BY MATERIAL, 2025-2035 (USD Million)
      26. | | 7.6.3 BY WAVELENGTH, 2025-2035 (USD Million)
      27. | | 7.6.4 BY END USER, 2025-2035 (USD Million)
      28. | 7.7 UK MARKET SIZE ESTIMATES; FORECAST
      29. | | 7.7.1 BY LIGHT SOURCE, 2025-2035 (USD Million)
      30. | | 7.7.2 BY MATERIAL, 2025-2035 (USD Million)
      31. | | 7.7.3 BY WAVELENGTH, 2025-2035 (USD Million)
      32. | | 7.7.4 BY END USER, 2025-2035 (USD Million)
      33. | 7.8 France MARKET SIZE ESTIMATES; FORECAST
      34. | | 7.8.1 BY LIGHT SOURCE, 2025-2035 (USD Million)
      35. | | 7.8.2 BY MATERIAL, 2025-2035 (USD Million)
      36. | | 7.8.3 BY WAVELENGTH, 2025-2035 (USD Million)
      37. | | 7.8.4 BY END USER, 2025-2035 (USD Million)
      38. | 7.9 Russia MARKET SIZE ESTIMATES; FORECAST
      39. | | 7.9.1 BY LIGHT SOURCE, 2025-2035 (USD Million)
      40. | | 7.9.2 BY MATERIAL, 2025-2035 (USD Million)
      41. | | 7.9.3 BY WAVELENGTH, 2025-2035 (USD Million)
      42. | | 7.9.4 BY END USER, 2025-2035 (USD Million)
      43. | 7.10 Italy MARKET SIZE ESTIMATES; FORECAST
      44. | | 7.10.1 BY LIGHT SOURCE, 2025-2035 (USD Million)
      45. | | 7.10.2 BY MATERIAL, 2025-2035 (USD Million)
      46. | | 7.10.3 BY WAVELENGTH, 2025-2035 (USD Million)
      47. | | 7.10.4 BY END USER, 2025-2035 (USD Million)
      48. | 7.11 Spain MARKET SIZE ESTIMATES; FORECAST
      49. | | 7.11.1 BY LIGHT SOURCE, 2025-2035 (USD Million)
      50. | | 7.11.2 BY MATERIAL, 2025-2035 (USD Million)
      51. | | 7.11.3 BY WAVELENGTH, 2025-2035 (USD Million)
      52. | | 7.11.4 BY END USER, 2025-2035 (USD Million)
      53. | 7.12 Rest of Europe MARKET SIZE ESTIMATES; FORECAST
      54. | | 7.12.1 BY LIGHT SOURCE, 2025-2035 (USD Million)
      55. | | 7.12.2 BY MATERIAL, 2025-2035 (USD Million)
      56. | | 7.12.3 BY WAVELENGTH, 2025-2035 (USD Million)
      57. | | 7.12.4 BY END USER, 2025-2035 (USD Million)
      58. | 7.13 APAC MARKET SIZE ESTIMATES; FORECAST
      59. | | 7.13.1 BY LIGHT SOURCE, 2025-2035 (USD Million)
      60. | | 7.13.2 BY MATERIAL, 2025-2035 (USD Million)
      61. | | 7.13.3 BY WAVELENGTH, 2025-2035 (USD Million)
      62. | | 7.13.4 BY END USER, 2025-2035 (USD Million)
      63. | 7.14 China MARKET SIZE ESTIMATES; FORECAST
      64. | | 7.14.1 BY LIGHT SOURCE, 2025-2035 (USD Million)
      65. | | 7.14.2 BY MATERIAL, 2025-2035 (USD Million)
      66. | | 7.14.3 BY WAVELENGTH, 2025-2035 (USD Million)
      67. | | 7.14.4 BY END USER, 2025-2035 (USD Million)
      68. | 7.15 India MARKET SIZE ESTIMATES; FORECAST
      69. | | 7.15.1 BY LIGHT SOURCE, 2025-2035 (USD Million)
      70. | | 7.15.2 BY MATERIAL, 2025-2035 (USD Million)
      71. | | 7.15.3 BY WAVELENGTH, 2025-2035 (USD Million)
      72. | | 7.15.4 BY END USER, 2025-2035 (USD Million)
      73. | 7.16 Japan MARKET SIZE ESTIMATES; FORECAST
      74. | | 7.16.1 BY LIGHT SOURCE, 2025-2035 (USD Million)
      75. | | 7.16.2 BY MATERIAL, 2025-2035 (USD Million)
      76. | | 7.16.3 BY WAVELENGTH, 2025-2035 (USD Million)
      77. | | 7.16.4 BY END USER, 2025-2035 (USD Million)
      78. | 7.17 South Korea MARKET SIZE ESTIMATES; FORECAST
      79. | | 7.17.1 BY LIGHT SOURCE, 2025-2035 (USD Million)
      80. | | 7.17.2 BY MATERIAL, 2025-2035 (USD Million)
      81. | | 7.17.3 BY WAVELENGTH, 2025-2035 (USD Million)
      82. | | 7.17.4 BY END USER, 2025-2035 (USD Million)
      83. | 7.18 Malaysia MARKET SIZE ESTIMATES; FORECAST
      84. | | 7.18.1 BY LIGHT SOURCE, 2025-2035 (USD Million)
      85. | | 7.18.2 BY MATERIAL, 2025-2035 (USD Million)
      86. | | 7.18.3 BY WAVELENGTH, 2025-2035 (USD Million)
      87. | | 7.18.4 BY END USER, 2025-2035 (USD Million)
      88. | 7.19 Thailand MARKET SIZE ESTIMATES; FORECAST
      89. | | 7.19.1 BY LIGHT SOURCE, 2025-2035 (USD Million)
      90. | | 7.19.2 BY MATERIAL, 2025-2035 (USD Million)
      91. | | 7.19.3 BY WAVELENGTH, 2025-2035 (USD Million)
      92. | | 7.19.4 BY END USER, 2025-2035 (USD Million)
      93. | 7.20 Indonesia MARKET SIZE ESTIMATES; FORECAST
      94. | | 7.20.1 BY LIGHT SOURCE, 2025-2035 (USD Million)
      95. | | 7.20.2 BY MATERIAL, 2025-2035 (USD Million)
      96. | | 7.20.3 BY WAVELENGTH, 2025-2035 (USD Million)
      97. | | 7.20.4 BY END USER, 2025-2035 (USD Million)
      98. | 7.21 Rest of APAC MARKET SIZE ESTIMATES; FORECAST
      99. | | 7.21.1 BY LIGHT SOURCE, 2025-2035 (USD Million)
      100. | | 7.21.2 BY MATERIAL, 2025-2035 (USD Million)
      101. | | 7.21.3 BY WAVELENGTH, 2025-2035 (USD Million)
      102. | | 7.21.4 BY END USER, 2025-2035 (USD Million)
      103. | 7.22 South America MARKET SIZE ESTIMATES; FORECAST
      104. | | 7.22.1 BY LIGHT SOURCE, 2025-2035 (USD Million)
      105. | | 7.22.2 BY MATERIAL, 2025-2035 (USD Million)
      106. | | 7.22.3 BY WAVELENGTH, 2025-2035 (USD Million)
      107. | | 7.22.4 BY END USER, 2025-2035 (USD Million)
      108. | 7.23 Brazil MARKET SIZE ESTIMATES; FORECAST
      109. | | 7.23.1 BY LIGHT SOURCE, 2025-2035 (USD Million)
      110. | | 7.23.2 BY MATERIAL, 2025-2035 (USD Million)
      111. | | 7.23.3 BY WAVELENGTH, 2025-2035 (USD Million)
      112. | | 7.23.4 BY END USER, 2025-2035 (USD Million)
      113. | 7.24 Mexico MARKET SIZE ESTIMATES; FORECAST
      114. | | 7.24.1 BY LIGHT SOURCE, 2025-2035 (USD Million)
      115. | | 7.24.2 BY MATERIAL, 2025-2035 (USD Million)
      116. | | 7.24.3 BY WAVELENGTH, 2025-2035 (USD Million)
      117. | | 7.24.4 BY END USER, 2025-2035 (USD Million)
      118. | 7.25 Argentina MARKET SIZE ESTIMATES; FORECAST
      119. | | 7.25.1 BY LIGHT SOURCE, 2025-2035 (USD Million)
      120. | | 7.25.2 BY MATERIAL, 2025-2035 (USD Million)
      121. | | 7.25.3 BY WAVELENGTH, 2025-2035 (USD Million)
      122. | | 7.25.4 BY END USER, 2025-2035 (USD Million)
      123. | 7.26 Rest of South America MARKET SIZE ESTIMATES; FORECAST
      124. | | 7.26.1 BY LIGHT SOURCE, 2025-2035 (USD Million)
      125. | | 7.26.2 BY MATERIAL, 2025-2035 (USD Million)
      126. | | 7.26.3 BY WAVELENGTH, 2025-2035 (USD Million)
      127. | | 7.26.4 BY END USER, 2025-2035 (USD Million)
      128. | 7.27 MEA MARKET SIZE ESTIMATES; FORECAST
      129. | | 7.27.1 BY LIGHT SOURCE, 2025-2035 (USD Million)
      130. | | 7.27.2 BY MATERIAL, 2025-2035 (USD Million)
      131. | | 7.27.3 BY WAVELENGTH, 2025-2035 (USD Million)
      132. | | 7.27.4 BY END USER, 2025-2035 (USD Million)
      133. | 7.28 GCC Countries MARKET SIZE ESTIMATES; FORECAST
      134. | | 7.28.1 BY LIGHT SOURCE, 2025-2035 (USD Million)
      135. | | 7.28.2 BY MATERIAL, 2025-2035 (USD Million)
      136. | | 7.28.3 BY WAVELENGTH, 2025-2035 (USD Million)
      137. | | 7.28.4 BY END USER, 2025-2035 (USD Million)
      138. | 7.29 South Africa MARKET SIZE ESTIMATES; FORECAST
      139. | | 7.29.1 BY LIGHT SOURCE, 2025-2035 (USD Million)
      140. | | 7.29.2 BY MATERIAL, 2025-2035 (USD Million)
      141. | | 7.29.3 BY WAVELENGTH, 2025-2035 (USD Million)
      142. | | 7.29.4 BY END USER, 2025-2035 (USD Million)
      143. | 7.30 Rest of MEA MARKET SIZE ESTIMATES; FORECAST
      144. | | 7.30.1 BY LIGHT SOURCE, 2025-2035 (USD Million)
      145. | | 7.30.2 BY MATERIAL, 2025-2035 (USD Million)
      146. | | 7.30.3 BY WAVELENGTH, 2025-2035 (USD Million)
      147. | | 7.30.4 BY END USER, 2025-2035 (USD Million)
      148. | 7.31 PRODUCT LAUNCH/PRODUCT DEVELOPMENT/APPROVAL
      149. | | 7.31.1
      150. | 7.32 ACQUISITION/PARTNERSHIP
      151. | | 7.32.1

    Collimating Lens Market Segmentation

    Collimating Lens Light Source Outlook (USD Million, 2019-2032)

    LED

    Laser

    Xenon Lamp

    Infrared Light

    RGB

    Collimating Lens Material Source Outlook (USD Million, 2019-2032)

    Molded Glass

    Molded Plastic

    Others

    Collimating Lens Wavelength Outlook (USD Million, 2019-2032)

    Less Than-1000 Nm

    1001-1500 Nm

    1501-2000 Nm

    2001Nm And Above

    Collimating Lens End User Outlook (USD Million, 2019-2032)

    Automobile

    Medical

    Lidar

    Light And Display Measurement

    Spectroscopy

    Interferometry

    Others

    Collimating Lens Regional Outlook (USD Million, 2019-2032)

    North America Outlook (USD Million, 2019-2032)

    North America Collimating Lens by Light Source

    LED

    Laser

    Xenon Lamp

    Infrared Light

    RGB

    North America Collimating Lens Material Source

    Molded Glass

    Molded Plastic

    Others

    North America Collimating Lens Wavelength

    Less Than-1000 Nm

    1001-1500 Nm

    1501-2000 Nm

    2001Nm And Above

    North America Collimating Lens End User

    Automobile

    Medical

    Lidar

    Light And Display Measurement

    Spectroscopy

    Interferometry

    Others

    US Outlook (USD Million, 2019-2032)

    US Collimating Lens by Light Source

    LED

    Laser

    Xenon Lamp

    Infrared Light

    RGB

    US Collimating Lens Material Source

    Molded Glass

    Molded Plastic

    Others

    US Collimating Lens Wavelength

    Less Than-1000 Nm

    1001-1500 Nm

    1501-2000 Nm

    2001Nm And Above

    US Collimating Lens End User

    Automobile

    Medical

    Lidar

    Light And Display Measurement

    Spectroscopy

    Interferometry

    Others

    CANADA Outlook (USD Million, 2019-2032)

    CANADA Collimating Lens by Light Source

    LED

    Laser

    Xenon Lamp

    Infrared Light

    RGB

    CANADA Collimating Lens Material Source

    Molded Glass

    Molded Plastic

    Others

    CANADA Collimating Lens Wavelength

    Less Than-1000 Nm

    1001-1500 Nm

    1501-2000 Nm

    2001Nm And Above

    CANADA Collimating Lens End User

    Automobile

    Medical

    Lidar

    Light And Display Measurement

    Spectroscopy

    Interferometry

    Others

    Europe Outlook (USD Million, 2019-2032)

    Europe Collimating Lens by Light Source

    LED

    Laser

    Xenon Lamp

    Infrared Light

    RGB

    Europe Collimating Lens Material Source

    Molded Glass

    Molded Plastic

    Others

    Europe Collimating Lens Wavelength

    Less Than-1000 Nm

    1001-1500 Nm

    1501-2000 Nm

    2001Nm And Above

    Europe Collimating Lens End User

    Automobile

    Medical

    Lidar

    Light And Display Measurement

    Spectroscopy

    Interferometry

    Others

    Germany Outlook (USD Million, 2019-2032)

    Germany Collimating Lens by Light Source

    LED

    Laser

    Xenon Lamp

    Infrared Light

    RGB

    Germany Collimating Lens Material Source

    Molded Glass

    Molded Plastic

    Others

    Germany Collimating Lens Wavelength

    Less Than-1000 Nm

    1001-1500 Nm

    1501-2000 Nm

    2001Nm And Above

    Germany Collimating Lens End User

    Automobile

    Medical

    Lidar

    Light And Display Measurement

    Spectroscopy

    Interferometry

    Others

    France Outlook (USD Million, 2019-2032)

    France Collimating Lens by Light Source

    LED

    Laser

    Xenon Lamp

    Infrared Light

    RGB

    France Collimating Lens Material Source

    Molded Glass

    Molded Plastic

    Others

    France Collimating Lens Wavelength

    Less Than-1000 Nm

    1001-1500 Nm

    1501-2000 Nm

    2001Nm And Above

    France Collimating Lens End User

    Automobile

    Medical

    Lidar

    Light And Display Measurement

    Spectroscopy

    Interferometry

    Others

    UK Outlook (USD Million, 2019-2032)

    UK Collimating Lens by Light Source

    LED

    Laser

    Xenon Lamp

    Infrared Light

    RGB

    UK Collimating Lens Material Source

    Molded Glass

    Molded Plastic

    Others

    UK Collimating Lens Wavelength

    Less Than-1000 Nm

    1001-1500 Nm

    1501-2000 Nm

    2001Nm And Above

    UK Collimating Lens End User

    Automobile

    Medical

    Lidar

    Light And Display Measurement

    Spectroscopy

    Interferometry

    Others

    ITALY Outlook (USD Million, 2019-2032)

    ITALY Collimating Lens by Light Source

    LED

    Laser

    Xenon Lamp

    Infrared Light

    RGB

    ITALY Collimating Lens Material Source

    Molded Glass

    Molded Plastic

    Others

    ITALY Collimating Lens Wavelength

    Less Than-1000 Nm

    1001-1500 Nm

    1501-2000 Nm

    2001Nm And Above

    ITALY Collimating Lens End User

    Automobile

    Medical

    Lidar

    Light And Display Measurement

    Spectroscopy

    Interferometry

    Others

    SPAIN Outlook (USD Million, 2019-2032)

    Spain Collimating Lens by Light Source

    LED

    Laser

    Xenon Lamp

    Infrared Light

    RGB

    Spain Collimating Lens Material Source

    Molded Glass

    Molded Plastic

    Others

    Spain Collimating Lens Wavelength

    Less Than-1000 Nm

    1001-1500 Nm

    1501-2000 Nm

    2001Nm And Above

    Spain Collimating Lens End User

    Automobile

    Medical

    Lidar

    Light And Display Measurement

    Spectroscopy

    Interferometry

    Others

    Rest Of Europe Outlook (USD Million, 2019-2032)

    REST OF EUROPE Collimating Lens by Light Source

    LED

    Laser

    Xenon Lamp

    Infrared Light

    RGB

    REST OF EUROPE Collimating Lens Material Source

    Molded Glass

    Molded Plastic

    Others

    REST OF EUROPE Collimating Lens Wavelength

    Less Than-1000 Nm

    1001-1500 Nm

    1501-2000 Nm

    2001Nm And Above

    REST OF EUROPE Collimating Lens End User

    Automobile

    Medical

    Lidar

    Light And Display Measurement

    Spectroscopy

    Interferometry

    Others

    Asia-Pacific Outlook (USD Million, 2019-2032)

    Asia-Pacific Collimating Lens by Light Source

    LED

    Laser

    Xenon Lamp

    Infrared Light

    RGB

    Asia-Pacific Collimating Lens Material Source

    Molded Glass

    Molded Plastic

    Others

    Asia-Pacific Collimating Lens Wavelength

    Less Than-1000 Nm

    1001-1500 Nm

    1501-2000 Nm

    2001Nm And Above

    Asia-Pacific Collimating Lens End User

    Automobile

    Medical

    Lidar

    Light And Display Measurement

    Spectroscopy

    Interferometry

    Others

    China Outlook (USD Million, 2019-2032)

    China Collimating Lens by Light Source

    LED

    Laser

    Xenon Lamp

    Infrared Light

    RGB

    China Collimating Lens Material Source

    Molded Glass

    Molded Plastic

    Others

    China Collimating Lens Wavelength

    Less Than-1000 Nm

    1001-1500 Nm

    1501-2000 Nm

    2001Nm And Above

    China Collimating Lens End User

    Automobile

    Medical

    Lidar

    Light And Display Measurement

    Spectroscopy

    Interferometry

    Others

    Japan Outlook (USD Million, 2019-2032)

    Japan Collimating Lens by Light Source

    LED

    Laser

    Xenon Lamp

    Infrared Light

    RGB

    Japan Collimating Lens Material Source

    Molded Glass

    Molded Plastic

    Others

    Japan Collimating Lens Wavelength

    Less Than-1000 Nm

    1001-1500 Nm

    1501-2000 Nm

    2001Nm And Above

    Japan Collimating Lens End User

    Automobile

    Medical

    Lidar

    Light And Display Measurement

    Spectroscopy

    Interferometry

    Others

    India Outlook (USD Million, 2019-2032)

    India Collimating Lens by Light Source

    LED

    Laser

    Xenon Lamp

    Infrared Light

    RGB

    India Collimating Lens Material Source

    Molded Glass

    Molded Plastic

    Others

    India Collimating Lens Wavelength

    Less Than-1000 Nm

    1001-1500 Nm

    1501-2000 Nm

    2001Nm And Above

    India Collimating Lens End User

    Automobile

    Medical

    Lidar

    Light And Display Measurement

    Spectroscopy

    Interferometry

    Others

    Australia Outlook (USD Million, 2019-2032)

    Australia Collimating Lens by Light Source

    LED

    Laser

    Xenon Lamp

    Infrared Light

    RGB

    Australia Collimating Lens Material Source

    Molded Glass

    Molded Plastic

    Others

    Australia Collimating Lens Wavelength

    Less Than-1000 Nm

    1001-1500 Nm

    1501-2000 Nm

    2001Nm And Above

    Australia Collimating Lens End User

    Automobile

    Medical

    Lidar

    Light And Display Measurement

    Spectroscopy

    Interferometry

    Others

    Rest of Asia-Pacific Outlook (USD Million, 2019-2032)

    Rest of Asia-Pacific Collimating Lens by Light Source

    LED

    Laser

    Xenon Lamp

    Infrared Light

    RGB

    Rest of Asia-Pacific Collimating Lens Material Source

    Molded Glass

    Molded Plastic

    Others

    Rest of Asia-Pacific Collimating Lens Wavelength

    Less Than-1000 Nm

    1001-1500 Nm

    1501-2000 Nm

    2001Nm And Above

    Rest of Asia-Pacific Collimating Lens End User

    Automobile

    Medical

    Lidar

    Light And Display Measurement

    Spectroscopy

    Interferometry

    Others

    Rest of the World Outlook (USD Million, 2019-2032)

    Rest of the World Collimating Lens by Light Source

    LED

    Laser

    Xenon Lamp

    Infrared Light

    RGB

    Rest of the World Collimating Lens Material Source

    Molded Glass

    Molded Plastic

    Others

    Rest of the World Collimating Lens Wavelength

    Less Than-1000 Nm

    1001-1500 Nm

    1501-2000 Nm

    2001Nm And Above

    Rest of the World Collimating Lens End User

    Automobile

    Medical

    Lidar

    Light And Display Measurement

    Spectroscopy

    Interferometry

    Others

    Middle East Outlook (USD Million, 2019-2032)

    Middle East Collimating Lens by Light Source

    LED

    Laser

    Xenon Lamp

    Infrared Light

    RGB

    Middle East Collimating Lens Material Source

    Molded Glass

    Molded Plastic

    Others

    Middle East Collimating Lens Wavelength

    Less Than-1000 Nm

    1001-1500 Nm

    1501-2000 Nm

    2001Nm And Above

    Middle East Collimating Lens End User

    Automobile

    Medical

    Lidar

    Light And Display Measurement

    Spectroscopy

    Interferometry

    Others

    Africa Outlook (USD Million, 2019-2032)

    Africa Collimating Lens by Light Source

    LED

    Laser

    Xenon Lamp

    Infrared Light

    RGB

    Africa Collimating Lens Material Source

    Molded Glass

    Molded Plastic

    Others

    Africa Collimating Lens Wavelength

    Less Than-1000 Nm

    1001-1500 Nm

    1501-2000 Nm

    2001Nm And Above

    Africa Collimating Lens End User

    Automobile

    Medical

    Lidar

    Light And Display Measurement

    Spectroscopy

    Interferometry

    Others

    Latin America Outlook (USD Million, 2019-2032)

    Latin America Collimating Lens by Light Source

    LED

    Laser

    Xenon Lamp

    Infrared Light

    RGB

    Latin America Collimating Lens Material Source

    Molded Glass

    Molded Plastic

    Others

    Latin America Collimating Lens Wavelength

    Less Than-1000 Nm

    1001-1500 Nm

    1501-2000 Nm

    2001Nm And Above

    Latin America Collimating Lens End User

    Automobile

    Medical

    Lidar

    Light And Display Measurement

    Spectroscopy

    Interferometry

    Others


    Infographic

    Free Sample Request

    Kindly complete the form below to receive a free sample of this Report

    Get Free Sample

    Customer Strories

    “I am very pleased with how market segments have been defined in a relevant way for my purposes (such as "Portable Freezers & refrigerators" and "last-mile"). In general the report is well structured. Thanks very much for your efforts.”

    Victoria Milne

    Founder
    Case Study
    Chemicals and Materials

    Compare Licence

    ×
    Features License Type
    Single User Multiuser License Enterprise User
    Price $4,950 $5,950 $7,250
    Maximum User Access Limit 1 User Upto 10 Users Unrestricted Access Throughout the Organization
    Free Customization
    Direct Access to Analyst
    Deliverable Format
    Platform Access
    Discount on Next Purchase 10% 15% 15%
    Printable Versions