Collimating Lens Market Segmentation
Collimating Lens Market By Light Source (USD Million, 2025-2035)
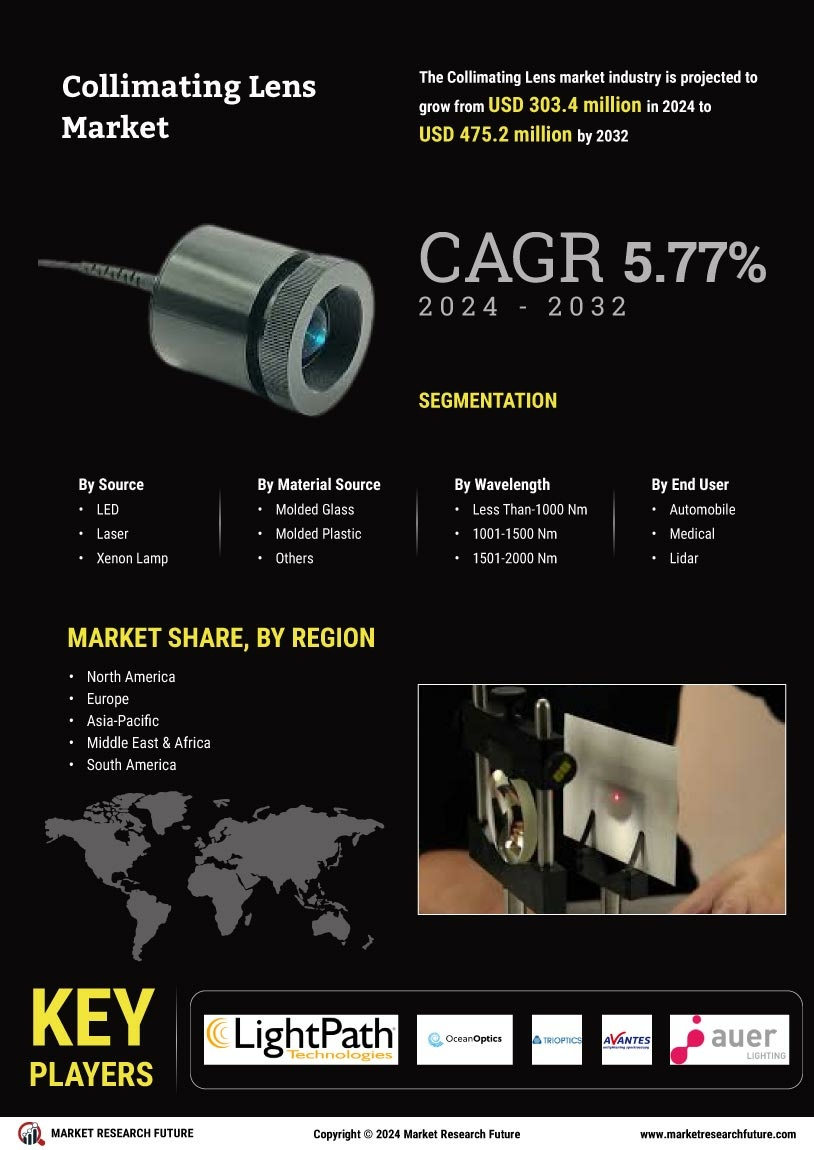
- LED
- Laser
- Xenon Lamp
- Infrared Light
- RGB
Collimating Lens Market By Material (USD Million, 2025-2035)
- Molded Glass
- Molded Plastic
- Others
Collimating Lens Market By Wavelength (USD Million, 2025-2035)
- Less Than-1000 Nm
- 1001-1500 Nm
- 1501-2000 Nm
- 2001 Nm And Above
Collimating Lens Market By End User (USD Million, 2025-2035)
- Collimating Lens Market
- Medical
- Lidar
- Light And Display Measurement
- Spectroscopy
- Interferometry
- Others