ID: MRFR/SEM/5831-HCR | February 2021 | Region: Global | 100 pages
Market Synopsis
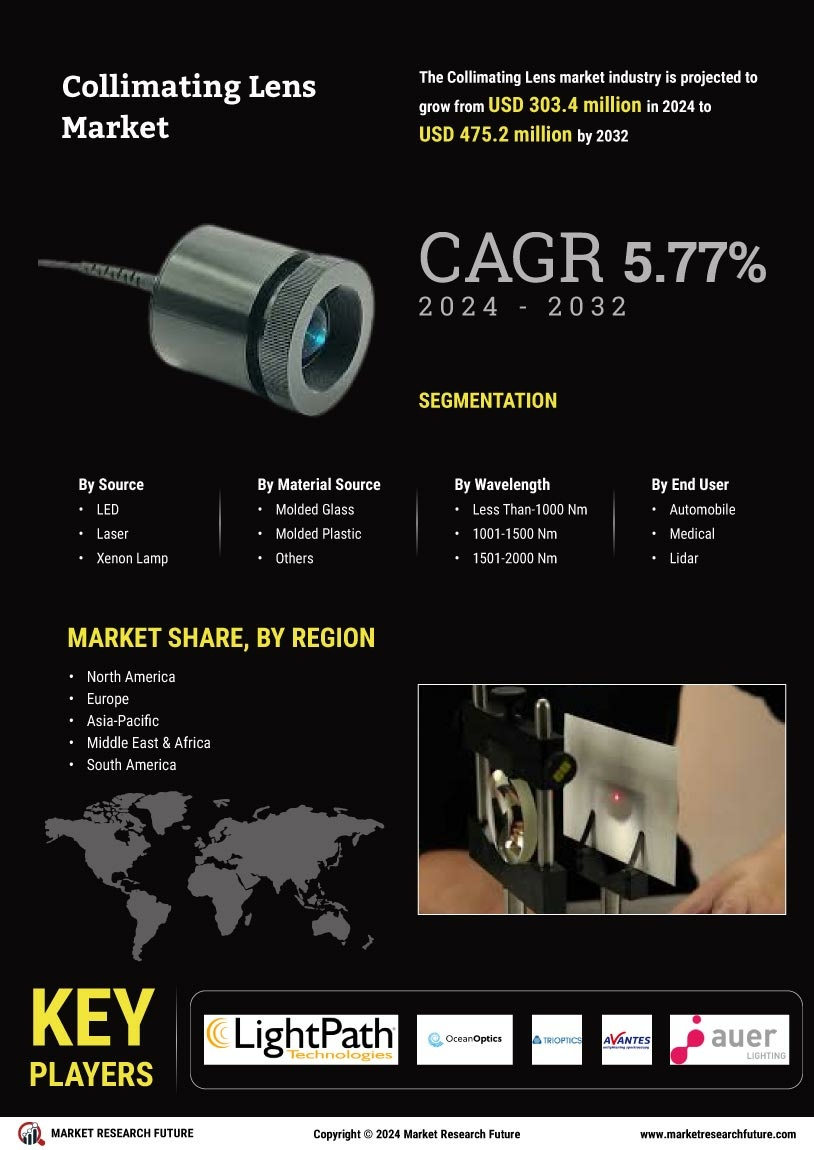
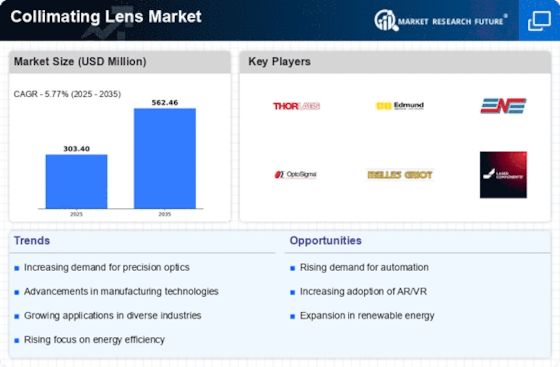
Globally, the collimating lens market is expected to grow from USD 266.0 million in 2018 to USD 371.9 million by 2023, at a CAGR of 6.9% during the forecast period, 2018–2013.
Collimating lenses are curved lenses that make light parallel when they enter into the spectrometer structure. This helps users in controlling view of the field, spatial resolution, illumination, and projection angles. The use of aspheric lenses over spherical lenses have helped in improving accuracy and usability of the collimating lenses, which has further fuelled growth of the market in the recent years.
Collimating lens has a broad range of application areas in the industry verticals of automotive, aerospace, government, industrial instrumentation, firefighting, medical instrumentation, biotechnology, air and water quality analysis, military, and many more. Automotive industry is the largest contributor in the collimating lens market. Many automobile manufacturers are increasingly adopting LED headlamps with collimating lenses to improve the usability and design of the vehicle headlamps. The market for LED headlamps is growing in all type of vehicles, from high-end to mid-range. Less energy costs, better light quality, and durability are the main factors driving wide adoption of collimating lens in the automotive as well as other application areas.
Global Collimating Lens Market
Source: MRFR Analysis
Segmentation.
The global collimating lens Market is segmented into light source, material, wavelength, application area, and region/country.
By light source, the market is segmented into LED, Laser, and others.
By material, the market is segmented into glass, plastic, and other materials.
By wavelength, the market is segmented into <1000 nm, 1000-1500 nm, 1500-2000 nm, and >2000 nm.
By application area, the market is segmented into spectroscopy, lidar, medical, automobile, interferometry, light and display measurement, and others.
By region, the market is segmented into North America, Europe, Asia-Pacific, and rest of the world.
Regional Analysis
The global market for collimating lens market is estimated to grow at a significant rate during the forecast period from 2018 to 2023. The geographical analysis of global printed electronics market is studied for North America, Europe, Asia-Pacific, and rest of the world.
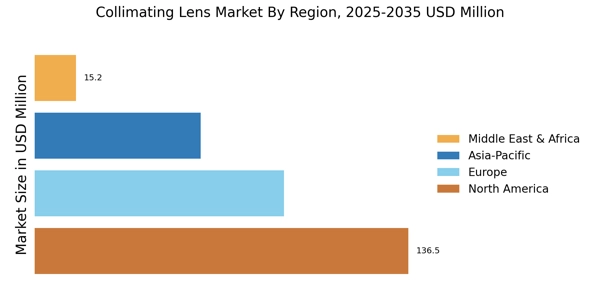
North America is expected to dominate the collimating lens market during the forecast period. North America region is considered as most advanced region in terms of development and adoption of innovative technologies in the field of optics. The region has a huge potential for revenue generation in the collimating lens market, particularly from automotive industry verticals. US is expected to be the dominating country in the collimating lens market in North America region during the forecast period.
Asia-Pacific is expected to grow at the fastest rate during the forecast period. The growing automotive industry in this region has surged the growth of collimating lens in the regional market. Increasing adoption of collimating lenses in LED headlamps of vehicles boosts growth of the market in this region. China, Japan, and India have been the leading countries in the APAC region in terms of market share and this trend is expected to continue in the upcoming years.
Competitive Analysis
In the collimating lens market, the leading vendors have adopted various organica and inorganic growth strategies, such as new product launches/product enhanements, partnerships, acquisitions, and business expansion to increase their global presence and acquire new customers. In the upcoming years, the competition among the major vendors is expected to intensify with the launch of many innovative products in the market..
Key players
The prominent players in collimating lens market are Ocean Optics, Inc. (US), Trioptics GmbH (Germany), Auer Lighting GmbH (Germany), LightPath Technologies, Inc. (US), IPG Photonics Corporation (US), Avantes BV (The Netherlands), Ingeneric GmbH (Germany), Thorlabs, Inc. (US), Optikos Corporation (US), and The Optoelectronics Co. Ltd. (UK).
Intended Audience
Frequently Asked Questions (FAQ) :
Collimating lens are used in industries like military, industrial instrumentation, government, medical instrumentation, firefighting, automotive, air and water quality analysis, biotechnology, aerospace, and many more.
LED, laser and others are the segments, as per the light source.
Lidar, spectroscopy, automobile, medical, light and display measurement, and interferometry, are the application areas considered in the report.
North America holds the most potential of achieving the top spot in the market.
India, Japan and China are the leading countries in Asia Pacific.
Table of Contents
1 Executive Summary
2 Market Introduction
2.1 Definition
2.2 Scope of the Study
2.3 List of Assumptions
2.4 Market Structure
3 Market Insights
4 Research Methodology
4.1 Research Process
4.2 Primary Research
4.3 Secondary Research
4.4 Market Size Estimation
4.5 Forecast Model
5 Market Outlook
5.1 Introduction
5.2 Market Dynamics
5.2.1 Drivers
5.2.2 Restraints
5.2.3 Opportunities
5.2.4 Challenges
5.3 Value Chain Analysis
5.4 Porter’s Five Forces Model
5.4.1 Threat of New Entrants
5.4.2 Bargaining Power of Suppliers
5.4.3 Bargaining Power of Buyers
5.4.4 Threat of Substitutes
5.4.5 Intensity of Rivalry
6 Global Collimating Lens Market, By Light Source
6.1 Overview
6.2 LED
6.2.1 Market Estimates & Forecast, 2018-2023
6.2.2 Market Estimates &Forecast, By Region/Country, 2018-2023
6.3 Laser
6.3.1 Market Estimates & Forecast, 2018-2023
6.3.2 Market Estimates &Forecast, By Region/Country, 2018-2023
6.4 Others
6.4.1 Market Estimates & Forecast, 2018-2023
6.4.2 Market Estimates &Forecast, By Region/Country, 2018-2023
7 Global Collimating Lens Market, By Material
7.1 Overview
7.2 Glass
7.2.1 Market Estimates & Forecast, 2018-2023
7.2.2 Market Estimates &Forecast, By Region/Country, 2018-2023
7.3 Plastic
7.3.1 Market Estimates & Forecast, 2018-2023
7.3.2 Market Estimates &Forecast, By Region/Country, 2018-2023
7.4 Other Materials
7.4.1 Market Estimates & Forecast, 2018-2023
7.4.2 Market Estimates &Forecast, By Region/Country, 2018-2023
8 Global Collimating Lens Market, By Wavelength
8.1 Overview
8.2 <1000 nm
8.2.1 Market Estimates & Forecast, 2018-2023
8.2.2 Market Estimates &Forecast, By Region/Country, 2018-2023
8.3 1000-1500 nm
8.3.1 Market Estimates & Forecast, 2018-2023
8.3.2 Market Estimates &Forecast, By Region/Country, 2018-2023
8.4 1500-2000 nm
8.4.1 Market Estimates & Forecast, 2018-2023
8.4.2 Market Estimates &Forecast, By Region/Country, 2018-2023
8.5 >2000 nm
8.4.1 Market Estimates & Forecast, 2018-2023
8.4.2 Market Estimates &Forecast, By Region/Country, 2018-2023
9 Global Collimating Lens Market, By Application Area
9.1 Overview
9.2 Spectroscopy
9.2.1 Market Estimates & Forecast, 2018-2023
9.2.2 Market Estimates &Forecast, By Region/Country, 2018-2023
9.3 Lidar
9.3.1 Market Estimates & Forecast, 2018-2023
9.3.2 Market Estimates &Forecast, By Region/Country, 2018-2023
9.4 Medical
9.4.1 Market Estimates & Forecast, 2018-2023
9.4.2 Market Estimates &Forecast, By Region/Country, 2018-2023
9.5 Automobile
9.5.1 Market Estimates & Forecast, 2018-2023
9.5.2 Market Estimates &Forecast, By Region/Country, 2018-2023
9.6 Interferometry
9.6.1 Market Estimates & Forecast, 2018-2023
9.6.2 Market Estimates &Forecast, By Region/Country, 2018-2023
9.7 Light and Display Measurement
9.7.1 Market Estimates & Forecast, 2018-2023
9.7.2 Market Estimates &Forecast, By Region/Country, 2018-2023
9.8 Others
9.8.1 Market Estimates & Forecast, 2018-2023
9.8.2 Market Estimates &Forecast, By Region/Country, 2018-2023
10 Global Collimating Lens Market, By Region
10.1 Overview
10.2 North America
10.2.1 Market Estimates & Forecast, By Country, 2018-2023
10.2.2 Market Estimates & Forecast, By Light Source, 2018-2023
10.2.3 Market Estimates & Forecast, By Material, 2018-2023
10.2.4 Market Estimates & Forecast, By Wavelength, 2018-2023
10.2.5 Market Estimates & Forecast, By Application Area, 2018-2023
10.2.6 US
10.2.6.1 Market Estimates & Forecast, By Light Source, 2018-2023
10.2.6.2 Market Estimates & Forecast, By Material, 2018-2023
10.2.6.3 Market Estimates & Forecast, By Wavelength, 2018-2023
10.2.6.4 Market Estimates & Forecast, By Application Area, 2018-2023
10.2.7 Canada
10.2.7.1 Market Estimates & Forecast, By Light Source, 2018-2023
10.2.7.2 Market Estimates & Forecast, By Material, 2018-2023
10.2.7.3 Market Estimates & Forecast, By Wavelength, 2018-2023
10.2.7.4 Market Estimates & Forecast, By Application Area, 2018-2023
10.2.8 Mexico
10.2.8.1 Market Estimates & Forecast, By Light Source, 2018-2023
10.2.8.2 Market Estimates & Forecast, By Material, 2018-2023
10.2.8.3 Market Estimates & Forecast, By Wavelength, 2018-2023
10.2.8.4 Market Estimates & Forecast, By Application Area, 2018-2023
10.3 Europe
10.3.1 Market Estimates & Forecast, By Country, 2018-2023
10.3.2 Market Estimates & Forecast, By Light Source, 2018-2023
10.3.3 Market Estimates & Forecast, By Material, 2018-2023
10.3.4 Market Estimates & Forecast, By Wavelength, 2018-2023
10.3.5 Market Estimates & Forecast, By Application Area, 2018-2023
10.3.6 Germany
10.3.6.1 Market Estimates & Forecast, By Light Source, 2018-2023
10.3.6.2 Market Estimates & Forecast, By Material, 2018-2023
10.2.6.3 Market Estimates & Forecast, By Wavelength, 2018-2023
10.2.6.4 Market Estimates & Forecast, By Application Area, 2018-2023
10.3.7 UK
10.3.7.1 Market Estimates & Forecast, By Light Source, 2018-2023
10.3.7.2 Market Estimates & Forecast, By Material, 2018-2023
10.2.7.3 Market Estimates & Forecast, By Wavelength, 2018-2023
10.2.7.4 Market Estimates & Forecast, By Application Area, 2018-2023
10.3.8 France
10.3.8.1 Market Estimates & Forecast, By Light Source, 2018-2023
10.3.8.2 Market Estimates & Forecast, By Material, 2018-2023
10.2.8.3 Market Estimates & Forecast, By Wavelength, 2018-2023
10.2.8.4 Market Estimates & Forecast, By Application Area, 2018-2023
10.3.9 Rest of Europe
10.3.9.1 Market Estimates & Forecast, By Light Source, 2018-2023
10.3.9.2 Market Estimates & Forecast, By Material, 2018-2023
10.2.9.3 Market Estimates & Forecast, By Wavelength, 2018-2023
10.2.9.4 Market Estimates & Forecast, By Application Area, 2018-2023
10.4 Asia Pacific
10.4.1 Market Estimates & Forecast, By Country, 2018-2023
10.4.2 Market Estimates & Forecast, By Light Source, 2018-2023
10.4.3 Market Estimates & Forecast, By Material, 2018-2023
10.4.4 Market Estimates & Forecast, By Wavelength, 2018-2023
10.4.5 Market Estimates & Forecast, By Application Area, 2018-2023
10.4.6 China
10.4.6.1 Market Estimates & Forecast, By Light Source, 2018-2023
10.4.6.2 Market Estimates & Forecast, By Material, 2018-2023
10.2.6.3 Market Estimates & Forecast, By Wavelength, 2018-2023
10.2.6.4 Market Estimates & Forecast, By Application Area, 2018-2023
10.4.7 Japan
10.4.7.1 Market Estimates & Forecast, By Light Source, 2018-2023
10.4.7.2 Market Estimates & Forecast, By Material, 2018-2023
10.2.7.3 Market Estimates & Forecast, By Wavelength, 2018-2023
10.2.7.4 Market Estimates & Forecast, By Application Area, 2018-2023
10.4.8 India
10.4.8.1 Market Estimates & Forecast, By Light Source, 2018-2023
10.4.8.2 Market Estimates & Forecast, By Material, 2018-2023
10.2.8.3 Market Estimates & Forecast, By Wavelength, 2018-2023
10.2.8.4 Market Estimates & Forecast, By Application Area, 2018-2023
10.4.9 Rest of Asia Pacific
10.4.9.1 Market Estimates & Forecast, By Light Source, 2018-2023
10.4.9.2 Market Estimates & Forecast, By Material, 2018-2023
10.2.9.3 Market Estimates & Forecast, By Wavelength, 2018-2023
10.2.9.4 Market Estimates & Forecast, By Application Area, 2018-2023
10.5 Rest of the World
10.5.1 Market Estimates & Forecast, By Country, 2018-2023
10.5.2 Market Estimates & Forecast, By Light Source, 2018-2023
10.5.3 Market Estimates & Forecast, By Material, 2018-2023
10.5.4 Market Estimates & Forecast, By Wavelength, 2018-2023
10.5.5 Market Estimates & Forecast, By Application Area, 2018-2023
10.5.6 Middle East and Africa
10.5.6.1 Market Estimates & Forecast, By Light Source, 2018-2023
10.5.6.2 Market Estimates & Forecast, By Material, 2018-2023
10.2.6.3 Market Estimates & Forecast, By Wavelength, 2018-2023
10.2.6.4 Market Estimates & Forecast, By Application Area, 2018-2023
10.5.7 Latin America
10.5.7.1 Market Estimates & Forecast, By Light Source, 2018-2023
10.5.7.2 Market Estimates & Forecast, By Material, 2018-2023
10.2.7.3 Market Estimates & Forecast, By Wavelength, 2018-2023
10.2.7.4 Market Estimates & Forecast, By Application Area, 2018-2023
11 Competitive Landscape
11.1 Competitive Scenario
11.1.1 Competitive Benchmarking of the Collimating Lens
12 Company Profiles
12.1 Ocean Optics, Inc.
12.1.1 Company Overview
12.1.2 Financial Overview
12.1.3 Product Offerings
12.1.4 Key Developments
12.1.5 SWOT Analysis
12.1.6 Key Strategy
12.2 Trioptics GmbH
12.2.1 Company Overview
12.2.2 Financial Overview
12.2.3 Product Offerings
12.2.4 Key Developments
12.2.5 SWOT Analysis
12.2.6 Key Strategy
12.3 Auer Lighting GmbH
12.3.1 Company Overview
12.3.2 Financial Overview
12.3.3 Product Offerings
12.3.4 Key Developments
12.3.5 SWOT Analysis
12.3.6 Key Strategy
12.4 LightPath Technologies, Inc.
12.4.1 Company Overview
12.4.2 Financial Overview
12.4.3 Product Offerings
12.4.4 Key Developments
12.4.5 SWOT Analysis
12.4.6 Key Strategy
12.5 IPG Photonics Corporation
12.5.1 Company Overview
12.5.2 Financial Overview
12.5.3 Product Offerings
12.5.4 Key Developments
12.5.5 SWOT Analysis
12.5.6 Key Strategy
12.6 Avantes BV
12.6.1 Company Overview
12.6.2 Financial Overview
12.6.3 Product Offerings
12.6.4 Key Developments
12.6.5 SWOT Analysis
12.6.6 Key Strategy
12.7 Ingeneric GmbH
12.7.1 Company Overview
12.7.2 Financial Overview
12.7.3 Product Offerings
12.7.4 Key Developments
12.7.5 SWOT Analysis
12.7.6 Key Strategy
12.8 Thorlabs, Inc.
12.8.1 Company Overview
12.8.2 Financial Overview
12.8.3 Product Offerings
12.8.4 Key Developments
12.8.5 SWOT Analysis
12.8.6 Key Strategy
12.9 Optikos Corporation
12.9.1 Company Overview
12.9.2 Financial Overview
12.9.3 Product Offerings
12.9.4 Key Developments
12.9.5 SWOT Analysis
12.9.6 Key Strategy
12.10 The Optoelectronics Co. Ltd.
12.10.1 Company Overview
12.10.2 Financial Overview
12.10.3 Product Offerings
12.10.4 Key Developments
12.10.5 SWOT Analysis
12.10.6 Key Strategy
LIST OF TABLES
Table1 Global Collimating Lens Market, By Region, 2018-2023
Table2 North America Collimating Lens, By Country, 2018-2023
Table3 Europe Collimating Lens, By Country, 2018-2023
Table4 Asia-Pacific Collimating Lens, By Country, 2018-2023
Table5 Rest of the World Collimating Lens, By Country, 2018-2023
Table6 North America Collimating Lens, By Light Source, By Country, 2018-2023
Table7 Europe Collimating Lens, By Light Source, By Country, 2018-2023
Table8 Asia-Pacific Collimating Lens, By Light Source, By Country, 2018-2023
Table9 Rest of the World Collimating Lens, By Light Source, By Country, 2018-2023
Table10 North America Collimating Lens, By Material, By Country, 2018-2023
Table11 Europe Collimating Lens, By Material, By Country, 2018-2023
Table12 Asia-Pacific Collimating Lens, By Material, By Country, 2018-2023
Table13 Rest of the World Collimating Lens, By Material, By Country, 2018-2023
Table14 North America Collimating Lens, By Wavelength, By Country, 2018-2023
Table15 Europe Collimating Lens, By Wavelength, By Country, 2018-2023
Table16 Asia-Pacific Collimating Lens, By Wavelength, By Country, 2018-2023
Table17 Rest of the World Collimating Lens, By Wavelength, By Country, 2018-2023
Table18 North America Collimating Lens, By Application Area, By Country, 2018-2023
Table19 Europe Collimating Lens, By Application Area, By Country, 2018-2023
Table20 Asia-Pacific Collimating Lens, By Application Area, By Country, 2018-2023
Table21 Rest of the World Collimating Lens, By Application Area, By Country, 2018-2023
LIST OF FIGURES
FIGURE 1 Global Collimating Lens Market: Segmentation
FIGURE 2 Forecast Methodology
FIGURE 3 Porter’s Five Forces Analysis of Global Collimating Lens Market
FIGURE 4 Value Chain of Global Collimating Lens Market
FIGURE 5 Share of Global Collimating Lens Market by Country, 2017
FIGURE 6 Global Collimating Lens Market, 2018-2023
FIGURE 7 Global Collimating Lens Market Size, By Light Source, 2018 to 2023
FIGURE 8 Share of Global Collimating Lens Market, By Light Source, 2017
FIGURE 9 North America Collimating Lens Size, By Light Source, 2018 to 2023
FIGURE 10 Share of North America Collimating Lens, By Light Source, 2017
FIGURE 11 Europe Collimating Lens Size, By Light Source, 2018 to 2023
FIGURE 12 Share of Europe Collimating Lens, By Light Source, 2017
FIGURE 13 Asia-Pacific Collimating Lens Size, By Light Source, 2018 to 2023
FIGURE 14 Share of Asia-Pacific Collimating Lens, By Light Source, 2017
FIGURE 15 Rest of the World Collimating Lens Size, By Light Source, 2018 to 2023
FIGURE 16 Share of Rest of the World Collimating Lens, By Light Source, 2017
FIGURE 17 North America Collimating Lens Size, By Application Area, 2018 to 2023
FIGURE 18 Share of North America Collimating Lens, By Application Area, 2017
FIGURE 19 Europe Collimating Lens Size, By Application Area, 2018 to 2023
FIGURE 20 Share of Europe Collimating Lens, By Application Area, 2017
FIGURE 21 Asia-Pacific Collimating Lens Size, By Application Area, 2018 to 2023
FIGURE 22 Share of Asia-Pacific Collimating Lens, By Application Area, 2017
FIGURE 23 Rest of the World Collimating Lens Size, By Application Area, 2018 to 2023
FIGURE 24 Share of Rest of the World Collimating Lens, By Application Area, 2017