Request Free Sample ×

Kindly complete the form below to receive a free sample of this Report

* Please use a valid business email

Leading companies partner with us for data-driven Insights

clients tt-cursor
Hero Background

China Healthcare CRM Market

ID: MRFR/HC/47686-HCR
200 Pages
Rahul Gotadki
Last Updated: April 24, 2026

China Healthcare CRM Market Research Report: Size, Share, Trend Analysis By Applications (Patient Management, Sales Management, Marketing Automation, Reporting and Analytics, Customer Service), By Deployment Mode (On-Premises, Cloud-Based, Hybrid), By End-user (Healthcare Providers, Pharmaceutical Companies, Insurance Companies, Research Organizations), and By Product Type (Software Solutions, Consulting Services, Integration Services) - Growth Outlook & Industry Forecast 2025 To 2035

Share:
Download PDF ×

We do not share your information with anyone. However, we may send you emails based on your report interest from time to time. You may contact us at any time to opt-out.

  1. 1 SECTION I: EXECUTIVE SUMMARY AND KEY HIGHLIGHTS
    1. 1.1 EXECUTIVE SUMMARY
      1. 1.1.1 Market Overview
      2. 1.1.2 Key Findings
      3. 1.1.3 Market Segmentation
      4. 1.1.4 Competitive Landscape
      5. 1.1.5 Challenges and Opportunities
      6. 1.1.6 Future Outlook
  2. 2 SECTION II: SCOPING, METHODOLOGY AND MARKET STRUCTURE
    1. 2.1 MARKET INTRODUCTION
      1. 2.1.1 Definition
      2. 2.1.2 Scope of the study
        1. 2.1.2.1 Research Objective
        2. 2.1.2.2 Assumption
        3. 2.1.2.3 Limitations
    2. 2.2 RESEARCH METHODOLOGY
      1. 2.2.1 Overview
      2. 2.2.2 Data Mining
      3. 2.2.3 Secondary Research
      4. 2.2.4 Primary Research
        1. 2.2.4.1 Primary Interviews and Information Gathering Process
        2. 2.2.4.2 Breakdown of Primary Respondents
      5. 2.2.5 Forecasting Model
      6. 2.2.6 Market Size Estimation
        1. 2.2.6.1 Bottom-Up Approach
        2. 2.2.6.2 Top-Down Approach
      7. 2.2.7 Data Triangulation
      8. 2.2.8 Validation
  3. 3 SECTION III: QUALITATIVE ANALYSIS
    1. 3.1 MARKET DYNAMICS
      1. 3.1.1 Overview
      2. 3.1.2 Drivers
      3. 3.1.3 Restraints
      4. 3.1.4 Opportunities
    2. 3.2 MARKET FACTOR ANALYSIS
      1. 3.2.1 Value chain Analysis
      2. 3.2.2 Porter's Five Forces Analysis
        1. 3.2.2.1 Bargaining Power of Suppliers
        2. 3.2.2.2 Bargaining Power of Buyers
        3. 3.2.2.3 Threat of New Entrants
        4. 3.2.2.4 Threat of Substitutes
        5. 3.2.2.5 Intensity of Rivalry
      3. 3.2.3 COVID-19 Impact Analysis
        1. 3.2.3.1 Market Impact Analysis
        2. 3.2.3.2 Regional Impact
        3. 3.2.3.3 Opportunity and Threat Analysis
  4. 4 SECTION IV: QUANTITATIVE ANALYSIS
    1. 4.1 Pharmaceutical, BY Application (USD Million)
      1. 4.1.1 Patient Management
      2. 4.1.2 Sales Management
      3. 4.1.3 Marketing Automation
      4. 4.1.4 Reporting and Analytics
      5. 4.1.5 Customer Service
    2. 4.2 Pharmaceutical, BY Deployment Mode (USD Million)
      1. 4.2.1 On-Premises
      2. 4.2.2 Cloud-Based
      3. 4.2.3 Hybrid
    3. 4.3 Pharmaceutical, BY End User (USD Million)
      1. 4.3.1 Healthcare Providers
      2. 4.3.2 Pharmaceutical Companies
      3. 4.3.3 Insurance Companies
      4. 4.3.4 Research Organizations
    4. 4.4 Pharmaceutical, BY Product Type (USD Million)
      1. 4.4.1 Software Solutions
      2. 4.4.2 Consulting Services
      3. 4.4.3 Integration Services
  5. 5 SECTION V: COMPETITIVE ANALYSIS
    1. 5.1 Competitive Landscape
      1. 5.1.1 Overview
      2. 5.1.2 Competitive Analysis
      3. 5.1.3 Market share Analysis
      4. 5.1.4 Major Growth Strategy in the Pharmaceutical
      5. 5.1.5 Competitive Benchmarking
      6. 5.1.6 Leading Players in Terms of Number of Developments in the Pharmaceutical
      7. 5.1.7 Key developments and growth strategies
        1. 5.1.7.1 New Product Launch/Service Deployment
        2. 5.1.7.2 Merger & Acquisitions
        3. 5.1.7.3 Joint Ventures
      8. 5.1.8 Major Players Financial Matrix
        1. 5.1.8.1 Sales and Operating Income
        2. 5.1.8.2 Major Players R&D Expenditure. 2023
    2. 5.2 Company Profiles
      1. 5.2.1 Epic Systems Corporation (US)
        1. 5.2.1.1 Financial Overview
        2. 5.2.1.2 Products Offered
        3. 5.2.1.3 Key Developments
        4. 5.2.1.4 SWOT Analysis
        5. 5.2.1.5 Key Strategies
      2. 5.2.2 Salesforce.com Inc. (US)
        1. 5.2.2.1 Financial Overview
        2. 5.2.2.2 Products Offered
        3. 5.2.2.3 Key Developments
        4. 5.2.2.4 SWOT Analysis
        5. 5.2.2.5 Key Strategies
      3. 5.2.3 Cerner Corporation (US)
        1. 5.2.3.1 Financial Overview
        2. 5.2.3.2 Products Offered
        3. 5.2.3.3 Key Developments
        4. 5.2.3.4 SWOT Analysis
        5. 5.2.3.5 Key Strategies
      4. 5.2.4 Allscripts Healthcare Solutions Inc. (US)
        1. 5.2.4.1 Financial Overview
        2. 5.2.4.2 Products Offered
        3. 5.2.4.3 Key Developments
        4. 5.2.4.4 SWOT Analysis
        5. 5.2.4.5 Key Strategies
      5. 5.2.5 McKesson Corporation (US)
        1. 5.2.5.1 Financial Overview
        2. 5.2.5.2 Products Offered
        3. 5.2.5.3 Key Developments
        4. 5.2.5.4 SWOT Analysis
        5. 5.2.5.5 Key Strategies
      6. 5.2.6 Athenahealth Inc. (US)
        1. 5.2.6.1 Financial Overview
        2. 5.2.6.2 Products Offered
        3. 5.2.6.3 Key Developments
        4. 5.2.6.4 SWOT Analysis
        5. 5.2.6.5 Key Strategies
      7. 5.2.7 NextGen Healthcare Inc. (US)
        1. 5.2.7.1 Financial Overview
        2. 5.2.7.2 Products Offered
        3. 5.2.7.3 Key Developments
        4. 5.2.7.4 SWOT Analysis
        5. 5.2.7.5 Key Strategies
      8. 5.2.8 Oracle Corporation (US)
        1. 5.2.8.1 Financial Overview
        2. 5.2.8.2 Products Offered
        3. 5.2.8.3 Key Developments
        4. 5.2.8.4 SWOT Analysis
        5. 5.2.8.5 Key Strategies
    3. 5.3 Appendix
      1. 5.3.1 References
      2. 5.3.2 Related Reports
  6. 6 LIST OF FIGURES
    1. 6.1 MARKET SYNOPSIS
    2. 6.2 CHINA MARKET ANALYSIS BY APPLICATION
    3. 6.3 CHINA MARKET ANALYSIS BY DEPLOYMENT MODE
    4. 6.4 CHINA MARKET ANALYSIS BY END USER
    5. 6.5 CHINA MARKET ANALYSIS BY PRODUCT TYPE
    6. 6.6 KEY BUYING CRITERIA OF PHARMACEUTICAL
    7. 6.7 RESEARCH PROCESS OF MRFR
    8. 6.8 DRO ANALYSIS OF PHARMACEUTICAL
    9. 6.9 DRIVERS IMPACT ANALYSIS: PHARMACEUTICAL
    10. 6.10 RESTRAINTS IMPACT ANALYSIS: PHARMACEUTICAL
    11. 6.11 SUPPLY / VALUE CHAIN: PHARMACEUTICAL
    12. 6.12 PHARMACEUTICAL, BY APPLICATION, 2024 (% SHARE)
    13. 6.13 PHARMACEUTICAL, BY APPLICATION, 2024 TO 2035 (USD Million)
    14. 6.14 PHARMACEUTICAL, BY DEPLOYMENT MODE, 2024 (% SHARE)
    15. 6.15 PHARMACEUTICAL, BY DEPLOYMENT MODE, 2024 TO 2035 (USD Million)
    16. 6.16 PHARMACEUTICAL, BY END USER, 2024 (% SHARE)
    17. 6.17 PHARMACEUTICAL, BY END USER, 2024 TO 2035 (USD Million)
    18. 6.18 PHARMACEUTICAL, BY PRODUCT TYPE, 2024 (% SHARE)
    19. 6.19 PHARMACEUTICAL, BY PRODUCT TYPE, 2024 TO 2035 (USD Million)
    20. 6.20 BENCHMARKING OF MAJOR COMPETITORS
  7. 7 LIST OF TABLES
    1. 7.1 LIST OF ASSUMPTIONS
  8. 7.1.1
    1. 7.2 China MARKET SIZE ESTIMATES; FORECAST
      1. 7.2.1 BY APPLICATION, 2025-2035 (USD Million)
      2. 7.2.2 BY DEPLOYMENT MODE, 2025-2035 (USD Million)
      3. 7.2.3 BY END USER, 2025-2035 (USD Million)
      4. 7.2.4 BY PRODUCT TYPE, 2025-2035 (USD Million)
    2. 7.3 PRODUCT LAUNCH/PRODUCT DEVELOPMENT/APPROVAL
  9. 7.3.1
    1. 7.4 ACQUISITION/PARTNERSHIP
  10. 7.4.1

China Pharmaceutical Market Segmentation

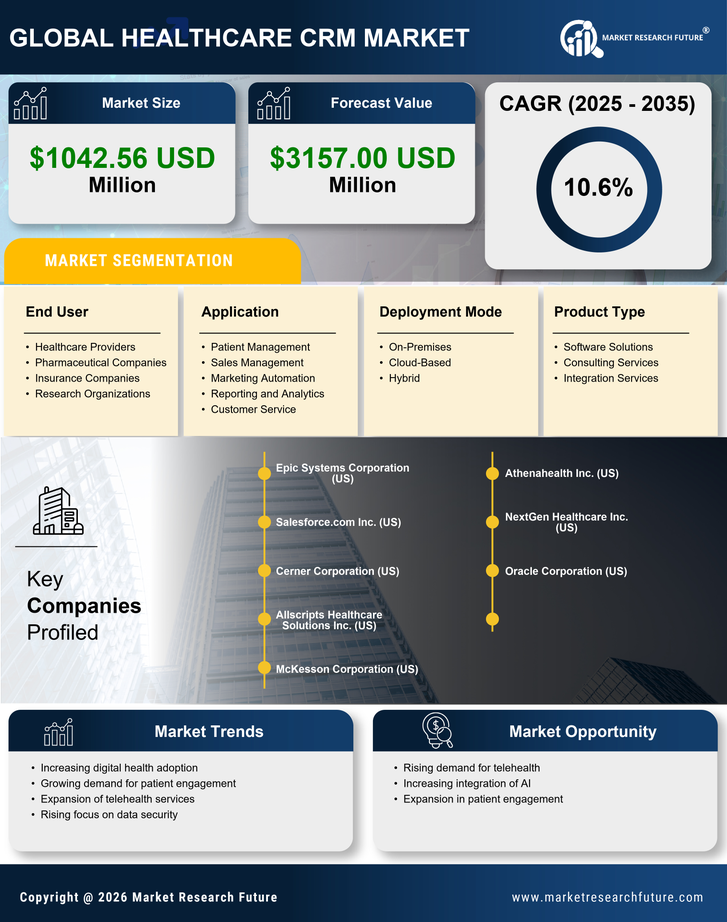
Pharmaceutical By Application (USD Million, 2025-2035)

  • Patient Management
  • Sales Management
  • Marketing Automation
  • Reporting and Analytics
  • Customer Service

Pharmaceutical By Deployment Mode (USD Million, 2025-2035)

  • On-Premises
  • Cloud-Based
  • Hybrid

Pharmaceutical By End User (USD Million, 2025-2035)

  • Healthcare Providers
  • Pharmaceutical Companies
  • Insurance Companies
  • Research Organizations

Pharmaceutical By Product Type (USD Million, 2025-2035)

  • Software Solutions
  • Consulting Services
  • Integration Services

Compare Licence

×
Features License Type
Single User Multiuser License Enterprise User
Price $4,950 $5,950 $7,250
Maximum User Access Limit 1 User Upto 10 Users Unrestricted Access Throughout the Organization
Free Customization
Direct Access to Analyst
Deliverable Format
Platform Access
Discount on Next Purchase 10% 15% 15%
Printable Versions