Cellular Modem Market (2026 – 2035)

ID: MRFR/SEM/27078-HCR 200 Pages Aarti Dhapte Last Updated: October 17, 2026
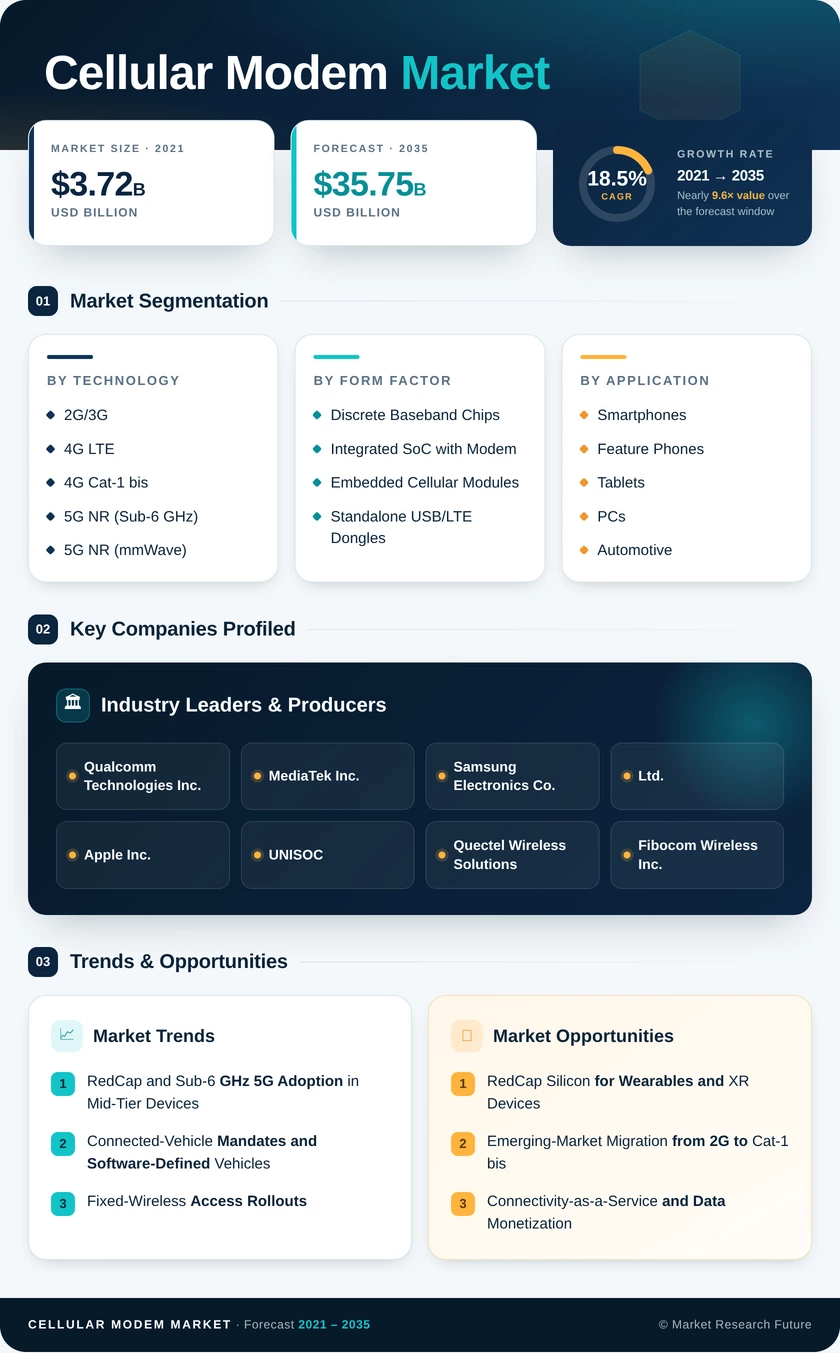
Cellular Modem Market Size, Share and Research Report By Technology (2G/3G, 4G LTE, 4G Cat-1 bis, 5G NR (Sub-6 GHz), 5G NR (mmWave), NB-IoT / LTE-M), By Form Factor (Discrete Baseband Chips, Integrated SoC with Modem, Embedded Cellular Modules, Standalone USB/LTE Dongles), By Application (Smartphones and Feature Phones, Tablets and PCs, Automotive and Connected Vehicles, Industrial Routers and Gateways, IoT Sensors and Meters, Wearables and XR Devices, CPE / Fixed-Wireless Access) and By Regional (North America, Europe, South America, Asia Pacific, Middle East and Africa) - Industry Forecast to 2035.
Cellular Modem Market
Market Size
Forecast Period2026-2035
CAGR (2026-2035)18.5%
2025 Market SizeUSD 6.58 Billion
2035 Market SizeUSD 35.75 Billion
Key Players
Qualcomm Technologies Inc.
MediaTek Inc.
Samsung Electronics Co., Ltd.
Apple Inc.
UNISOC
Quectel Wireless Solutions
Opportunities
  • RedCap Silicon for Wearables and XR Devices
  • Emerging-Market Migration from 2G to Cat-1 bis
  • Connectivity-as-a-Service and Data Monetization
  1. 1 Market Summary | |
  2. 2 Key Report Takeaways | |
    1. 2.1 By Technology | |
    2. 2.2 By Form Factor | |
    3. 2.3 By Application | |
    4. 2.4 By Region | |
  3. 3 Market Size and Forecast (2021–2035) | |
    1. 3.1 Historical Market Size (2021–2024) | |
    2. 3.2 Base Year Market Size (2025) | |
    3. 3.3 Forecast Market Size (2026–2035) | |
    4. 3.4 Year-over-Year Growth Analysis | |
  4. 4 Driver Impact Analysis | |
    1. 4.1 RedCap and Sub-6 GHz 5G Adoption in Mid-Tier Devices | |
    2. 4.2 Connected-Vehicle Mandates and Software-Defined Vehicles | |
    3. 4.3 Fixed-Wireless Access Rollouts | |
    4. 4.4 Massive IoT in Utilities and Metering | |
    5. 4.5 2G/3G Network Sunsets | |
    6. 4.6 Public Connectivity Funding and Localization | |
    7. 4.7 Non-Terrestrial Network Integration | |
  5. 5 Restraints Impact Analysis | |
    1. 5.1 Lengthening Smartphone Replacement Cycles | |
    2. 5.2 OEM Vertical Integration of Modems | |
    3. 5.3 Geopolitical Restrictions on Connected Hardware | |
    4. 5.4 Module Average Selling Price Erosion | |
    5. 5.5 Cybersecurity Compliance and Certification Costs | |
  6. 6 Opportunities | |
    1. 6.1 RedCap Silicon for Wearables and XR Devices | |
    2. 6.2 Emerging-Market Migration from 2G to Cat-1 bis | |
    3. 6.3 Connectivity-as-a-Service and Data Monetization | |
    4. 6.4 Hybrid Terrestrial–Satellite Modems | |
    5. 6.5 Replacement Demand from Network Sunsets | |
  7. 7 Regional Market Share and Country-Level Analysis | |
    1. 7.1 North America | | |
      1. 7.1.1 United States | | |
      2. 7.1.2 Canada | | |
      3. 7.1.3 Mexico | |
    2. 7.2 South America | | |
      1. 7.2.1 Brazil | | |
      2. 7.2.2 Argentina | | |
      3. 7.2.3 Rest of South America | |
    3. 7.3 Europe | | |
      1. 7.3.1 Germany | | |
      2. 7.3.2 United Kingdom | | |
      3. 7.3.3 France | | |
      4. 7.3.4 Italy | | |
      5. 7.3.5 Spain | | |
      6. 7.3.6 Rest of Europe | |
    4. 7.4 Asia-Pacific | | |
      1. 7.4.1 China | | |
      2. 7.4.2 Japan | | |
      3. 7.4.3 South Korea | | |
      4. 7.4.4 India | | |
      5. 7.4.5 Rest of Asia-Pacific | |
    5. 7.5 Middle East and Africa | | |
      1. 7.5.1 Saudi Arabia | | |
      2. 7.5.2 United Arab Emirates | | |
      3. 7.5.3 Rest of Middle East | | |
      4. 7.5.4 South Africa | | |
      5. 7.5.5 Egypt | | |
      6. 7.5.6 Rest of Africa | |
  8. 8 Future Outlook (2026–2035) | |
    1. 8.1 AI-Native Modems and 5G-Advanced | |
    2. 8.2 Platform Economics and eSIM | |
    3. 8.3 Vehicle Electrification Supercycle | |
    4. 8.4 Sustainability and Lifecycle Compliance | |
  9. 9 Segmentation Analysis | |
    1. 9.1 By Technology | | |
      1. 9.1.1 2G/3G | | |
      2. 9.1.2 4G LTE | | |
      3. 9.1.3 4G Cat-1 bis | | |
      4. 9.1.4 5G NR (Sub-6 GHz) | | |
      5. 9.1.5 5G NR (mmWave) | | |
      6. 9.1.1 NB-IoT / LTE-M | |
    2. 9.2 By Form Factor | | |
      1. 9.2.1 Discrete Baseband Chips | | |
      2. 9.2.2 Integrated SoC with Modem | | |
      3. 9.2.3 Embedded Cellular Modules | | |
      4. 9.2.4 Standalone USB/LTE Dongles | |
    3. 9.3 By Application | | |
      1. 9.3.1 Smartphones and Feature Phones | | |
      2. 9.3.2 Tablets and PCs | | |
      3. 9.3.3 Automotive and Connected Vehicles | | |
      4. 9.3.4 Industrial Routers and Gateways | | |
      5. 9.3.5 IoT Sensors and Meters | | |
      6. 9.3.6 Wearables and XR Devices | | |
      7. 9.3.7 CPE / Fixed-Wireless Access | |
  10. 10 Competitive Landscape | |
    1. 10.1 Market Concentration Analysis | |
    2. 10.2 Competitive Benchmarking Matrix | |
    3. 10.3 Company Profiles | | |
      1. 10.3.1 Qualcomm Technologies Inc. | | |
      2. 10.3.2 MediaTek Inc. | | |
      3. 10.3.3 Samsung Electronics Co., Ltd. | | |
      4. 10.3.4 Apple Inc. | | |
      5. 10.3.5 UNISOC | | |
      6. 10.3.6 Quectel Wireless Solutions | | |
      7. 10.3.7 Fibocom Wireless Inc. | | |
      8. 10.3.8 Telit Cinterion | | |
      9. 10.3.9 Semtech (Sierra Wireless) | | |
      10. 10.3.10 Nordic Semiconductor | | |
      11. 10.3.11 u-blox | |
  11. 11 Recent News & Developments | |
  12. 12 Report Scope and Methodology | |
  13. 13 Detailed Sources and Citations | |
  14. 14 Frequently Asked Questions (FAQs) | | LIST OF TABLES | |
  15. TABLE 1 Global Market Summary, 2025–2035 | |
  16. TABLE 2 Global Market Size & Forecast, by Revenue (USD billion), 2021–2035 | |
  17. TABLE 3 Driver Impact Analysis, 2026–2035 | |
  18. TABLE 4 Restraints Impact Analysis, 2026–2035 | |
  19. TABLE 5 Regional Summary, 2025 | |
  20. TABLE 6 North America Market, by Country, 2025 | |
  21. TABLE 7 South America Market, by Country, 2025 | |
  22. TABLE 8 Europe Market, by Country, 2025 | |
  23. TABLE 9 Asia-Pacific Market, by Country, 2025 | |
  24. TABLE 10 Middle East and Africa Market, by Country, 2025 | |
  25. TABLE 11 Global Market, by Technology, 2025 | |
  26. TABLE 12 Global Market, by Form Factor, 2025 | |
  27. TABLE 13 Global Market, by Application, 2025 | |
  28. TABLE 14 Competitive Benchmarking Matrix, 2025 | |
  29. TABLE 15 Report Scope and Methodology | |
  30. TABLE 16 Detailed Sources and Citations | |
  31. TABLE 17 Segmentation Quick Reference | |
  32. TABLE 18 Technology Sub-Segment Trends | |
  33. TABLE 19 Form Factor Sub-Segment Trends | |
  34. TABLE 20 Application Sub-Segment Trends | | LIST OF FIGURES | |
  35. FIGURE 1 Market Dynamics Overview — Drivers, Restraints and Opportunities | |
  36. FIGURE 2 Industry Value Chain Analysis | |
  37. FIGURE 3 Porter's Five Forces Analysis | |
  38. FIGURE 4 Global Market Size Trend (USD billion), 2021–2035 | |
  39. FIGURE 5 Year-over-Year Growth Rate, 2021–2035 | |
  40. FIGURE 6 Market Share by Technology, 2025 | |
  41. FIGURE 7 Market Share by Form Factor, 2025 | |
  42. FIGURE 8 Market Share by Application, 2025 | |
  43. FIGURE 9 Regional Market Share, 2025 | |
  44. FIGURE 10 Regional CAGR Comparison, 2026–2035 | |
  45. FIGURE 11 Competitive Landscape — Estimated Revenue Share Ranges, 2025 | |
  46. FIGURE 12 Market Concentration Matrix

Segmentation Quick Reference

DimensionSub-SegmentsDominant SegmentFastest Growing Segment
By Technology2G/3G; 4G LTE; 4G Cat-1 bis; 5G NR (Sub-6 GHz); 5G NR (mmWave); NB-IoT / LTE-M4G LTE — 49.3% (share)5G NR (Sub-6 GHz) — 19.4% (CAGR)
By Form FactorDiscrete Baseband Chips; Integrated SoC with Modem; Embedded Cellular Modules; Standalone USB/LTE DonglesIntegrated SoC with Modem — 47.4% (share)Embedded Cellular Modules — 20.2% (CAGR)
By ApplicationSmartphones and Feature Phones; Tablets and PCs; Automotive and Connected Vehicles; Industrial Routers and Gateways; IoT Sensors and Meters; Wearables and XR Devices; CPE / Fixed-Wireless AccessSmartphones and Feature Phones — 59.6% (share)Automotive and Connected Vehicles — 20.0% (CAGR)
By RegionNorth America; South America; Europe; Asia-Pacific; Middle East and AfricaAsia-Pacific — 45.8% (share)North America — 20.1% (CAGR)


Market Segmentation Overview

By Technology

Sub-SegmentKey Trend
2G/3GShrinking as operators complete network sunsets
4G LTEMature volume base with moderating growth
4G Cat-1 bisSingle-antenna replacement for legacy IoT radios
5G NR (Sub-6 GHz)RedCap extends 5G into mid-tier and low-power devices
5G NR (mmWave)Confined to dense venues and premium FWA
NB-IoT / LTE-MDeep-indoor coverage for meters and trackers


4G LTE leads with a 49.3% share because its cost and network ubiquity still suit most handsets and industrial endpoints. 5G NR (Sub-6 GHz) grows fastest at a 19.4% CAGR, as Release 17 RedCap brings 5G to devices that cannot carry the power or cost of flagship modems. NB-IoT / LTE-M and 4G Cat-1 bis absorb demand released by 2G/3G retirements, while 5G NR (mmWave) remains a propagation-limited niche.

By Form Factor

Sub-SegmentKey Trend
Discrete Baseband ChipsSustained by flagship and in-house OEM modem programs
Integrated SoC with ModemSingle-die designs cut cost, space and power.
Embedded Cellular ModulesPre-certified modules shorten industrial design cycles.
Standalone USB/LTE DonglesDeclining as connectivity becomes native


Integrated SoC with Modem holds a 47.4% share because smartphone makers prize the board-space and power savings of placing the baseband on the application processor die. Embedded Cellular Modules grow fastest at a 20.2% CAGR, since automotive and industrial OEMs buy carrier-certified modules rather than building RF expertise in-house. Discrete Baseband Chips survive where OEMs such as Apple want full control of the modem, while Standalone USB/LTE Dongles fade.

By Application

Sub-SegmentKey Trend
Smartphones and Feature PhonesLargest pool, pressured by longer upgrade cycles
Tablets and PCsAlways-connected laptops support steady attach rates.
Automotive and Connected VehiclesMandates and software-defined vehicles raise content.
Industrial Routers and GatewaysRedundant cellular WAN for factories and ports
IoT Sensors and MetersUtility digitization and asset tracking
Wearables and XR DevicesRedCap enables standalone connectivity.
CPE / Fixed-Wireless AccessOperator broadband bundles lift gateway demand.


Smartphones and Feature Phones dominate with a 59.6% share, but lengthening upgrade cycles cap their growth. Automotive and Connected Vehicles expand fastest at a 20.0% CAGR, since eCall compliance, over-the-air updates and V2X make a modem standard in every new vehicle. CPE / Fixed-Wireless Access and Wearables and XR Devices add diversification. Embedded connectivity solutions in IoT Sensors and Meters extend demand into utilities and logistics.




Download PDF ×

We do not share your information with anyone. However, we may send you emails based on your report interest from time to time. You may contact us at any time to opt-out.