Captive Power Generation Market Segmentation
Captive Power Generation Market By Captive Power Generation Market (USD Billion, 2025-2035)
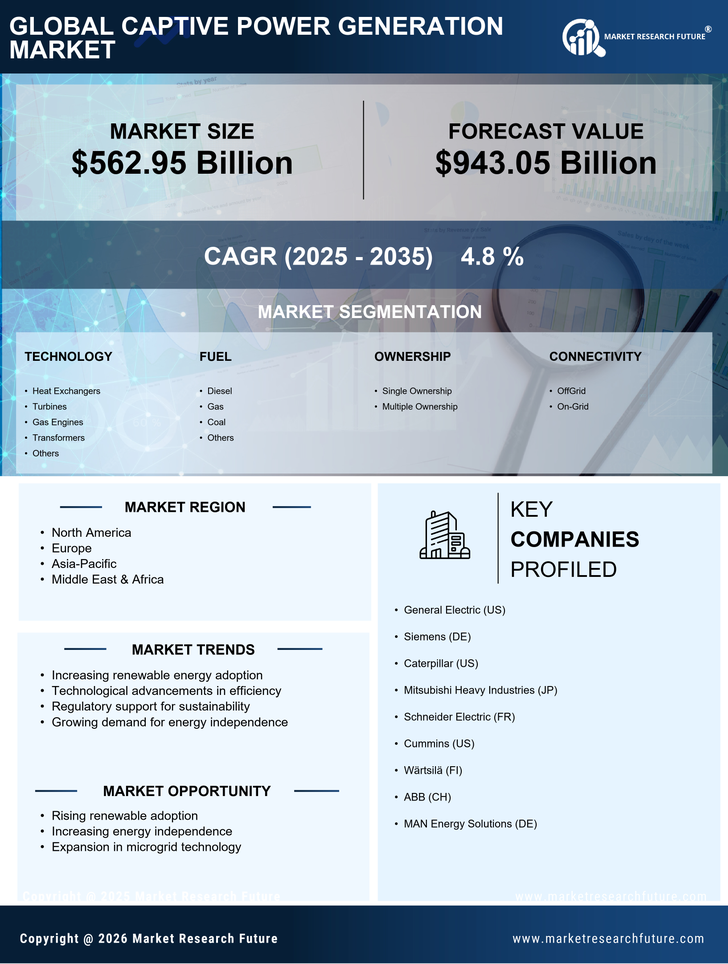
- Heat Exchangers
- Turbines
- Gas Engines
- Transformers
- Others
Captive Power Generation Market By Fuel (USD Billion, 2025-2035)
- Diesel
- Gas
- Coal
- Others
Captive Power Generation Market By Ownership (USD Billion, 2025-2035)
- Single Ownership
- Multiple Ownership
Captive Power Generation Market By Connectivity (USD Billion, 2025-2035)
- OffGrid
- On-Grid
Captive Power Generation Market By End Use (USD Billion, 2025-2035)
- Industrial
- Commercial
- Residential