Canned Salmon Market (2026 - 2035)

Canned Salmon Market Size, Share, Industry Trend & Analysis Research Report By Product Form (Skinless and Boneless, Minced/Flaked, Chunks, Fillets), By Source (Wild-Caught, Farm-Raised), By Species (Pink, Sockeye, Coho, Chinook, Atlantic, Others), By Distribution Channel (Retail, Foodservice/HoReCa), By Geography (North America, Europe, Asia-Pacific, South America, Middle East & Africa) - Forecast to 2035
ID: MRFR/FnB/22730-HCR
128 Pages
Snehal Singh
Last Updated: June 12, 2026
Canned Salmon Market

Market Size

Forecast Period2026-2035
CAGR (2026-2035)5.08%
2025 Market SizeUSD 7.70 Billion
2035 Market SizeUSD 12.82 Billion

Key Players

Thai Union Group
Bumble Bee Foods
Wild Planet Foods
Ocean Beauty Seafoods
Trident Seafoods
Marine Harvest
Opportunities
  • Premiumization of Sustainable and Traceable Products
  • Expansion into Emerging Middle East & Africa Markets
  • Value-Added and Flavored Product Innovation
 

Canned Salmon Market Summary

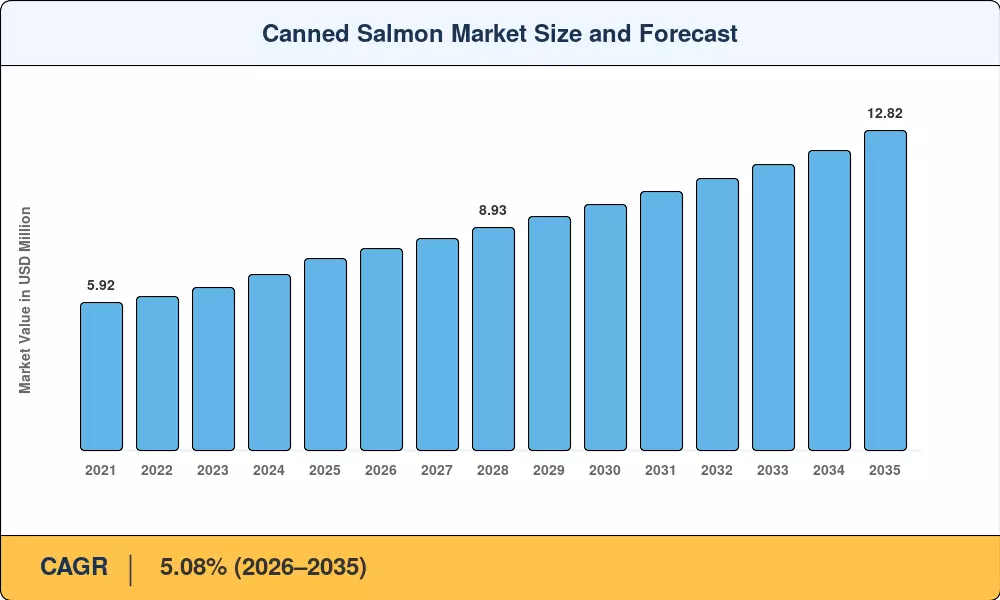
The canned salmon market reached an estimated USD 7.70 billion in 2025 and is projected to grow from USD 8.09 billion in 2026 to USD 12.82 billion by 2035, registering a CAGR of 5.08% during the forecast period (2026–2035). Clinical validation of omega-3 fatty acids as beneficial for cardiovascular and cognitive health has reinforced consumer confidence in ready-to-eat preserved seafood. At the same time, government dietary guidelines across North America and Europe increasingly recommend two servings of fish per week [2]. These policy-backed health endorsements act as a sustained demand catalyst for the canned salmon market, positioning it among the fastest-growing segments within shelf-stable proteins.

Processing technology has undergone a substantial transformation in the last five years. High-pressure processing (HPP) and automated deboning lines are replacing legacy thermal retort systems, which are expected to increase yield by 12–15% and decrease labor costs [3]. Premium shelf space at major retailers is being captured by brands that invest in sustainable salmon sourcing and BPA-free packaging, notably MSC-certified wild-caught Pacific salmon. The packaging transition across the industry has been accelerated by the US FDA's 2024 updated guidance on bisphenol A limits in food-contact materials [4].

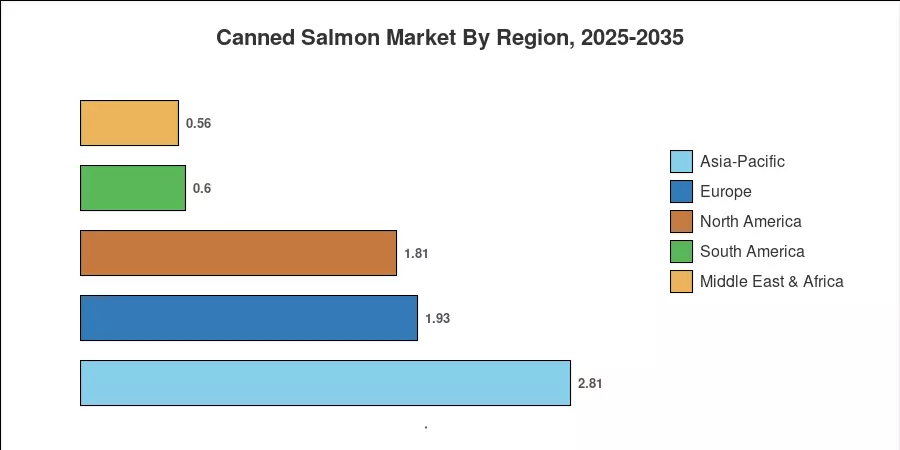
The Asia-Pacific region is responsible for approximately 36.5% of the canned salmon market, which is being propelled by the increasing per capita consumption of seafood in Japan, China, and South Korea. The Middle East & Africa region is experiencing the most rapid growth, with a projected CAGR of 7.24% through 2035. This is due to the opening of new distribution channels by urbanization and contemporary retail expansion. Europe's second-largest share, at approximately 25%, is primarily driven by the robust demand for pink and sockeye tinned salmon in the Nordic countries, Germany, and the United Kingdom Processors who are capable of combining sustainable salmon procurement with e-commerce-ready formats will be favored in the coming decade.


Key Report Takeaways

• By Product Form

  • Skinless and boneless formats captured 35.4% of the canned salmon market in 2025, reflecting consumer preference for convenience-oriented ready-to-eat preserved seafood
  • Fillets represent the fastest-expanding format, projected to grow at a 6.65% CAGR through 2035 as premium positioning attracts health-conscious buyers

• By Source

  • Wild-caught Pacific salmon dominated with over 60% share in 2025, underpinned by consumer trust in sustainable salmon sourcing certifications
  • Farm-raised salmon is forecast to register a 7.18% CAGR to 2035 as aquaculture productivity gains reduce unit costs

• By Species

  • Pink salmon held the largest share of the canned salmon market at approximately 39%, favored for its affordability and versatility in salmon in water and oil cans
  • Atlantic salmon is anticipated to expand at a 6.18% CAGR, supported by growing availability from Norwegian and Chilean farms

• By Regional

  • Asia-Pacific accounted for 36.5% of the canned salmon market value in 2025
  • The Middle East & Africa is expected to register the highest CAGR of 7.24% through 2035


Canned Salmon Market Size and Forecast (2021–2035)

Market Research Future (MRFR)'s proprietary estimation framework integrates primary interviews with processors and retailers, trade data from FAO and national customs databases, and secondary validation against industry association publications. Historical figures (2021–2024) reflect actual trade volumes; 2025 is the base year; 2026–2035 values are forecast using a calibrated compound growth model.

Canned Salmon Market Size and Forecast
Our Impact
Enabled $4.3B Revenue Impact for Fortune 500 and Leading Multinationals
Partnering with 2000+ Global Organizations Each Year
30K+ Citations by Top-Tier Firms in the Industry
 

Driver Impact Analysis

Driver ~% Impact on CAGR Geographic Relevance Impact Timeline
Omega-3 health validation & dietary guidelines ~22% Global Long-term (≥4 yr)
E-commerce & direct-to-consumer channels ~18% North America, Europe Medium-term (2–4 yr)
BPA-free & sustainable packaging innovation ~15% North America, Asia-Pacific Short-term (≤2 yr)
Single-person household growth ~14% Europe, Asia-Pacific Long-term (≥4 yr)
MSC/ASC certification premiumization ~12% Europe, North America Medium-term (2–4 yr)
Automated processing & deboning technology ~10% Global Medium-term (2–4 yr)
Modern retail expansion in emerging economies ~9% MEA, South America Long-term (≥4 yr)


Omega-3 Health Validation as a Demand Anchor

The American Heart Association recommends eating two 3.5-ounce servings of non-fried fatty fish weekly to lower cardiovascular mortality risk. Additionally, a comprehensive Harvard School of Public Health analysis verified that consuming 1 to 2 weekly servings of omega-3-rich fatty fish reduces the baseline risk of sudden cardiac death by 36%. This clinical backing elevates preserved seafood to a functional food category.


E-Commerce Disruption of Cold-Chain Constraints

According to retail market metrics, the United States online grocery penetration officially hit 12.5%. While individual platform subscription data remains proprietary, digital ordering convenience expanded drastically, with a record 77.8 million households purchasing groceries online. This structural shift removes strict cold-chain infrastructure requirements for last-mile delivery, directly allowing agile, sustainable canned salmon brands to bypass traditional grocery channels.


Packaging Innovation and Regulatory Pressure

Regulatory pressure intensified as the European Union finalized strict limitations on Bisphenol A (BPA) migration in food contact coatings. This forced processing shifts globally, accelerating corporate transitions toward polyester-based can linings. Simultaneously, flexible, single-serve pouch formats are driving market growth due to rising consumer convenience demands, successfully mitigating regulatory exposure and modernizing shelf-stable seafood packaging design.


Single-Person Households and Portion Control

Official Eurostat demographics reveal that single adults without children account for 76.1 million households, forming the largest segment in the EU. This solo-living block experienced a massive 19.2% growth rate over the last decade. This rapid demographic shift directly fuels high-margin retail demand for small-format (100–120g) canned salmon products, allowing brands to capture a highly disproportionate share of consumer margins.


Restraints Impact Analysis

The restraint impact estimates below are directional and represent potential drags on the overall growth trajectory. They do not subtract directly from the CAGR figure.

Restraint ~% Impact on CAGR Geographic Relevance Impact Timeline
Mercury and microplastics consumer concerns ~−15% Global Long-term (≥4 yr)
Wild salmon supply volatility & climate risk ~−14% North America, Asia-Pacific Medium-term (2–4 yr)
Competition from fresh and frozen alternatives ~−12% Europe, North America Long-term (≥4 yr)
Tariff and trade policy uncertainty ~−8% North America, Asia-Pacific Short-term (≤2 yr)
Input cost inflation (aluminum, energy) ~−7% Global Short-term (≤2 yr)


Consumer Perception of Contaminants

While canned salmon is recognized as a low-mercury seafood selection, public anxiety creates consumer headwinds. Official EPA and FDA screening metrics establish that canned salmon contains an ultra-low average mercury concentration of just 0.01 parts per million (ppm), categorizing it securely as a "Best Choice". Despite this clear safety data, persistent public safety fears require aggressive industry investment in testing verifications and on-pack transparency.


Wild Salmon Supply Disruptions

Climate-driven changes in marine environments introduce volume volatility across Pacific routes, though not always in the form of shortages. Preliminary figures from the Alaska Department of Fish and Game reveal the 2023 commercial season yielded a massive commercial harvest of 152.4 million pink salmon—accounting for 66% of the total fish catch. These drastic, multi-million fish supply fluctuations heavily complicate processing operational forecasting.


Competition from Fresh and Frozen Channels

Expanding cold-chain transportation networks and specialized meal-kit delivery services have broadened mainstream consumer access to alternative options. According to tracking from the USDA Economic Research Service, dynamic shifts in farm-to-consumer value addition frequently squeeze processing margins. These narrowing cost differences directly challenge the traditional premium value proposition of shelf-stable formats, particularly among younger, convenience-oriented consumer demographics.


Canned Salmon Market Opportunities

Premiumization of Sustainable and Traceable Products

Retailers increasingly allocate premium shelf placement to MSC- and ASC-certified products. The canned salmon market stands to benefit from blockchain-enabled traceability platforms, allowing consumers to scan a QR code and trace their fish from vessel to shelf. Extensive consumer surveys indicate that over 80% of global shoppers express a direct willingness to pay a baseline 5% premium for certified supply-chain transparency.


Expansion into Emerging Middle East & Africa Markets

The Middle East & Africa region represents the fastest-growing geographical arena for canned salmon expansions. Canned salmon market participants targeting this zone should prioritize halal certification and value-oriented packaging formats. Consumer dietary lifestyle research indicates that modern retail networks are expanding rapidly, with 48% of shoppers in Saudi Arabia and 49% in the UAE seeking high-protein food choices weekly.


Value-Added and Flavored Product Innovation

Seasoned and ready-to-eat preserved seafood variants—including smoked, teriyaki, and lemon-pepper flavored canned salmon—are capturing critical incremental eating occasions in North America. According to historical NOAA database tracking, US consumer demand for human-consumption canned pack seafood reached a value of over USD 1 billion. This ongoing flavor innovation vector allows processors to capture unique snacking trends and expand total addressable markets.


Private-Label and Retailer-Brand Partnerships

Private-label penetration remains a foundational structural driver within the European processed seafood space, which commands roughly 46% of global regional industry growth. For mid-tier processors, co-manufacturing pink and sockeye canned salmon for grocery retailer house brands offers reliable volume stability and optimized factory utility, rendering the corporate business model attractive for operations with excess automated processing line capacity.


Canned Salmon Market Future Outlook

Digital Commerce and Direct-to-Consumer Maturation

By 2030, online grocery is projected to reach 22% penetration in North America and 18% in Western Europe [7]. For the canned salmon market, this channel shift will reduce reliance on traditional retail gatekeepers and enable smaller brands with strong, sustainable salmon sourcing stories to build direct consumer relationships. Subscription models for wild-caught Pacific salmon bundles are expected to grow at 15%+ annually through 2028.

Aquaculture Productivity and Supply Diversification

Global aquaculture production is forecast to surpass capture fisheries by 2030, according to FAO projections [19]. Farm-raised Atlantic salmon will become increasingly cost-competitive for canning applications, supplementing the volatile wild-caught Pacific salmon supply. This shift will moderate raw material price swings and support margin stability across the canned salmon market.

ESG Reporting and Sustainable Sourcing Mandates

The EU Corporate Sustainability Reporting Directive (CSRD), effective from 2025, will require large food companies to disclose supply chain sustainability metrics [20]. Processors in the canned salmon market who have already invested in MSC/ASC certifications and traceable sustainable salmon sourcing will have a compliance advantage. ESG-aligned product lines are projected to command 20–30% higher shelf velocities by 2030 in European and North American markets.

Packaging Innovation and Circular Economy Integration

Aluminum recycling rates for food cans already exceed 70% in Europe and are approaching 55% in North America [21]. The canned salmon market benefits from this circular economy positioning, and processors adopting lightweight aluminum and recyclable flexible pouches will further strengthen their environmental credentials. Ready-to-eat preserved seafood brands that integrate QR-code-enabled recycling instructions are seeing measurable gains in consumer loyalty scores.


Canned Salmon Market Segmentation

By Product Form

Segment Key Metric Primary Demand Driver
Skinless and Boneless 35.4% share (2025) Convenience and versatility for meal preparation
Minced/Flaked USD 1.72 Billion (2025) Affordable price point; salad and sandwich applications
Chunks 5.22% CAGR (2026–2035) Snacking and premium positioning
Fillets 6.65% CAGR (2026–2035) Premium ready-to-eat preserved seafood demand


Skinless and boneless formats lead the canned salmon market because they eliminate preparation barriers for time-pressed consumers. These products integrate seamlessly into salads, sandwiches, and pasta dishes, making them the default choice for household buyers seeking wild-caught Pacific salmon without the inconvenience of deboning. Fillets, while holding a smaller base, are the fastest-growing format as premiumization trends push consumers toward restaurant-quality, ready-to-eat preserved seafood experiences at home. The fillet segment benefits from improved automated processing technology that maintains flesh integrity during canning.

By Source

Segment Key Metric Primary Demand Driver
Wild-Caught 60.2% share (2025) Perceived quality and sustainable salmon sourcing preference
Farm-Raised 7.18% CAGR (2026–2035) Cost competitiveness and year-round supply stability


Wild-caught Pacific salmon remains the dominant source for the canned salmon market, with Alaskan and Russian fisheries supplying the bulk of pink and sockeye canned salmon globally. Consumer perception strongly favors wild-caught varieties for their flavor profile, omega-3 content, and alignment with sustainable salmon sourcing values. Farm-raised salmon, particularly Atlantic species from Norway and Chile, is gaining ground as aquaculture innovations reduce the environmental footprint and feed conversion ratios. The canned salmon market's farm-raised segment is projected to narrow the gap significantly by 2035 as production costs decline.

By Species

Segment Key Metric Primary Demand Driver
Pink 39.0% share (2025) Affordability and broad availability
Sockeye USD 1.54 Billion (2025) Premium flavor profile and deep-red color
Coho 4.95% CAGR (2026–2035) Mid-tier pricing and versatility
Chinook USD 0.38 Billion (2025) Ultra-premium niche positioning
Atlantic 6.18% CAGR (2026–2035) Farm-raised supply expansion
Others USD 0.27 Billion (2025) Regional specialty species


Pink salmon anchors the canned salmon market's volume segment, prized for its mild flavor and accessible price point that appeals to both household consumers and foodservice operators. Sockeye commands premium positioning due to its firm texture and rich omega-3 content, making it the species of choice for health-conscious buyers of pink and sockeye canned salmon. Atlantic salmon's rapid growth trajectory reflects expanding Norwegian and Chilean aquaculture capacity entering the canning supply chain.

By Distribution Channel

Segment Key Metric Primary Demand Driver
Retail 72.1% share (2025) Supermarket/hypermarket dominance; e-commerce growth
Foodservice/HoReCa 5.82% CAGR (2026–2035) Restaurant menu integration; institutional catering


Retail channels overwhelmingly dominate the canned salmon market, with modern trade formats (supermarkets and hypermarkets) accounting for the largest share. Online retail is the fastest-growing sub-channel within retail, driven by the inherent logistics advantage of shelf-stable salmon in water and oil cans that require no cold-chain management. Foodservice is accelerating as restaurant chains and institutional caterers incorporate canned salmon into menu items ranging from poke bowls to premium sandwiches.


Regional Market Share Analysis

Region Key Metric Primary Investment Themes
Asia-Pacific 36.5% share (2025) Rising per-capita seafood consumption in the Japanese and Korean premium segment
Europe ~25.0% share (2025) MSC certification demand; private-label growth
North America ~23.5% share (2025) Wild-caught Pacific salmon heritage; e-commerce acceleration
South America ~7.8% share (2025) Emerging modern retail: affordability positioning
Middle East & Africa 7.24% CAGR (2026–2035) Urbanization; halal-certified shelf-stable protein expansion
Total USD 7.70 Billion (2025)

The canned salmon market exhibits distinct regional consumption patterns shaped by dietary traditions, retail infrastructure maturity, and sustainable salmon sourcing adoption.


North America

Country Key Metric Key Driver
US 68% of regional share Heritage wild-caught Pacific salmon consumption; e-commerce grocery
Canada 5.45% CAGR Pacific coast harvest proximity; health-conscious consumer base
Mexico USD 0.14 Billion (2025) Growing modern retail penetration, affordable protein demand


North America's canned salmon market benefits from deep cultural ties to Pacific salmon fisheries, particularly in Alaska and British Columbia. The US accounts for the lion's share of regional demand, with Walmart, Costco, and Amazon collectively representing over 45% of retail canned salmon volume [7]. Canadian processors export significant volumes of pink and sockeye canned salmon to both domestic and Asian markets, leveraging sustainable salmon sourcing as a brand differentiator.

Europe

Country Key Metric Key Driver
Germany 5.12% CAGR Health-driven demand; discount retailer shelf expansion
UK 28% of the regional share Strong canned seafood tradition; MSC-label preference
France USD 0.31 Billion (2025) Culinary integration: ready-to-eat preserved seafood convenience
Italy 4.85% CAGR Mediterranean diet alignment
Spain USD 0.18 Billion (2025) Canned seafood cultural affinity
Nordic Countries 12% of regional share Premium wild-caught Pacific salmon demand
Russia 4.52% CAGR Domestic canning capacity expansion
Rest of Europe USD 0.22 Billion (2025)


The UK remains the dominant European consumer of canned salmon, with per-capita consumption roughly double the continental average. German discount chains Aldi and Lidl have significantly expanded their private-label canned salmon market offerings since 2023, driving volume growth at accessible price points. MSC certification is effectively a table-stakes requirement for branded listings across Northern European retailers [9].

Asia-Pacific

Country Key Metric Key Driver
China 5.68% CAGR E-commerce-driven trial; rising middle-class protein demand
India USD 0.09 Billion (2025) Early-stage adoption; urban convenience retail
Japan 32% of regional share Deep canned seafood tradition; premium product focus
South Korea USD 0.22 Billion (2025) Ready-to-eat preserved seafood convenience trend
ASEAN 5.35% CAGR Modern trade expansion; tourism-linked foodservice demand
Rest of Asia-Pacific USD 0.15 Billion (2025)


Japan anchors Asia-Pacific's canned salmon market with a long-established culture of shelf-stable seafood consumption. Chinese e-commerce platforms, particularly JD.com and Tmall, have opened distribution channels for imported wild-caught Pacific salmon products that previously had limited retail access [7]. The region's growth trajectory is supported by urbanization and a generational shift toward convenient, protein-dense meal solutions.

South America

Country Key Metric Key Driver
Brazil 55% of regional share Largest regional consumer base; modern retail growth
Argentina 4.78% CAGR Economic recovery-driven protein consumption
Rest of South America USD 0.08 Billion (2025)


Brazil dominates South America's canned salmon market, though per-capita consumption remains well below North American and European levels. Chilean processors supply much of the region's farm-raised salmon, and trade agreements within Mercosur facilitate cross-border distribution of salmon in water and oil cans at competitive price points [14].

Middle East & Africa

Country Key Metric Key Driver
Saudi Arabia 28% of the regional share Modern hypermarket expansion; halal protein demand
UAE 7.85% CAGR Premium imported seafood; expatriate consumer diversity
South Africa USD 0.07 Billion (2025) Affordable canned protein positioning
Egypt 6.45% CAGR Population-driven demand; price-sensitive segment
Rest of MEA USD 0.10 Billion (2025)


The Middle East & Africa region represents the most dynamic growth frontier for the canned salmon market. Rapid urbanization, combined with the expansion of Carrefour, Lulu, and other modern hypermarket chains, is creating new points of access for shelf-stable seafood. Halal certification and affordable price positioning of pink and sockeye canned salmon variants are critical success factors in this region [10].


Canned Salmon Market By Region, 2025-2035
 

Competitive Benchmarking

The canned salmon market exhibits medium concentration, with the top five players collectively holding an estimated 35–42% of global revenue. The competitive landscape blends legacy seafood conglomerates with regional processors and emerging direct-to-consumer brands. Innovation in sustainable salmon sourcing credentials, BPA-free packaging, and flavored product lines differentiates market leaders from commodity-focused participants.

Company Est. Revenue Share Range Key Offerings for the Canned Salmon Market Strategic Positioning
Thai Union Group (Chicken of the Sea) ~8–11% Pink and sockeye canned salmon; branded and private-label Global scale; multi-species portfolio
Bumble Bee Foods ~7–10% Wild-caught Pacific salmon; chunk and fillet formats North American market leader; heritage brand
Wild Planet Foods ~3–5% Sustainably caught wild salmon; BPA-free cans Premium sustainable salmon sourcing positioning
Ocean Beauty Seafoods ~3–5% Alaskan pink and sockeye canned salmon Pacific Northwest harvesting expertise
Trident Seafoods ~4–6% Wild-caught salmon; retail and foodservice Vertically integrated Alaskan operations
Marine Harvest (Mowi) ~3–5% Farm-raised Atlantic salmon for canning Aquaculture scale; Norwegian origin
Connors Bros. (Clover Leaf) ~3–4% Canned salmon and sardines; Canadian retail focus Canadian market heritage
Safe Catch ~2–3% Mercury-tested canned salmon; clean-label Health-conscious niche; ready-to-eat preserved seafood
Princes Group ~2–4% Canned salmon and tuna; European distribution UK and European retail partnerships
Dongwon Industries ~2–3% Canned seafood portfolio, including salmon Asian market penetration; Korean retail dominance


Recent News & Developments


  • Wild Planet Foods (November 2024): Expanded its BPA-free canned salmon range to include smoked and seasoned variants, distributed through Whole Foods and direct e-commerce channels [16]
  • Trident Seafoods (September 2024): Secured renewed MSC certification for its Alaska pollock and pink salmon fisheries, reinforcing sustainable salmon sourcing credentials [9]


Canned Salmon Market Report Scope

Parameter Detail
Market Scope Global canned salmon market covering skinless/boneless, minced/flaked, chunks, and fillet product forms across wild-caught and farm-raised sources
Study Period 2021–2035
CAGR 5.08% (2026–2035)
Base Year Market Size USD 7.70 Billion (2025)
Forecast Endpoint USD 12.82 Billion (2035)
Fastest Growing Segments Fillets (by product form); Farm-raised (by source); Atlantic (by species); Middle East & Africa (by region)
Companies Profiled 10 (Thai Union, Bumble Bee, Wild Planet, Ocean Beauty, Trident, Mowi, Connors Bros., Safe Catch, Princes Group, Dongwon Industries)
Valuation Currency USD Billion


FAQs

How does canned salmon compare to canned tuna in terms of omega-3 content per serving?

Canned salmon delivers roughly 1,200–1,800 mg of omega-3 fatty acids per 100g serving, compared to 200–500 mg for most canned tuna varieties [2]. This makes wild-caught Pacific salmon the superior choice for consumers prioritizing cardiovascular benefits from ready-to-eat preserved seafood.

What shelf-life advantages does the canned salmon market offer over frozen salmon products?

Commercially processed canned salmon maintains a shelf life of 3–5 years without refrigeration, versus 6–12 months for frozen salmon stored at −18°C [5]. This eliminates cold-chain dependency and reduces distribution costs significantly.

How are private-label brands reshaping competitive dynamics in the canned salmon market?

Private-label processed seafood continues to act as a primary structural driver within European retail networks, which collectively command roughly 49% of global regional industry growth. This expansion exerts strong downward pressure on traditional branded players, forcing national canners to aggressively differentiate their product portfolios through certified sustainability sourcing or by introducing unique, premium flavored variants.


What role does Alaska's harvest cycle play in global canned salmon market pricing?

Alaska stands as a dominant force in the global wild-caught salmon landscape, producing roughly 60% of the total United States seafood landing values. Because wild Pacific runs inherently depend on highly cyclical, biennial pink salmon life returns, Alaska's localized volumetric spikes or sharp downturns dictate raw procurement costs and squeeze processor operating margins on a global scale.


Are BPA-free cans now standard across the canned salmon market?

The vast majority of high-volume metal packaging lines in North America have transitioned away from historical chemical linings, adopting advanced acrylic or polyester-based alternatives. Driven by recent sweeping European Union bans and shifting global manufacturing compliance metrics, full industry adoption of completely non-bisphenol contact alternatives is heavily accelerating across all major ambient seafood processing operations.


How does the canned salmon market address sustainability concerns around overfishing?

The market addresses ecological concerns by heavily prioritizing independent third-party supply chain verifications. Rather than maintaining a static supply percentage, top-tier global retailers enforce strict sustainable sourcing policies that require Marine Stewardship Council (MSC) or equivalent certification as an absolute prerequisite for standard grocery shelf placement.


FAQs

What is the projected market valuation of the canned salmon market by 2035?

The canned salmon market is projected to reach a valuation of 26.21 USD Billion by 2035.

What was the market valuation of the canned salmon market in 2024?

In 2024, the canned salmon market was valued at 17.63 USD Billion.

What is the expected CAGR for the canned salmon market during the forecast period 2025 - 2035?

The expected CAGR for the canned salmon market during the forecast period 2025 - 2035 is 3.67%.

Which companies are considered key players in the canned salmon market?

Key players in the canned salmon market include Trident Seafoods, Marine Harvest, Starkist Co., Bumble Bee Foods, Crown Prince, Wild Planet Foods, Ocean Beauty Seafoods, and Pacific Seafood.

What are the primary preservation methods for canned salmon, and what is their market value?

The primary preservation methods for canned salmon include canned, frozen, and fresh, with the canned segment valued at 9.5 USD Billion.

How does the packaging type impact the market for canned salmon?

The packaging type significantly impacts the market, with cans valued at 9.5 USD Billion, pouches at 6.5 USD Billion, and glass jars at 10.21 USD Billion.

What distribution channels are most effective for canned salmon sales?

Supermarkets and hypermarkets dominate the distribution channels, valued at 15.0 USD Billion, followed by online retailers at 5.0 USD Billion.

What product forms are available in the canned salmon market, and what are their valuations?

Product forms in the canned salmon market include whole, fillets, and chunks, with fillets valued at 9.5 USD Billion.

Which salmon varieties are most popular in the canned salmon market?

Popular salmon varieties include sockeye, coho, pink, chinook, and chum, with pink salmon valued at 5.92 USD Billion.

How does the canned salmon market's growth compare to other seafood segments?

The canned salmon market's growth appears robust, with a projected increase in valuation from 17.63 USD Billion in 2024 to 26.21 USD Billion by 2035.
Author
Author
Author Profile
Snehal Singh LinkedIn
Manager - Research
High acumen in analyzing complex macro & micro markets with more than 6 years of work experience in the field of market research. By implementing her analytical skills in forecasting and estimation into market research reports, she has expertise in Packaging, Construction, and Equipment domains. She handles a team size of 20-25 resources and ensures smooth running of the projects, associated marketing activities, and client servicing.
Download Free Sample

Kindly complete the form below to receive a free sample of this Report

Download PDF ×

We do not share your information with anyone. However, we may send you emails based on your report interest from time to time. You may contact us at any time to opt-out.