SEGMENTATION QUICK REFERENCE
| Dimension | Sub-Segments | Dominant Segment | Fastest Growing Segment |
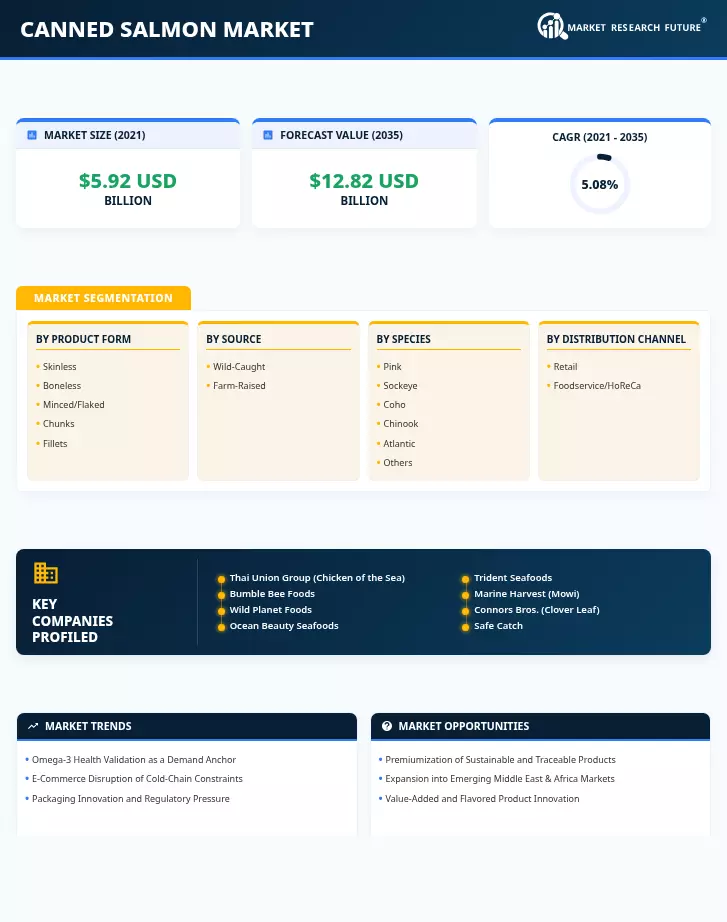
| Product Form | Skinless and Boneless, Minced/Flaked, Chunks, Fillets | Skinless and Boneless | Fillets |
| Source | Wild-Caught, Farm-Raised | Wild-Caught | Farm-Raised |
| Species | Pink, Sockeye, Coho, Chinook, Atlantic, Others | Pink | Atlantic |
| Distribution Channel | Retail, Foodservice/HoReCa | Retail | Foodservice/HoReCa |
| Geography | North America, Europe, Asia-Pacific, South America, Middle East & Africa | Asia-Pacific | Middle East & Africa |
MARKET SEGMENTATION OVERVIEW
By Product Form
| Sub-Segment | Key Trend |
| Skinless and Boneless | Dominant convenience format; strong household and foodservice crossover demand |
| Minced/Flaked | Budget-friendly option for salads, casseroles, and institutional catering applications |
| Chunks | Growing premium snacking and recipe-ready positioning in retail |
| Fillets | Fastest growth driven by premiumization and ready-to-eat meal applications |
The product form landscape reflects a clear bifurcation between value-driven formats (minced/flaked) and premium-oriented formats (fillets). Skinless and boneless products remain the volume leader due to their broad applicability across meal occasions, while fillets capture the emerging consumer preference for restaurant-quality home dining experiences.
By Source
| Sub-Segment | Key Trend |
| Wild-Caught | Consumer preference for natural, MSC-certified Pacific salmon remains strong. |
| Farm-Raised | Aquaculture expansion from Norway and Chile is driving cost-competitive supply growth. |
Wild-caught salmon maintains its leadership position on the strength of consumer perception and sustainability certification. Farm-raised sources are closing the gap as feed efficiency improvements and responsible aquaculture practices address earlier environmental criticism.
By Species
| Sub-Segment | Key Trend |
| Pink | Largest volume species; affordable and widely available from Alaskan and Russian fisheries |
| Sockeye | Premium tier; valued for deep-red color, firm texture, and high omega-3 content |
| Coho | Mid-range positioning bridging pink and sockeye price tiers |
| Chinook | Ultra-premium niche with limited supply and specialty retail distribution |
| Atlantic | Fastest growing species in canning applications due to aquaculture scale |
| Others | Regional specialty species, including chum and other Pacific varieties |
Species segmentation reflects consumer willingness to trade up within the canned salmon category. Pink salmon serves as the gateway product, while sockeye and Atlantic species capture consumers seeking differentiated flavor and nutritional profiles.
By Distribution Channel
| Sub-Segment | Key Trend |
| Retail | Supermarkets, hypermarkets, and e-commerce dominate volume sales |
| Foodservice/HoReCa | Restaurants and institutional buyers are increasingly integrating canned salmon into menus. |
Retail remains the primary channel, though the e-commerce sub-channel is reshaping competitive dynamics by enabling direct brand-to-consumer relationships. Foodservice growth is anchored in quick-service and casual dining chains that value the cost efficiency and consistent quality of canned salmon ingredients.