• Cat-intel
  • MedIntelliX
  • Resources
  • About Us
  • Request Free Sample

    ×

    Kindly complete the form below to receive a free sample of this Report

    Leading companies partner with us for data-driven Insights

    clients tt-cursor

    BPO Business Analytics Market

    ID: MRFR/ICT/9213-HCR
    99 Pages
    Ankit Gupta
    September 2025

    BPO Business Analytics Market Research Report Information by Component (Software and Services), Deployment (Cloud-Based and On-Premises), Organization Size (SMEs and Large Enterprises), Application (Finance & Accounting, Human Resources, Knowledge Process Outsourcing, Procurement & Supply Chain, Customer Services), Vertical (BFSI, IT and Telecommunication, Healthcare, Manufacturing, Ret...

    Share:

    Download PDF

    ×

    We do not share your information with anyone. However, we may send you emails based on your report interest from time to time. You may contact us at any time to opt-out.

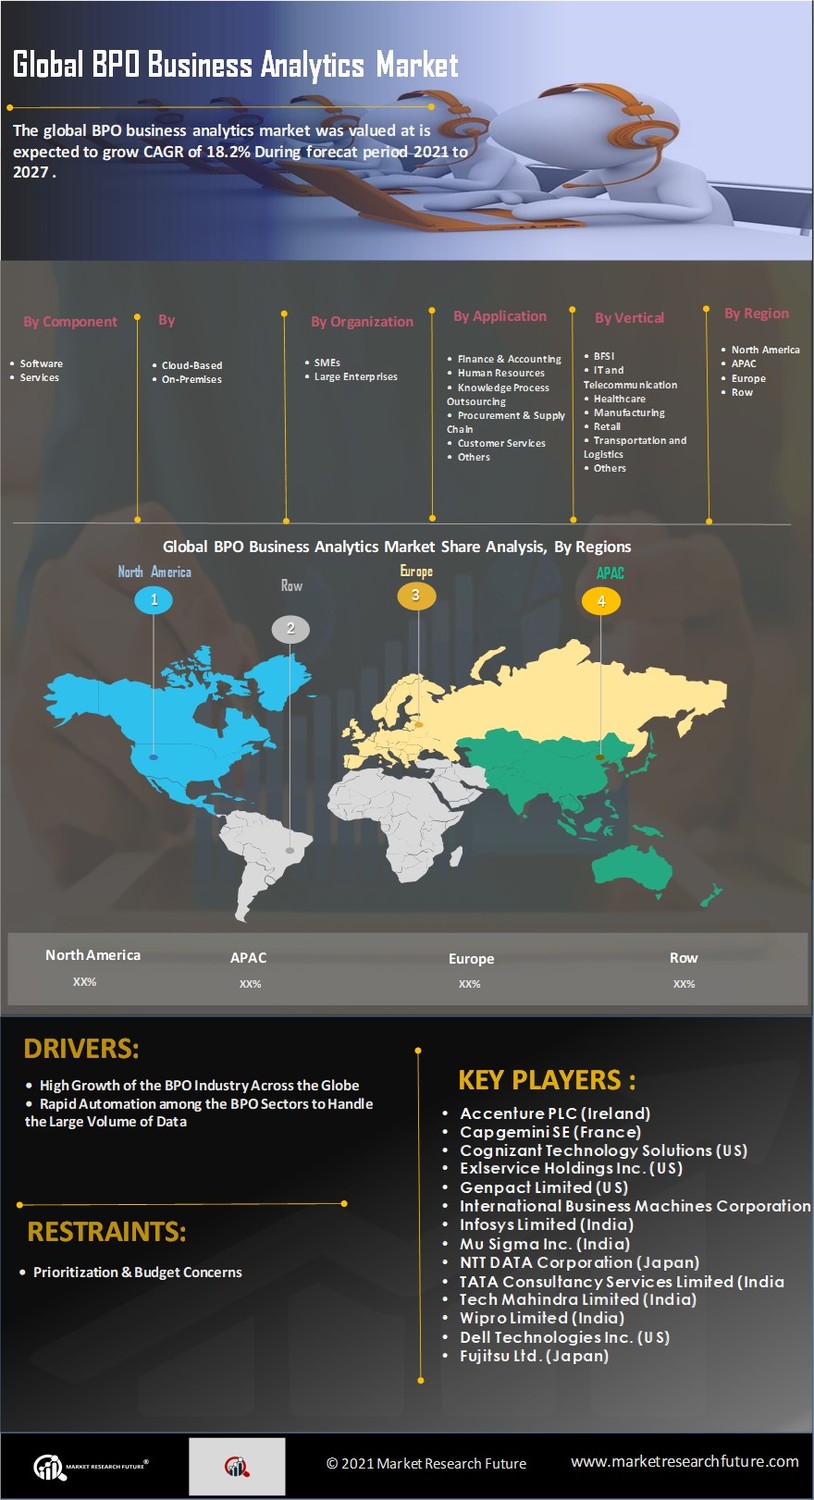
    BPO Business Analytics Market Research Report - Global Forecast till 2030 Infographic
    $ 4,950.0
    $ 5,950.0
    $ 7,250.0
    Table of Contents

    BPO Business Analytics Market Summary

    As per Market Research Future Analysis, the global BPO business analytics market is projected to grow to USD 6.5 Billion at a CAGR of 10.8% from 2022 to 2030. Business analytics, a subset of business intelligence, utilizes methodologies like predictive analytics and data mining to transform data into actionable insights, enhancing decision-making in BPO organizations. The increasing data volume from social media and mobile users necessitates advanced analytics for strategic planning and customer relationship management. The market is driven by the rapid growth of the BPO industry, automation needs, and the shift of outsourcing to emerging economies. However, budget constraints hinder adoption among smaller BPO firms. Opportunities lie in cloud-based deployments and the rising demand from SMEs, which are expected to bolster market growth significantly.

    Key Market Trends & Highlights

    Key trends shaping the BPO business analytics market include rapid automation and increasing cloud adoption.

    • BPO business analytics market expected to grow to USD 6.5 Billion by 2030.
    • CAGR of 10.8% projected from 2022 to 2030.
    • Emerging economies are becoming major outsourcing destinations, enhancing market opportunities.
    • Cloud-based deployments are anticipated to increase adoption rates among SMEs.

    Market Size & Forecast

    Market Size USD 6.5 Billion by 2030
    CAGR 10.8% from 2022 to 2030
    YOY Growth 15% to 21% expected annually
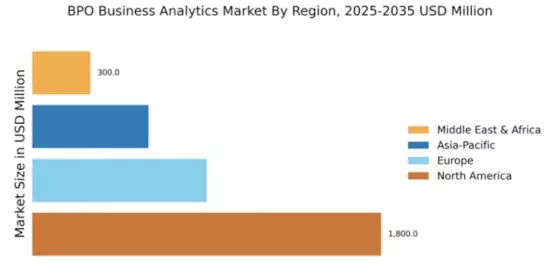
    Largest Regional Market North America

    Major Players

    Accenture PLC (Ireland), Capgemini SE (France), Cognizant Technology Solutions (US), Genpact Limited (US), International Business Machines Corporation (US), Exlservice Holdings Inc. (US), Tata Consultancy Services Limited (India)

    BPO Business Analytics Market Trends

    The increasing reliance on data-driven decision-making across various sectors is reshaping the landscape of the BPO Business Analytics Market, suggesting a robust growth trajectory fueled by technological advancements and evolving consumer expectations.

    U.S. Bureau of Labor Statistics

    BPO Business Analytics Market Drivers

    Market Growth Projections

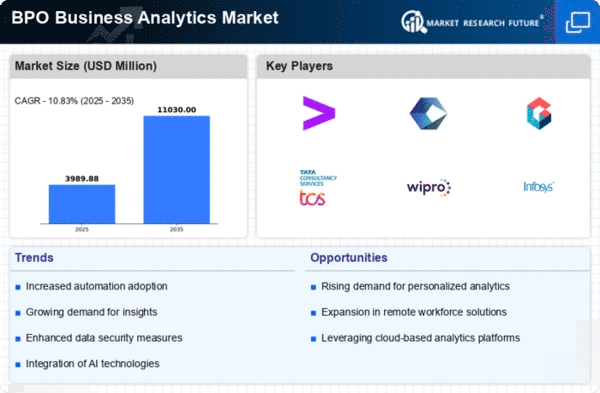
    The Global BPO Business Analytics Market Industry is projected to experience substantial growth in the coming years. With a market value expected to reach 3.63 USD Billion in 2024 and potentially 10.9 USD Billion by 2035, the industry is on a trajectory of significant expansion. The compound annual growth rate of 10.47% from 2025 to 2035 indicates a robust demand for analytics solutions across various sectors. This growth is driven by the increasing reliance on data analytics for informed decision-making, operational efficiency, and enhanced customer experiences. The market's upward trend suggests a promising future for businesses investing in analytics.

    Globalization and Market Expansion

    Globalization has a profound impact on the Global BPO Business Analytics Market Industry, as companies seek to expand their operations across borders. The need for analytics becomes increasingly critical in understanding diverse markets and consumer behaviors. Organizations are leveraging analytics to identify growth opportunities and optimize their strategies in various regions. This trend is likely to drive market growth, as businesses require insights to navigate complex global landscapes. The anticipated compound annual growth rate of 10.47% from 2025 to 2035 indicates a robust demand for analytics services in the context of globalization.

    Increased Focus on Customer Experience

    The Global BPO Business Analytics Market Industry is significantly influenced by the heightened focus on customer experience. Businesses are recognizing that understanding customer behavior and preferences is crucial for maintaining competitiveness. By utilizing analytics, organizations can tailor their services and products to meet customer needs more effectively. This shift is driving investments in analytics solutions that provide insights into customer interactions and satisfaction levels. As companies strive to enhance customer experiences, the demand for analytics services is expected to grow, contributing to the overall expansion of the market.

    Regulatory Compliance and Risk Management

    Regulatory compliance and risk management are vital drivers of the Global BPO Business Analytics Market Industry. As businesses face increasing scrutiny from regulatory bodies, the need for effective analytics solutions to ensure compliance is paramount. Organizations are utilizing analytics to monitor and manage risks associated with regulatory changes, thereby safeguarding their operations. This trend is likely to propel the demand for analytics services, as companies seek to mitigate risks and maintain compliance. The growing emphasis on risk management suggests a sustained need for analytics in various industries, further contributing to the market's expansion.

    Rising Demand for Data-Driven Decision Making

    The Global BPO Business Analytics Market Industry experiences a substantial increase in demand for data-driven decision-making processes. Organizations across various sectors are increasingly leveraging analytics to enhance operational efficiency and improve customer experiences. This trend is evidenced by the projected market value of 3.63 USD Billion in 2024, reflecting a growing recognition of the importance of data insights. Companies are investing in advanced analytics tools to gain competitive advantages, streamline operations, and make informed strategic decisions. As businesses continue to prioritize data analytics, the Global BPO Business Analytics Market Industry is poised for significant growth.

    Technological Advancements in Analytics Tools

    Technological advancements play a pivotal role in shaping the Global BPO Business Analytics Market Industry. The emergence of artificial intelligence, machine learning, and big data analytics has revolutionized how businesses analyze and interpret data. These innovations enable organizations to process vast amounts of information quickly and derive actionable insights. As a result, companies are increasingly adopting sophisticated analytics tools to enhance their decision-making capabilities. The continuous evolution of technology suggests that the market will expand, potentially reaching a value of 10.9 USD Billion by 2035. This growth underscores the importance of staying abreast of technological trends in the analytics domain.
    Market Segment Insights

    Regional Insights

    Key Companies in the BPO Business Analytics Market market include

    Industry Developments

    Future Outlook

    BPO Business Analytics Market Future Outlook

    The BPO Business Analytics Market is projected to grow at a 10.47% CAGR from 2024 to 2035, driven by technological advancements, increased data utilization, and demand for cost-effective solutions.

    New opportunities lie in:

    • Leverage AI-driven analytics to enhance decision-making processes for clients.
    • Develop tailored analytics solutions for niche industries to capture underserved markets.
    • Implement cloud-based platforms to improve scalability and accessibility of analytics services.

    By 2035, the BPO Business Analytics Market is expected to be robust, reflecting substantial growth and innovation.

    Market Segmentation

    Report Scope

    Report Attribute/Metric Details
      Market Size   USD 6.5 Billion
      CAGR   10.8%
      Base Year   2021
      Forecast Period   2022-2030
      Historical Data   2020
      Forecast Units   Value (USD Million)
      Report Coverage   
      Segments Covered   • By Component (Software andServices) • By Deployment (Cloud-Based andOn-Premises) • By Organization Size (SMEs andLarge Enterprises • By Application (Finance & Accounting, Human Resources, Knowledge Process Outsourcing, Procurement & Supply Chain, Customer Services, and Others) • ByVertical (BFSI, IT & Telecommunication, Healthcare, Manufacturing, Retail, Transportation & Logistics, and Others)
      Geographies Covered   • North America (US, Canada, and Mexico) • Europe (UK, Germany, France, and Rest of Europe) • Asia-Pacific (China, Japan, India, and Rest of Asia-Pacific) • Middle East & Africa • South America
      Key Vendors   • HiHello, Inc. (US) • Haystack (Australia) • Inigo (US) • L-Card (US) • Switchit (US) • Adobe (US) • Techno Infonet (India) • About.me (US) • SnapDat (US) • CamCard (US) • Mobilo (US) • DziCard.com (Quancore Group) (India) • Knowee (Spain) • Lulu Systems, Inc. (US) • Vistinkard (India)
      Key Market Opportunities   
      Key Market Drivers   • Drivers • High Growth of the BPO Industry Across the Globe • The Rapid Automation among the BPO Sectors to Handle the Large Volume of Data • Opportunities • Increasing Demand from SMEs • Emerging Economies are Expected to Open Lucrative Opportunities for the Market • Growing Cloud-Based Deployments • Challenges • Prioritization & Budget Concerns • Impact of COVID-19 • Impact on the BPO Sector • Impact on the End-Use Industry Verticals • Impact on IT Expenditure • Impact on Digitalization/Automation • Impact on Market Players

    Market Highlights

    Author

    Ankit Gupta
    Senior Research Analyst

    Ankit Gupta is an analyst in market research industry in ICT and SEMI industry. With post-graduation in "Telecom and Marketing Management" and graduation in "Electronics and Telecommunication" vertical he is well versed with recent development in ICT industry as a whole. Having worked on more than 150+ reports including consultation for fortune 500 companies such as Microsoft and Rio Tinto in identifying solutions with respect to business problems his opinions are inclined towards mixture of technical and managerial aspects.

    Leave a Comment

    FAQs

    What was the valuation of the global BPO business analytics market in 2030?

    The global BPO business analytics market was valued at USD 6.5 Billion in 2030

    What is the predicted growth rate of the global BPO business analytics market by 2030?

    The global BPO business analytics market is expected to exhibit an 10.8% CAGR rate by 2030.

    Which region currently dominates the market and can dominate the global BPO business analytics market in 2030?

    The North American region currently dominates the market and is expected to retain its dominance throughout the forecast period.

    Which application is lucrative in the global BPO business analytics market?

    Customer service is the most lucrative application in the global BPO business analytics market.

    Which vertical is the largest contributor to the global BPO business analytics market?

    BFSI, IT and telecommunication, manufacturing, and retail are the largest contributors to the global BPO business analytics market.

    Who are the key companies in the global BPO business analytics market?

    Accenture PLC (Ireland), Capgemini SE (France), Cognizant Technology Solutions (US), Exlservice Holdings Inc. (US), and International Business Machines Corporation (US)are the key companies of the global BPO business analytics market.

    1. 'TABLE OF CONTENTS
    2. EXECUTIVE SUMMARY
      1. Market Attractiveness
    3. Analysis
    4. Global BPO Business Analytics Market, by Component
      1. GlobalBPO Business Analytics Market, by Deployment
        1. Global BPO Business
    5. Analytics Market, byOrganization Size
      1. GlobalBPO Business Analytics Market, by Application
        1. Global BPO Business
    6. Analytics Market, by Vertical
      1. GlobalBPO Business Analytics Market, by Region
    7. MARKET INTRODUCTION
      1. Definition
      2. Scope of the Study
      3. Market Structure
    8. RESEARCH METHODOLOGY
      1. Research Process
      2. Primary Research
      3. Secondary Research
      4. Market Size Estimation
      5. List of Assumptions
    9. MARKET DYNAMICS
      1. Introduction
      2. Drivers
        1. High Growth of
    10. the BPO Industry Across the Globe
      1. Rapid Automation Among the BPO Sectors to Handle the Large Volume
    11. of Data
    12. Drivers Impact Analysis
      1. Restraints
        1. Prioritization & Budget Concerns
        2. Restraints Impact Analysis
      2. Opportunities
        1. Increasing Demand
    13. from SMEs
    14. Emerging Economies are Expected to Present Lucrative Opportunities
      1. Growing Cloud-based Deployments
      2. Impact of COVID-19
        1. Impact on the
    15. BPO Sector
    16. Impact on the End-Use Industry Verticals
      1. Impact on IT Expenditure
        1. Impact on Digitalization/Automation
        2. Impact on Market
    17. Players
    18. MARKET FACTOR ANALYSIS
    19. Value Chain Analysis/Supply Chain Analysis
      1. Porter’s Five Forces Model
        1. Bargaining Power of Suppliers
        2. Bargaining Power
    20. of Buyers
    21. Threat of New Entrants
    22. Threat of Substitutes
    23. Intensity of Rivalry
    24. GLOBAL BPO BUSINESS ANALYTICS MARKET, BY COMPONENT
      1. Introduction
      2. Software
      3. Services
    25. GLOBALBPO BUSINESS ANALYTICS MARKET, BY DEPLOYMENT
      1. Introduction
      2. Cloud-Based
      3. On-Premises
    26. GLOBALBPO BUSINESS
    27. ANALYTICS MARKET, BY ORGANIZATION SIZE
      1. Introduction
      2. SMEs
      3. Large Enterprises
    28. GLOBAL BPO BUSINESS ANALYTICS MARKET, BY APPLICATION
      1. Introduction
      2. Finance & Accounting
      3. Human Resources
      4. Knowledge Process
    29. Outsourcing
    30. Procurement & Supply Chain
      1. Customer Services
      2. Others
    31. GLOBAL BPO BUSINESS ANALYTICS MARKET, BY VERTICAL
      1. Introduction
      2. BFSI
      3. IT & Telecommunication
      4. Healthcare
      5. Manufacturing
      6. Retail
      7. Transportation
    32. & Logistics
    33. Others
    34. GLOBALBPO BUSINESS ANALYTICS MARKET, BY REGION
      1. Overview
      2. North America
        1. Market Size & Estimates, by Country,
    35. Market Size & Estimates, by Component, 2018–2027
      1. Market Size & Estimates, by Deployment,
    36. Market Size & Estimates, by Organization Size, 2018–2027
      1. Market Size & Estimates,
    37. by Application, 2018–2027
      1. Market Size & Estimates, by Vertical, 2018–2027
        1. US
    38. & Estimates, by Component, 2018–2027
      1. Market Size & Estimates, by Deployment,
    39. Market Size & Estimates, by Organization Size, 2018–2027
      1. Market Size & Estimates,
    40. by Application, 2018–2027
      1. Market Size & Estimates, by Vertical, 2018–2027
        1. Canada
    41. & Estimates, by Component, 2018–2027
      1. Market Size & Estimates, by Deployment,
    42. Market Size & Estimates, by Organization Size, 2018–2027
      1. Market Size & Estimates,
    43. by Application, 2018–2027
      1. Market Size & Estimates, by Vertical, 2018–2027
        1. Mexico
    44. & Estimates, by Component, 2018–2027
      1. Market Size & Estimates, by Deployment,
    45. Market Size & Estimates, by Organization Size, 2018–2027
      1. Market Size & Estimates,
    46. by Application, 2018–2027
      1. Market Size & Estimates, by Vertical, 2018–2027
      2. Europe
        1. Market Size &
    47. Estimates, by Country, 2018–2027
      1. Market Size & Estimates, by Component, 2018–2027
        1. Market Size &
    48. Estimates, by Deployment, 2018–2027
      1. Market Size & Estimates, by Organization
    49. Size, 2018–2027
    50. Market Size & Estimates, by Application, 2018–2027
      1. Market Size & Estimates, by Vertical,
    51. Germany
    52. Market Size & Estimates, by Component, 2018–2027
      1. Market Size & Estimates, by Deployment,
    53. Market Size & Estimates, by Organization Size, 2018–2027
      1. Market Size & Estimates,
    54. by Application, 2018–2027
      1. Market Size & Estimates, by Vertical, 2018–2027
        1. UK
    55. & Estimates, by Component, 2018–2027
      1. Market Size & Estimates, by Deployment,
    56. Market Size & Estimates, by Organization Size, 2018–2027
      1. Market Size & Estimates,
    57. by Application, 2018–2027
      1. Market Size & Estimates, by Vertical, 2018–2027
        1. France
    58. & Estimates, by Component, 2018–2027
      1. Market Size & Estimates, by Deployment,
    59. Market Size & Estimates, by Organization Size, 2018–2027
      1. Market Size & Estimates,
    60. by Application, 2018–2027
      1. Market Size & Estimates, by Vertical, 2018–2027
        1. Rest of Europe
    61. & Estimates, by Component, 2018–2027
      1. Market Size & Estimates, by Deployment,
    62. Market Size & Estimates, by Organization Size, 2018–2027
      1. Market Size &
    63. Estimates, by Application, 2018–2027
      1. Market Size & Estimates, by Vertical,
    64. Asia-Pacific
    65. Market Size & Estimates, by Country, 2018–2027
      1. Market Size & Estimates, by Component,
    66. Market Size & Estimates, by Deployment, 2018–2027
      1. Market Size & Estimates, by Organization
    67. Size, 2018–2027
    68. Market Size & Estimates, by Application, 2018–2027
      1. Market Size & Estimates, by Vertical,
    69. China
    70. Market Size & Estimates, by Component, 2018–2027
      1. Market Size & Estimates, by Deployment,
    71. Market Size & Estimates, by Organization Size, 2018–2027
      1. Market Size & Estimates,
    72. by Application, 2018–2027
      1. Market Size & Estimates, by Vertical, 2018–2027
        1. Japan
    73. & Estimates, by Component, 2018–2027
      1. Market Size & Estimates, by Deployment,
    74. Market Size & Estimates, by Organization Size, 2018–2027
      1. Market Size & Estimates,
    75. by Application, 2018–2027
      1. Market Size & Estimates, by Vertical, 2018–2027
        1. India
    76. & Estimates, by Component, 2018–2027
      1. Market Size & Estimates, by Deployment,
    77. Market Size & Estimates, by Organization Size, 2018–2027
      1. Market Size & Estimates,
    78. by Application, 2018–2027
      1. Market Size & Estimates, by Vertical, 2018–2027
        1. Rest of Asia-Pacific
    79. & Estimates, by Component, 2018–2027
      1. Market Size & Estimates, by Deployment,
    80. Market Size & Estimates, by Organization Size, 2018–2027
      1. Market Size &
    81. Estimates, by Application, 2018–2027
      1. Market Size & Estimates, by Vertical,
    82. Middle East & Africa
      1. Market Size & Estimates, by Component, 2018–2027
        1. Market Size &
    83. Estimates, by Deployment, 2018–2027
      1. Market Size & Estimates, by Organization
    84. Size, 2018–2027
    85. Market Size & Estimates, by Application, 2018–2027
      1. Market Size & Estimates, by Vertical,
    86. South America
    87. Market Size & Estimates, by Component, 2018–2027
      1. Market Size & Estimates, by Deployment,
    88. Market Size & Estimates, by Organization Size, 2018–2027
      1. Market Size & Estimates,
    89. by Application, 2018–2027
      1. Market Size & Estimates, by Vertical, 2018–2027
    90. COMPETITIVE LANDSCAPE
      1. Introduction
      2. KeyPlayersMarket
    91. Share Analysis, 2020 (%)
      1. Competitive Benchmarking
      2. Competitor Dashboard
      3. Major Growth Strategy in the Market
      4. Key Developments
    92. & Growth Strategies
      1. Product Developments
        1. Mergers & Acquisitions
        2. Contracts & Agreements
    93. COMPANY PROFILES
      1. Accenture PLC (Ireland)
        1. Company Overview
        2. Financial Overview
        3. Software/Solutions
    94. Offered
    95. Key Developments
    96. SWOT Analysis
    97. Key Strategies
    98. Capgemini SE (France)
    99. Company Overview
    100. Financial Overview
    101. Software/Solutions Offered
      1. Key Developments
        1. SWOT Analysis
        2. Key Strategies
      2. Cognizant Technology Solutions (US)
        1. Company Overview
        2. Financial Overview
        3. Software/Solutions
    102. Offered
    103. Key Developments
    104. SWOT Analysis
    105. Exlservice Holdings Inc. (US)
      1. Company Overview
        1. Financial Overview
        2. Software/Solutions Offered
        3. Key Developments
        4. SWOT Analysis
        5. Key Strategies
      2. Genpact Limited
    106. (US)
    107. Company Overview
    108. Financial Overview
    109. Software/Solutions Offered
      1. Key Developments
        1. SWOT Analysis
        2. Key Strategies
      2. International Business Machines Corporation
    110. (US)
    111. Company Overview
    112. Financial Overview
    113. Software/Solutions Offered
      1. Key Developments
        1. SWOT Analysis
        2. Key Strategies
      2. Infosys Limited (India)
        1. Company Overview
        2. Financial Overview
        3. Software/Solutions Offered
        4. Key Developments
        5. SWOT Analysis
        6. Key Strategies
      3. Mu Sigma Inc. (India)
        1. Company Overview
        2. Financial Overview
        3. Software/Solutions
    114. Offered
    115. Key Developments
    116. SWOT Analysis
    117. Key Strategies
    118. NTT DATA Corporation (Japan)
      1. Company Overview
        1. Financial Overview
        2. Software/Solutions Offered
        3. Key Developments
        4. SWOT Analysis
        5. Key Strategies
      2. TATA Consultancy
    119. Services Limited (India)
      1. Company Overview
        1. Financial Overview
        2. Software/Solutions Offered
        3. Key Developments
        4. SWOT Analysis
        5. Key Strategies
      2. Tech Mahindra
    120. Limited (India)
    121. Company Overview
    122. Financial Overview
    123. Software/Solutions Offered
      1. Key Developments
        1. SWOT Analysis
        2. Key Strategies
      2. Wipro Limited (India)
        1. Company Overview
        2. Financial Overview
        3. Software/Solutions Offered
        4. Key Developments
        5. SWOT Analysis
        6. Key Strategies
      3. Dell Technologies
    124. Inc. (US)
    125. Company Overview
    126. Financial Overview
    127. Software/Solutions Offered
      1. Key Developments
        1. SWOT Analysis
        2. Key Strategies
      2. Fujitsu Ltd. (Japan)
        1. Company Overview
        2. Financial Overview
        3. Software/Solutions Offered
        4. Key Developments
        5. SWOT Analysis
        6. Key Strategies
      3. Hewlett Packard
    128. Enterprise Development LP (US)
      1. Company Overview
        1. Financial Overview
        2. Software/Solutions Offered
        3. Key Developments
        4. SWOT Analysis
        5. Key Strategies
    129. ANALYTICS MARKET, BY COMPONENT, 2018–2027 (USD MILLION)
    130. MARKET, BY DEPLOYMENT, 2018–2027 (USD MILLION)
    131. ORGANIZATION SIZE, 2018–2027 (USD MILLION
    132. APPLICATION, 2018–2027 (USD MILLION)
    133. VERTICAL, 2018–2027 (USD MILLION)
    134. –2027 (USD MILLION)
    135. (USD MILLION)
    136. NORTH AMERICABPO BUSINESS ANALYTICS MARKET, BY COMPONENT, 2018–2027 (USD
    137. MILLION)
    138. NORTH AMERICABPO BUSINESS ANALYTICS MARKET, BY DEPLOYMENT, 2018–2027 (USD
    139. MILLION)
    140. NORTH AMERICABPO BUSINESS ANALYTICS MARKET, BY ORGANIZATION SIZE, 2018–2027
    141. (USD MILLION)
    142. NORTH AMERICABPO BUSINESS ANALYTICS MARKET, BY APPLICATION, 2018–2027 (USD
    143. MILLION)
    144. NORTH AMERICABPO BUSINESS ANALYTICS MARKET, BY VERTICAL, 2018–2027 (USD
    145. MILLION)
    146. USBPO BUSINESS ANALYTICS MARKET, BY COMPONENT, 2018–2027 (USD MILLION
    147. ANALYTICS MARKET, BY DEPLOYMENT, 2018–2027 (USD MILLION
    148. MARKET, BY ORGANIZATION SIZE, 2018–2027 (USD MILLION)
    149. –2027 (USD MILLION)
    150. (USD MILLION)
    151. CANADA BPO BUSINESS ANALYTICS MARKET, BY COMPONENT, 2018–2027 (USD MILLION)
    152. ANALYTICS MARKET, BY DEPLOYMENT, 2018–2027 (USD MILLION)
    153. ANALYTICS MARKET, BY ORGANIZATION SIZE, 2018–2027 (USD MILLION)
    154. ANALYTICS MARKET, BY APPLICATION, 2018–2027 (USD MILLION)
    155. ANALYTICS MARKET, BY VERTICAL, 2018–2027 (USD MILLION)
    156. COMPONENT, 2018–2027 (USD MILLION)
    157. –2027 (USD MILLION)
    158. –2027 (USD MILLION
    159. (USD MILLION)
    160. MEXICO BPO BUSINESS ANALYTICS MARKET, BY VERTICAL, 2018–2027 (USD MILLION)
    161. ANALYTICS MARKET, BY COUNTRY, 2018–2027 (USD MILLION)
    162. COMPONENT, 2018–2027 (USD MILLION)
    163. –2027 (USD MILLION)
    164. –2027 (USD MILLION)
    165. (USD MILLION)
    166. EUROPE BPO BUSINESS ANALYTICS MARKET, BY VERTICAL, 2018–2027 (USD MILLION)
    167. ANALYTICS MARKET, BY COMPONENT, 2018–2027 (USD MILLION)
    168. MARKET, BY DEPLOYMENT, 2018–2027 (USD MILLION)
    169. SIZE, 2018–2027 (USD MILLION)
    170. –2027 (USD MILLION)
    171. (USD MILLION)
    172. GERMANY BPO BUSINESS ANALYTICS MARKET, BY COMPONENT, 2018–2027 (USD MILLION)
    173. BUSINESS ANALYTICS MARKET, BY DEPLOYMENT, 2018–2027 (USD MILLION)
    174. BUSINESS ANALYTICS MARKET, BY ORGANIZATION SIZE, 2018–2027 (USD MILLION)
    175. BUSINESS ANALYTICS MARKET, BY APPLICATION, 2018–2027 (USD MILLION)
    176. BUSINESS ANALYTICS MARKET, BY VERTICAL, 2018–2027 (USD MILLION)
    177. ANALYTICS MARKET, BY COMPONENT, 2018–2027 (USD MILLION)
    178. ANALYTICS MARKET, BY DEPLOYMENT, 2018–2027 (USD MILLION)
    179. ANALYTICS MARKET, BY ORGANIZATION SIZE, 2018–2027 (USD MILLION)
    180. ANALYTICS MARKET, BY APPLICATION, 2018–2027 (USD MILLION)
    181. ANALYTICS MARKET, BY VERTICAL, 2018–2027 (USD MILLION)
    182. BY COMPONENT, 2018–2027 (USD MILLION)
    183. BY DEPLOYMENT, 2018–2027 (USD MILLION)
    184. BY ORGANIZATION SIZE, 2018–2027 (USD MILLION)
    185. BY APPLICATION, 2018–2027 (USD MILLION)
    186. BY VERTICAL, 2018–2027 (USD MILLION)
    187. BY COUNTRY, 2018–2027 (USD MILLION)
    188. BY COMPONENT, 2018–2027 (USD MILLION)
    189. BY DEPLOYMENT, 2018–2027 (USD MILLION)
    190. BY ORGANIZATION SIZE, 2018–2027 (USD MILLION)
    191. BY APPLICATION, 2018–2027 (USD MILLION)
    192. BY VERTICAL, 2018–2027 (USD MILLION)
    193. COMPONENT, 2018–2027 (USD MILLION)
    194. –2027 (USD MILLION)
    195. –2027 (USD MILLION)
    196. (USD MILLION)
    197. CHINA BPO BUSINESS ANALYTICS MARKET, BY VERTICAL, 2018–2027 (USD MILLION)
    198. ANALYTICS MARKET, BY COMPONENT, 2018–2027 (USD MILLION)
    199. MARKET, BY DEPLOYMENT, 2018–2027 (USD MILLION)
    200. ORGANIZATION SIZE, 2018–2027 (USD MILLION)
    201. APPLICATION, 2018–2027 (USD MILLION)
    202. VERTICAL, 2018–2027 (USD MILLION)
    203. –2027 (USD MILLION)
    204. (USD MILLION)
    205. INDIA BPO BUSINESS ANALYTICS MARKET, BY ORGANIZATION SIZE, 2018–2027 (USD
    206. MILLION)
    207. INDIA BPO BUSINESS ANALYTICS MARKET, BY APPLICATION, 2018–2027 (USD MILLION)
    208. ANALYTICS MARKET, BY VERTICAL, 2018–2027 (USD MILLION)
    209. MARKET, BY COMPONENT, 2018–2027 (USD MILLION)
    210. MARKET, BY DEPLOYMENT, 2018–2027 (USD MILLION)
    211. MARKET, BY ORGANIZATION SIZE, 2018–2027 (USD MILLION)
    212. MARKET, BY APPLICATION, 2018–2027 (USD MILLION)
    213. MARKET, BY VERTICAL, 2018–2027 (USD MILLION)
    214. MARKET, BY COMPONENT, 2018–2027 (USD MILLION)
    215. MARKET, BY DEPLOYMENT, 2018–2027 (USD MILLION)
    216. MARKET, BY ORGANIZATION SIZE, 2018–2027 (USD MILLION)
    217. MARKET, BY APPLICATION, 2018–2027 (USD MILLION)
    218. MARKET, BY VERTICAL, 2018–2027 (USD MILLION)
    219. BY COMPONENT, 2018–2027 (USD MILLION)
    220. BY DEPLOYMENT, 2018–2027 (USD MILLION)
    221. BY ORGANIZATION SIZE, 2018–2027 (USD MILLION)
    222. BY APPLICATION, 2018–2027 (USD MILLION)
    223. BY VERTICAL, 2018–2027 (USD MILLION)
    224. ANALYTICS MARKET, BY COMPONENT, 2018–2027 (USD MILLION)
    225. ANALYTICS MARKET, BY DEPLOYMENT, 2018–2027 (USD MILLION)
    226. MARKET, BY ORGANIZATION SIZE, 2018–2027 (USD MILLION
    227. APPLICATION, 2018–2027 (USD MILLION)
    228. VERTICAL, 2018–2027 (USD MILLION)
    229. –2027 (USD MILLION)
    230. (USD MILLION)
    231. NORTH AMERICABPO BUSINESS ANALYTICS MARKET, BY COMPONENT, 2018–2027 (USD MILLION)
    232. BUSINESS ANALYTICS MARKET, BY DEPLOYMENT, 2018–2027 (USD MILLION)
    233. BUSINESS ANALYTICS MARKET, BY ORGANIZATION SIZE, 2018–2027 (USD MILLION)
    234. BUSINESS ANALYTICS MARKET, BY APPLICATION, 2018–2027 (USD MILLION)
    235. BUSINESS ANALYTICS MARKET, BY VERTICAL, 2018–2027 (USD MILLION)
    236. ANALYTICS MARKET, BY COMPONENT, 2018–2027 (USD MILLION
    237. –2027 (USD MILLION
    238. (USD MILLION)
    239. USBPO BUSINESS ANALYTICS MARKET, BY APPLICATION, 2018–2027 (USD MILLION)
    240. ANALYTICS MARKET, BY VERTICAL, 2018–2027 (USD MILLION)
    241. COMPONENT, 2018–2027 (USD MILLION)
    242. –2027 (USD MILLION)
    243. –2027 (USD MILLION)
    244. (USD MILLION)
    245. CANADA BPO BUSINESS ANALYTICS MARKET, BY VERTICAL, 2018–2027 (USD MILLION)
    246. ANALYTICS MARKET, BY COMPONENT, 2018–2027 (USD MILLION)
    247. ANALYTICS MARKET, BY DEPLOYMENT, 2018–2027 (USD MILLION)
    248. ANALYTICS MARKET, BY ORGANIZATION SIZE, 2018–2027 (USD MILLION
    249. ANALYTICS MARKET, BY APPLICATION, 2018–2027 (USD MILLION)
    250. ANALYTICS MARKET, BY VERTICAL, 2018–2027 (USD MILLION)
    251. COUNTRY, 2018–2027 (USD MILLION)
    252. –2027 (USD MILLION)
    253. (USD MILLION)
    254. EUROPE BPO BUSINESS ANALYTICS MARKET, BY ORGANIZATION SIZE, 2018–2027 (USD
    255. MILLION)
    256. EUROPE BPO BUSINESS ANALYTICS MARKET, BY APPLICATION, 2018–2027 (USD MILLION)
    257. ANALYTICS MARKET, BY VERTICAL, 2018–2027 (USD MILLION)
    258. –2027 (USD MILLION)
    259. (USD MILLION)
    260. UK BPO BUSINESS ANALYTICS MARKET, BY ORGANIZATION SIZE, 2018–2027 (USD MILLION)
    261. ANALYTICS MARKET, BY APPLICATION, 2018–2027 (USD MILLION)
    262. MARKET, BY VERTICAL, 2018–2027 (USD MILLION)
    263. BY COMPONENT, 2018–2027 (USD MILLION)
    264. BY DEPLOYMENT, 2018–2027 (USD MILLION)
    265. ORGANIZATION SIZE, 2018–2027 (USD MILLION)
    266. APPLICATION, 2018–2027 (USD MILLION)
    267. VERTICAL, 2018–2027 (USD MILLION)
    268. –2027 (USD MILLION)
    269. (USD MILLION)
    270. FRANCE BPO BUSINESS ANALYTICS MARKET, BY ORGANIZATION SIZE, 2018–2027 (USD
    271. MILLION)
    272. FRANCE BPO BUSINESS ANALYTICS MARKET, BY APPLICATION, 2018–2027 (USD MILLION)
    273. ANALYTICS MARKET, BY VERTICAL, 2018–2027 (USD MILLION)
    274. BY COMPONENT, 2018–2027 (USD MILLION)
    275. BY DEPLOYMENT, 2018–2027 (USD MILLION)
    276. BY ORGANIZATION SIZE, 2018–2027 (USD MILLION)
    277. BY APPLICATION, 2018–2027 (USD MILLION)
    278. BY VERTICAL, 2018–2027 (USD MILLION)
    279. BY COUNTRY, 2018–2027 (USD MILLION)
    280. BY COMPONENT, 2018–2027 (USD MILLION)
    281. BY DEPLOYMENT, 2018–2027 (USD MILLION)
    282. BY ORGANIZATION SIZE, 2018–2027 (USD MILLION)
    283. BY APPLICATION, 2018–2027 (USD MILLION)
    284. BY VERTICAL, 2018–2027 (USD MILLION)
    285. COMPONENT, 2018–2027 (USD MILLION)
    286. –2027 (USD MILLION)
    287. –2027 (USD MILLION)
    288. (USD MILLION)
    289. CHINA BPO BUSINESS ANALYTICS MARKET, BY VERTICAL, 2018–2027 (USD MILLION)
    290. ANALYTICS MARKET, BY COMPONENT, 2018–2027 (USD MILLION)
    291. ANALYTICS MARKET, BY DEPLOYMENT, 2018–2027 (USD MILLION)
    292. MARKET, BY ORGANIZATION SIZE, 2018–2027 (USD MILLION)
    293. APPLICATION, 2018–2027 (USD MILLION)
    294. VERTICAL, 2018–2027 (USD MILLION)
    295. –2027 (USD MILLION)
    296. (USD MILLION)
    297. INDIA BPO BUSINESS ANALYTICS MARKET, BY ORGANIZATION SIZE, 2018–2027 (USD
    298. MILLION)
    299. INDIA BPO BUSINESS ANALYTICS MARKET, BY APPLICATION, 2018–2027 (USD MILLION)
    300. ANALYTICS MARKET, BY VERTICAL, 2018–2027 (USD MILLION)
    301. MARKET, BY COMPONENT, 2018–2027 (USD MILLION)
    302. MARKET, BY DEPLOYMENT, 2018–2027 (USD MILLION)
    303. MARKET, BY ORGANIZATION SIZE, 2018–2027 (USD MILLION)
    304. MARKET, BY APPLICATION, 2018–2027 (USD MILLION)
    305. MARKET, BY VERTICAL, 2018–2027 (USD MILLION)
    306. MARKET, BY COMPONENT, 2018–2027 (USD MILLION)
    307. MARKET, BY DEPLOYMENT, 2018–2027 (USD MILLION)
    308. MARKET, BY ORGANIZATION SIZE, 2018–2027 (USD MILLION)
    309. MARKET, BY APPLICATION, 2018–2027 (USD MILLION)
    310. MARKET, BY VERTICAL, 2018–2027 (USD MILLION)
    311. BY COMPONENT, 2018–2027 (USD MILLION)
    312. BY DEPLOYMENT, 2018–2027 (USD MILLION)
    313. BY ORGANIZATION SIZE, 2018–2027 (USD MILLION)
    314. BY APPLICATION, 2018–2027 (USD MILLION)
    315. BY VERTICAL, 2018–2027 (USD MILLION)'

    BPO Business Analytics Market Segmentation

    Market Segmentation Overview

    • Detailed segmentation data will be available in the full report
    • Comprehensive analysis by multiple parameters
    • Regional and country-level breakdowns
    • Market size forecasts by segment
    BPO Business Analytics Market Research Report - Global Forecast till 2030 Infographic

    Free Sample Request

    Kindly complete the form below to receive a free sample of this Report

    Customer Strories

    “I am very pleased with how market segments have been defined in a relevant way for my purposes (such as "Portable Freezers & refrigerators" and "last-mile"). In general the report is well structured. Thanks very much for your efforts.”

    Victoria Milne

    Founder
    Case Study

    Chemicals and Materials