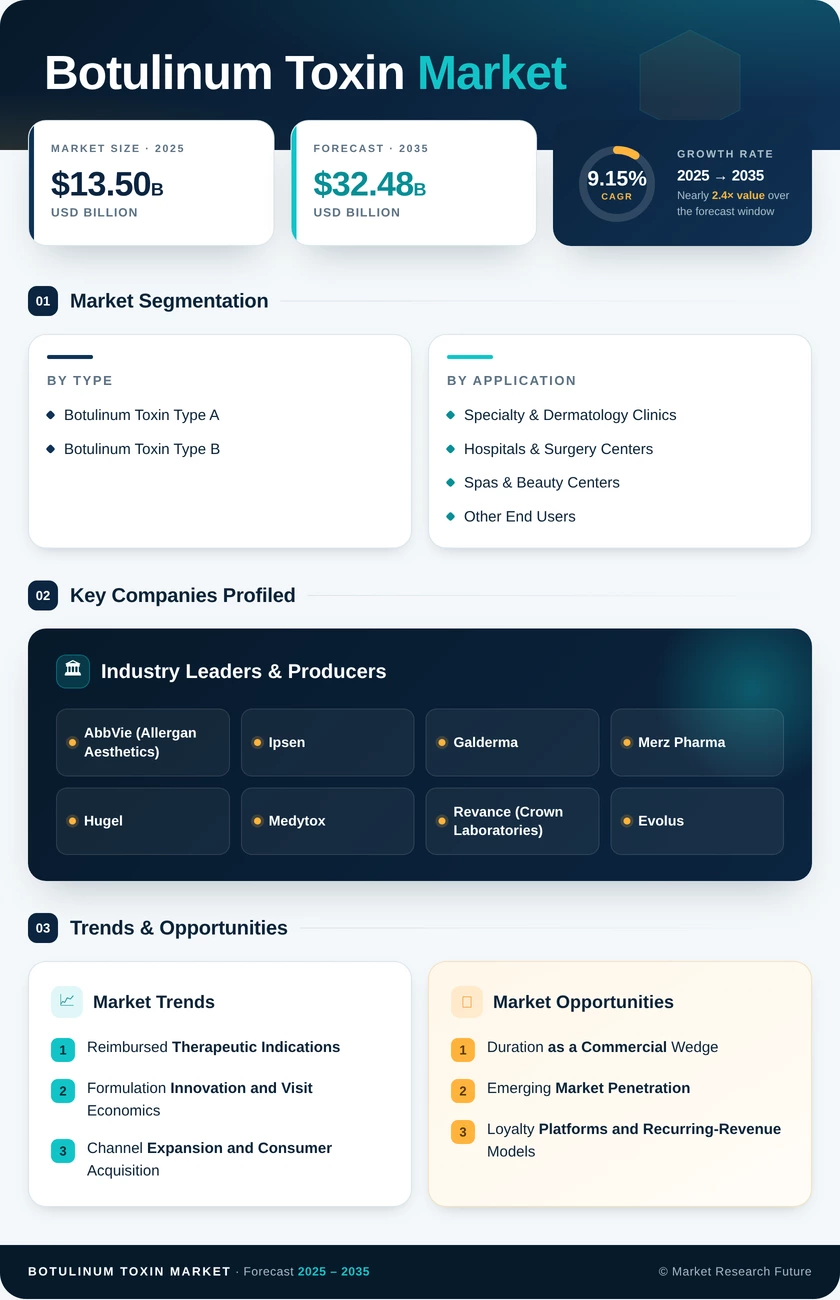
Botulinum Toxin Market (2026 - 2035)

Botulinum Toxin Market Size, Growth Research Report By Product (Botulinum Toxin A and Botulinum Toxin B), By Application (Medical and Aesthetic), By Gender (Female and Male), By Age Group (13-19, 20-29, 30-39, 40-54, and 55 & Above), By End User (Hospitals, Dermatology Clinics, and Spas & Cosmetic Centers) and By Region (North America, Europe, Asia-Pacific, and Rest of the World) – Competitor Industry Analysis and Trends Forecast Till 2035

Forecast Period
2026-2035
CAGR
9.15%
2025 Market Size
USD 13.50 Billion
2035 Market Size
USD 32.48 Billion
Healthcare ● Updated August 2026 Report ID: MRFR/HC/7095-CR | Pages: 151 | Author: Vikita Thakur, Kinjoll Dey
  1. 1 Market Overview |
    1. 1.1 Study Assumptions & Market Definition |
    2. 1.2 Scope of the Study |
    3. 1.3 Research Methodology
  2. 2 Market Summary & Key Takeaways
  3. 3 Market Size & Forecast (2021–2035) |
    1. 3.1 Historical Market Size (2021–2025) |
    2. 3.2 Current & Forecast Market Size (2026–2035) |
    3. 3.3 Market Size by Revenue (USD Billion) |
    4. 3.4 Year-over-Year Growth Analysis
  4. 4 Market Dynamics — Drivers |
    1. 4.1 Reimbursed Therapeutic Indication Expansion |
    2. 4.2 Rising Non-Invasive Aesthetic Procedure Volumes |
    3. 4.3 Ready-to-Use Liquid & Peptide-Stabilised Formulations |
    4. 4.4 Specialty Clinic & Med-Spa Channel Expansion |
    5. 4.5 Low-Cost Asian Supply into Emerging Geographies |
    6. 4.6 Indication Expansion Beyond the Face |
    7. 4.7 Male Patient Adoption & Digital Acquisition
  5. 5 Market Dynamics — Restraints |
    1. 5.1 Price Erosion from Low-Cost and Biosimilar Entrants |
    2. 5.2 Payer Prior Authorisation & Coverage Restrictions |
    3. 5.3 Counterfeit and Unlicensed Product Incidents |
    4. 5.4 Neutralising Antibody Formation |
    5. 5.5 Manufacturing Inspection & BLA Review Delays
  6. 6 Market Opportunity Analysis |
    1. 6.1 Duration as a Commercial Wedge |
    2. 6.2 Emerging Market Penetration |
    3. 6.3 Loyalty Platforms & Recurring-Revenue Models |
    4. 6.4 Therapeutic Whitespace |
    5. 6.5 Needle-Free & Topical Delivery |
    6. 6.6 Industry Value Chain Analysis |
    7. 6.7 Porter's Five Forces Analysis
  7. 7 Regional Analysis |
    1. 7.1 North America | |
      1. 7.1.1 US | |
      2. 7.1.2 Canada | |
      3. 7.1.3 Mexico |
    2. 7.2 Europe | |
      1. 7.2.1 Germany | |
      2. 7.2.2 UK | |
      3. 7.2.3 France | |
      4. 7.2.4 Italy | |
      5. 7.2.5 Spain | |
      6. 7.2.6 Nordic Countries | |
      7. 7.2.7 Russia | |
      8. 7.2.8 Rest of Europe |
    3. 7.3 Asia-Pacific | |
      1. 7.3.1 China | |
      2. 7.3.2 India | |
      3. 7.3.3 Japan | |
      4. 7.3.4 South Korea | |
      5. 7.3.5 ASEAN | |
      6. 7.3.6 Rest of Asia-Pacific |
    4. 7.4 South America | |
      1. 7.4.1 Brazil | |
      2. 7.4.2 Argentina | |
      3. 7.4.3 Rest of South America |
    5. 7.5 Middle East & Africa | |
      1. 7.5.1 Saudi Arabia | |
      2. 7.5.2 UAE | |
      3. 7.5.3 South Africa | |
      4. 7.5.4 Egypt | |
      5. 7.5.5 Rest of Middle East & Africa
  8. 8 Future Outlook (2026–2035) |
    1. 8.1 Duration Becomes the Battleground |
    2. 8.2 Data-Led Patient Acquisition |
    3. 8.3 Payer Policy & Therapeutic Ceiling |
    4. 8.4 Supply Chain Regionalisation & Biosimilars
  9. 9 Segmentation Analysis |
    1. 9.1 By Product Type | |
      1. 9.1.1 Botulinum Toxin Type A | |
      2. 9.1.2 Botulinum Toxin Type B |
    2. 9.2 By Application | |
      1. 9.2.1 Aesthetic | |
      2. 9.2.2 Therapeutic | | |
        1. 9.2.2.1 Chronic Migraine Prophylaxis | | |
        2. 9.2.2.2 Cervical Dystonia | | |
        3. 9.2.2.3 Spasticity | | |
        4. 9.2.2.4 Overactive & Neurogenic Bladder | | |
        5. 9.2.2.5 Hyperhidrosis |
    3. 9.3 By End User | |
      1. 9.3.1 Specialty & Dermatology Clinics | |
      2. 9.3.2 Hospitals & Surgery Centers | |
      3. 9.3.3 Spas & Beauty Centers | |
      4. 9.3.4 Other End Users |
    4. 9.4 By Geography
  10. 10 Competitive Landscape |
    1. 10.1 Market Share Analysis (2026) |
    2. 10.2 Competitive Benchmarking Matrix |
    3. 10.3 Company Profiles | |
      1. 10.3.1 AbbVie (Allergan Aesthetics) | |
      2. 10.3.2 Ipsen | |
      3. 10.3.3 Galderma | |
      4. 10.3.4 Merz Pharma | |
      5. 10.3.5 Hugel | |
      6. 10.3.6 Medytox | |
      7. 10.3.7 Revance (Crown Laboratories) | |
      8. 10.3.8 Evolus | |
      9. 10.3.9 Daewoong Pharmaceutical | |
      10. 10.3.10 Lanzhou Institute of Biological Products | |
      11. 10.3.11 Supernus Pharmaceuticals
  11. 11 Recent Developments & News
  12. 12 Report Scope & Methodology |
    1. 12.1 Study Period & Base Year |
    2. 12.2 Data Sources & Citations |
    3. 12.3 Abbreviations
  13. 13 Detailed Sources & Citations
  14. 14 Frequently Asked Questions
  15. 15 LIST OF TABLES |
  16. TABLE 1 Global Botulinum Toxin Market Size & Forecast, by Revenue (USD Billion), 2021–2035 |
  17. TABLE 2 Global Botulinum Toxin Market – Year-over-Year Growth Analysis, 2021–2035 |
  18. TABLE 3 Driver Impact Analysis – Estimated Contribution to CAGR |
  19. TABLE 4 Restraint Impact Analysis – Estimated Drag on CAGR |
  20. TABLE 5 Global Botulinum Toxin Market Size, by Region, 2021–2035 (USD Billion) |
  21. TABLE 6 North America Botulinum Toxin Market Size, by Country, 2021–2035 (USD Billion) |
  22. TABLE 7 Europe Botulinum Toxin Market Size, by Country, 2021–2035 (USD Billion) |
  23. TABLE 8 Asia-Pacific Botulinum Toxin Market Size, by Country, 2021–2035 (USD Billion) |
  24. TABLE 9 South America Botulinum Toxin Market Size, by Country, 2021–2035 (USD Billion) |
  25. TABLE 10 Middle East & Africa Botulinum Toxin Market Size, by Country, 2021–2035 (USD Billion) |
  26. TABLE 11 Global Botulinum Toxin Market Size, by Product Type, 2021–2035 (USD Billion) |
  27. TABLE 12 Global Botulinum Toxin Market Size, by Application, 2021–2035 (USD Billion) |
  28. TABLE 13 Global Botulinum Toxin Market Size, by Therapeutic Indication, 2021–2035 (USD Billion) |
  29. TABLE 14 Global Botulinum Toxin Market Size, by End User, 2021–2035 (USD Billion) |
  30. TABLE 15 North America Botulinum Toxin Market Size, by Product Type, 2021–2035 (USD Billion) |
  31. TABLE 16 North America Botulinum Toxin Market Size, by Application, 2021–2035 (USD Billion) |
  32. TABLE 17 North America Botulinum Toxin Market Size, by End User, 2021–2035 (USD Billion) |
  33. TABLE 18 Europe Botulinum Toxin Market Size, by Product Type, 2021–2035 (USD Billion) |
  34. TABLE 19 Europe Botulinum Toxin Market Size, by Application, 2021–2035 (USD Billion) |
  35. TABLE 20 Europe Botulinum Toxin Market Size, by End User, 2021–2035 (USD Billion) |
  36. TABLE 21 Asia-Pacific Botulinum Toxin Market Size, by Product Type, 2021–2035 (USD Billion) |
  37. TABLE 22 Asia-Pacific Botulinum Toxin Market Size, by Application, 2021–2035 (USD Billion) |
  38. TABLE 23 Asia-Pacific Botulinum Toxin Market Size, by End User, 2021–2035 (USD Billion) |
  39. TABLE 24 South America Botulinum Toxin Market Size, by Application, 2021–2035 (USD Billion) |
  40. TABLE 25 Middle East & Africa Botulinum Toxin Market Size, by Application, 2021–2035 (USD Billion) |
  41. TABLE 26 US Botulinum Toxin Market Size, by Application, 2021–2035 (USD Billion) |
  42. TABLE 27 Germany Botulinum Toxin Market Size, by Application, 2021–2035 (USD Billion) |
  43. TABLE 28 China Botulinum Toxin Market Size, by Application, 2021–2035 (USD Billion) |
  44. TABLE 29 South Korea Botulinum Toxin Market Size, by Product Type, 2021–2035 (USD Billion) |
  45. TABLE 30 Brazil Botulinum Toxin Market Size, by End User, 2021–2035 (USD Billion) |
  46. TABLE 31 Competitive Benchmarking Matrix – Global Botulinum Toxin Market, 2026 |
  47. TABLE 32 Company Profiles – Key Players, Global Botulinum Toxin Market |
  48. TABLE 33 Recent Developments & Strategic Announcements, 2023–2025 |
  49. TABLE 34 Report Scope & Methodology Summary |
  50. TABLE 35 Detailed Sources & Citations
  51. 16 LIST OF FIGURES |
  52. FIGURE 1 Market Dynamics – Drivers, Restraints and Opportunities Framework |
  53. FIGURE 2 Industry Value Chain Analysis – Strain Banking to Clinic Administration |
  54. FIGURE 3 Porter's Five Forces Analysis – Global Botulinum Toxin Market |
  55. FIGURE 4 Global Market Size Trend & Forecast, 2021–2035 (USD Billion) |
  56. FIGURE 5 Year-over-Year Growth Rate Trend, 2022–2035 (%) |
  57. FIGURE 6 Market Share by Product Type, 2025 vs 2035 (%) |
  58. FIGURE 7 Market Share by Application, 2025 vs 2035 (%) |
  59. FIGURE 8 Therapeutic Indication Revenue Split, 2025 (%) |
  60. FIGURE 9 Market Share by End User, 2025 vs 2035 (%) |
  61. FIGURE 10 Regional Revenue Share, 2025 (%) |
  62. FIGURE 11 Regional CAGR Comparison, 2026–2035 (%) |
  63. FIGURE 12 North America Country-Level Revenue Split, 2025 (%) |
  64. FIGURE 13 Europe Country-Level Revenue Split, 2025 (%) |
  65. FIGURE 14 Asia-Pacific Country-Level Revenue Split, 2025 (%) |
  66. FIGURE 15 Competitive Landscape – Estimated Revenue Share Positioning, 2026 |
  67. FIGURE 16 Competitive Positioning Matrix – Portfolio Breadth vs Duration Claim |
  68. FIGURE 17 Regulatory Approval Timeline – Aesthetic Neurotoxins, 2002–2025
Share::
Request Free Sample

Segmentation Quick Reference

DimensionSub-SegmentsDominant SegmentFastest Growing Segment
By Product TypeBotulinum Toxin Type A; Botulinum Toxin Type BBotulinum Toxin Type ABotulinum Toxin Type B
By ApplicationAesthetic; TherapeuticAestheticChronic Migraine Prophylaxis (within Therapeutic)
By End UserSpecialty & Dermatology Clinics; Hospitals & Surgery Centers; Spas & Beauty Centers; Other End UsersHospitals & Surgery CentersSpecialty & Dermatology Clinics
By GeographyNorth America; Europe; Asia-Pacific; South America; Middle East & AfricaNorth AmericaAsia-Pacific


Market Segmentation Overview

By Product Type

Sub-SegmentKey Trend
Botulinum Toxin Type ASix cleared aesthetic brands in the US alone; ready-to-use liquid and peptide-stabilised variants reshaping premium pricing
Botulinum Toxin Type BNiche but resilient demand from type-A non-responders; acidic liquid formulation supports stability without reconstitution


Serotype A remains the clinical default, and every recent approval has reinforced rather than diluted that position. Serotype B growth is driven less by preference than by necessity, expanding in step with the cumulative-exposure population.

By Application

Sub-SegmentKey Trend
AestheticLabel expansion beyond the face; younger preventive cohorts extending patient lifetime value
TherapeuticPayer-funded volume with higher dose intensity and lower discount sensitivity
Chronic Migraine ProphylaxisMature reimbursement frameworks across the US, UK and Germany
Cervical DystoniaLong-duration formulations reducing annual visit counts
SpasticityPost-stroke rehabilitation protocols driving hospital-channel volume
Overactive & Neurogenic BladderUrology referral pathways maturing across developed markets
HyperhidrosisMixed elective and partially reimbursed demand profile


Aesthetics still carries the larger revenue block, but therapeutic indications set the growth ceiling because reimbursement decouples volume from consumer discretionary spending. Coverage policy, not clinical evidence, is the binding constraint on the therapeutic side.

By End User

Sub-SegmentKey Trend
Specialty & Dermatology ClinicsSame-day cash-pay treatment models and loyalty-programme integration
Hospitals & Surgery CentersReimbursed therapeutic administration requiring clinical infrastructure
Spas & Beauty CentersHighest consumer accessibility; most exposed to licensing enforcement
Other End UsersOphthalmology, urology and rehabilitation practices


Channel economics diverge sharply. Hospitals hold revenue scale through reimbursed indications, while specialty clinics compound faster by converting consultation to treatment inside a single visit.

By Geography

Sub-SegmentKey Trend
North AmericaIndication expansion and loyalty-platform economics; deepest cash-pay base
EuropeFirst region granting simultaneous dual-indication approval for a liquid neuromodulator
Asia-PacificKorean manufacturing scale and widening Chinese regulatory access
South AmericaBrazil-led procedure volume with broadening price tiers
Middle East & AfricaGulf clinic investment alongside intensified counterfeit enforcement


Regional divergence is widening rather than converging. Western markets compete on indication breadth and duration claims, while Asia-Pacific and emerging regions compete on manufacturing cost and distribution reach.




Share::
Request Free Sample
Download PDF ×

We do not share your information with anyone. However, we may send you emails based on your report interest from time to time. You may contact us at any time to opt-out.