ID: MRFR/LS/0821-HCR | February 2021 | Region: Global | 95 pages
Biosimilars Market Scenario
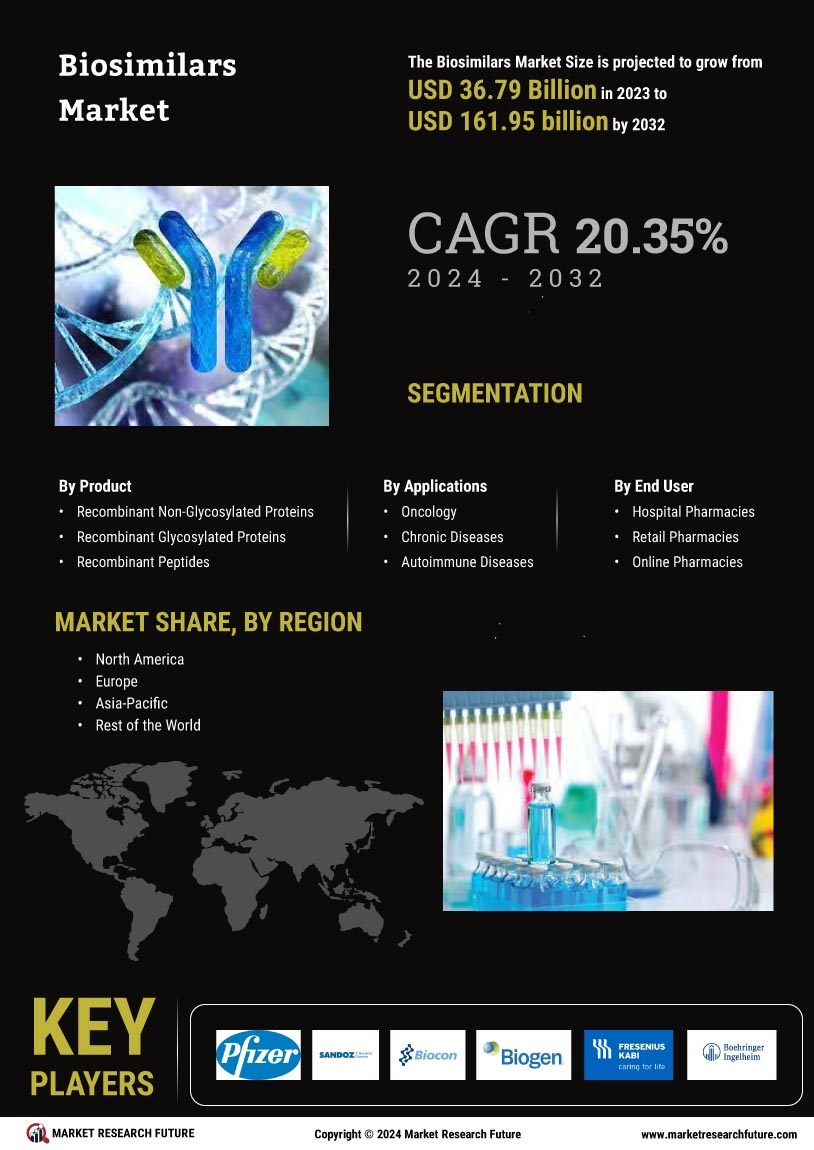
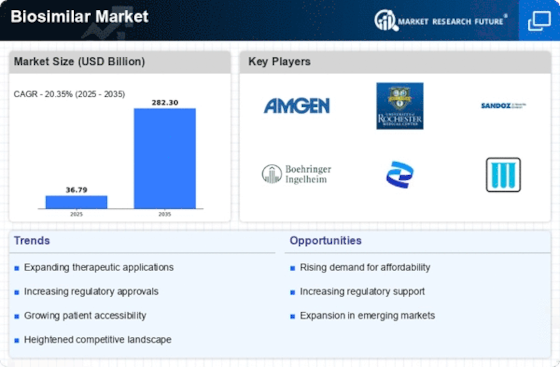
Biosimilars Market Size is expected to register a CAGR of 7.5% during the forecast period of 2019 to 2025, with a market value of USD 13,460 Million in 2018.
A biosimilar is a biologic medical product highly similar to another already approved biological medicine. Biosimilars are approved according to the same standards of pharmaceutical quality, safety, and efficacy that apply to all biological medicines. The global biosimilars market is driven by factors such as rising demand for biosimilars due to their cost-effectiveness and growing prevalence of chronic diseases. Additionally, rising pressure to reduce healthcare expenditure coupled with patent expiry of various blockbuster drugs and the increasing number of biosimilar drug approvals by the FDA is anticipated to fuel the market growth.
For instance, according to the biosimilars update report by Amgen in 2019, As of January 2019, the US Food and Drug Administration (FDA) approved 17 biosimilars, out of which 7 products launched in 4 therapeutic areas. On the other hand, patient safety and medical efficacy are projected to hamper the growth of the market during the assessment period. Moreover, major companies in the market are involved in strategic acquisitions, collaborations, and mergers to sustain their position in the market.
For instance, in October 2018, Sandoz, a Novartis division received the US Food and Drug Administration (FDA) approval for its biosimilar, HyrimozTM (adalimumab-adaz) for the treatment of rheumatoid arthritis (RA), psoriatic arthritis (PSA), juvenile idiopathic arthritis (JIA) in patients four years of age and older, ulcerative colitis (UC), ankylosing spondylitis (AS), adult Crohn's disease (CD), and plaque psoriasis (Ps)
Biosimilars Market Segmentation
Global Biosimilars Market has been segmented based on product, applications, end users, and region.
The market, based on product, has been bifurcated into recombinant non-glycosylated proteins, recombinant glycosylated proteins, and recombinant peptides.
The recombinant non-glycosylated proteins are further divided into human growth hormone (RHGH), granulocyte colony-stimulating factor (filgrastim), insulin, and interferons. Similarly, the recombinant glycosylated proteins segment is further bifurcated into erythropoietin (EPO), monoclonal antibodies (MABS), and follitropin. The recombinant peptides segment has been subdivided into glucagon and calcitonin
The recombinant non-glycosylated proteins segment is expected to hold a major share in the market due to an increase in the number of incidences of chronic diseases, diabetes also growth hormone deficiency-related disorders. Thus, the therapeutic use of recombinant non-glycosylated proteins is broadening as their increased availability and lowered price.
For example, according to the International Diabetes Federation (IDF), in 2017, approximately 425 million adults aged between 20 to 79 years suffered from diabetes, and this number is expected to rise to 629 million by 2045.
On the basis of applications, the global biosimilars market has been divided into oncology, chronic diseases, autoimmune diseases, blood disorders, growth hormone deficiency, infectious diseases, and others. Blood disorders segment is expected to grow with high growth rate due to increased prevalence of blood disorders and adoption of biosimilars as its low cost in comparison to biologics reduces the treatment cost.
For example, according to the Centers for Disease Control and Prevention in the US, hemophilia A affects 1 in 5,000 male births, and about 400 babies are born with hemophilia A each year.
Based on end user, the market has been divided into hospitals and clinics is expected to hold the largest share in the market as easy availability for treatment with expert faculties.
Based on region, the global biosimilars market has been divided into the Americas, Europe, Asia-Pacific, and the Middle East & Africa. The biosimilars market in the Americas has further been segmented into North America and Latin America; the North American market has been further divided into the US and Canada.
The European biosimilars market has been sub-divided into Western Europe and Eastern Europe. Western Europe has further been classified as France, the UK, Germany, Italy, Spain, and the rest of Western Europe. The biosimilars market in Asia-Pacific has been segmented into Japan, China, India, South Korea, Australia, and the rest of Asia-Pacific. The biosimilars market in the Middle East & Africa has been divided into the Middle East and Africa.
Biosimilars Market Key Players
The key players in the Global Biosimilars Market are Pfizer (US), Sandoz International (Germany), Teva Pharmaceuticals (Israel), Amgen, Inc. (US), Biocon (India), Dr. Reddy’s Laboratories (India), Celltrion (South Korea), Samsung Biologics (South Korea), Eli Lily & Company (US), Hospira Inc.(US), Actavis, Inc.(US), Cipla Ltd (India), Stada Arzneimittel AG (Germany), and Mylan, Inc.(US).
Regional Market Summary
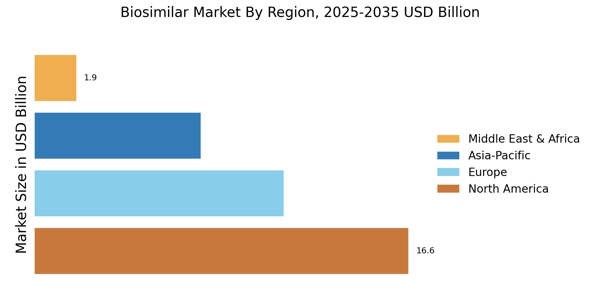
Global Biosimilars Market Share by Region, 2018 (%)
Source: World Health Organization (WHO)
The market in Europe is expected to dominate the global biosimilars market due to the increasing biosimilar product approvals and the emergence of new market participants in the region. The growing prevalence of chronic diseases in the US and Canada is expected to drive the market growth. Furthermore, there has been an increase in the expenditure in research by healthcare bodies; this is expected to fuel the growth of the market in this region. For example, according to Amgen, in 2019, Europe has an advanced biosimilar market, with 53 approved biosimilar products. The market in Asia-Pacific expected to show a considerable amount of growth. This can be attributed to the patent expiry of biologic products, introduction of new biosimilars, adoption of biosimilars to reduce the treatment cost, and the involvement of key companies. For instance, according to the National Center for Biotechnology Information, in 2019, Many key biologics are scheduled to lose their patent by the year 2020, which will provide the opportunity to other biopharmaceutical companies to develop similar biologics. Already there are more than 100 Indian biopharmaceutical companies are engaged in manufacturing and marketing of biosimilar. The market in Americas is projected to have a steady growth rate during the forecast period owing to an increase in chronic diseases and well-developed healthcare system. The market in the Middle East & Africa is projected to account for the least share of the global market due to low disposable income in the region.
Global Biosimilars Market, by Product
Global Biosimilars Market, By Applications
Global Biosimilars Market, By End-users
Global Biosimilars Market, by Region
Intended Audience
Frequently Asked Questions (FAQ) :
Global Biosimilars Market is expected to grow at 7.5% CAGR from 2019 to 2025.
Global Biosimilars Market stood at USD 13,460 million in 2018.
Rising prevalence of diseases and cost-effective production rate of biosimilars can drive the Global Biosimilars Market.
Europe is expected to contribute the maximum to the Global Biosimilars Market.
Pfizer, Eli Lily & Company, Teva Pharmaceuticals, Stada Arzneimittel AG, Dr. Reddy’s Laboratories, Cipla Ltd, Celltrion, Hospira Inc., Sandoz International, Amgen, Inc., Samsung Biologics, Biocon, Mylan, Inc., Actavis, Inc. are some of the biggest names of the Global Biosimilars Market.
Table of Contents
1. REPORT PROLOGUE
2. MARKET INTRODUCTION
2.1. Definition
2.2. Scope of the Study
2.2.1. Research Objective
2.2.2. Assumptions
2.2.3. Limitations
3. RESEARCH METHODOLOGY
3.1. Overview
3.2. Primary Research
3.3. Secondary Research
3.4. Market Size Estimation
4. MARKET DYNAMICS
4.1. Overview
4.2. Drivers
4.3. Restraints
4.4. Opportunities
5. MARKET FACTOR ANALYSIS
5.1. Porter’s Five Forces Analysis
5.1.1. Bargaining Power of Suppliers
5.1.2. Bargaining Power of Buyers
5.1.3. Threat of New Entrants
5.1.4. Threat of Substitutes
5.1.5. Intensity of Rivalry
5.2. Value Chain Analysis
6. GLOBAL BIOSIMILARS MARKET, BY PRODUCT
6.1. Overview
6.2. Recombinant Non-Glycosylated Proteins
Market Estimates & Forecast, by Region, 2019–2025
Market Estimates & Forecast, by Country, 2019–2025
6.2.1. Human Growth Hormone (RHGH)
Market Estimates & Forecast, by Region, 2019–2025
Market Estimates & Forecast, by Country, 2019–2025
6.2.2. Granulocyte Colony-Stimulating Factor (Filgrastim)
Market Estimates & Forecast, by Region, 2019–2025
Market Estimates & Forecast, by Country, 2019–2025
6.2.3. Insulin
Market Estimates & Forecast, by Region, 2019–2025
Market Estimates & Forecast, by Country, 2019–2025
6.2.4. Interferons
Market Estimates & Forecast, by Region, 2019–2025
Market Estimates & Forecast, by Country, 2019–2025
6.3. Recombinant Glycosylated Proteins
Market Estimates & Forecast, by Region, 2019–2025
Market Estimates & Forecast, by Country, 2019–2025
6.3.1. Erythropoietin (EPO)
Market Estimates & Forecast, by Region, 2019–2025
Market Estimates & Forecast, by Country, 2019–2025
6.3.2. Monoclonal Antibodies (MABS)
Market Estimates & Forecast, by Region, 2019–2025
Market Estimates & Forecast, by Country, 2019–2025
6.3.3. Follitropin
Market Estimates & Forecast, by Region, 2019–2025
Market Estimates & Forecast, by Country, 2019–2025
6.4. Recombinant Peptides
Market Estimates & Forecast, by Region, 2019–2025
Market Estimates & Forecast, by Country, 2019–2025
6.4.1. Glucagon
Market Estimates & Forecast, by Region, 2019–2025
Market Estimates & Forecast, by Country, 2019–2025
6.4.2. Calcitonin
Market Estimates & Forecast, by Region, 2019–2025
Market Estimates & Forecast, by Country, 2019–2025
7. GLOBAL BIOSIMILARS MARKET, BY APPLICATIONS
7.1. Overview
7.2. Oncology
Market Estimates & Forecast, by Region, 2019–2025
Market Estimates & Forecast, by Country, 2019–2025
7.3. Chronic Diseases
Market Estimates & Forecast, by Region, 2019–2025
Market Estimates & Forecast, by Country, 2019–2025
7.4. Autoimmune Diseases
Market Estimates & Forecast, by Region, 2019–2025
Market Estimates & Forecast, by Country, 2019–2025
7.5. Blood Disorders
Market Estimates & Forecast, by Region, 2019–2025
Market Estimates & Forecast, by Country, 2019–2025
7.6. Growth Hormone Deficiency
Market Estimates & Forecast, by Region, 2019–2025
Market Estimates & Forecast, by Country, 2019–2025
7.7. Infectious Diseases
Market Estimates & Forecast, by Region, 2019–2025
Market Estimates & Forecast, by Country, 2019–2025
7.8. Others
Market Estimates & Forecast, by Region, 2019–2025
Market Estimates & Forecast, by Country, 2019–2025
8. GLOBAL BIOSIMILARS MARKET, BY END USER
8.1. Overview
8.2. Hospitals and Clinics
Market Estimates & Forecast, by Region, 2019–2025
Market Estimates & Forecast, by Country, 2019–2025
8.3. Research Institutes
Market Estimates & Forecast, by Region, 2019–2025
Market Estimates & Forecast, by Country, 2019–2025
8.4. Others
Market Estimates & Forecast, by Region, 2019–2025
Market Estimates & Forecast, by Country, 2019–2025
9. GLOBAL BIOSIMILARS MARKET, BY REGION
9.1. Overview
9.2. Americas
9.2.1. North America
9.2.1.1. US
9.2.1.2. Canada
9.2.2. Latin America
9.3. Europe
9.3.1. Western Europe
9.3.1.1. Germany
9.3.1.2. France
9.3.1.3. Italy
9.3.1.4. Spain
9.3.1.5. UK
9.3.1.6. Rest of Western Europe
9.3.2. Eastern Europe
9.4. Asia-Pacific
9.4.1. Japan
9.4.2. China
9.4.3. India
9.4.4. Australia
9.4.5. South Korea
9.4.6. Rest of Asia-Pacific
9.5. Middle East & Africa
9.5.1. Middle East
9.5.2. Africa
10. COMPANY LANDSCAPE
10.1. Overview
10.2. Competitive Analysis
10.3. Market Share Analysis
10.4. Major Growth Strategy in the Global Biosimilars Market
10.5. Competitive Benchmarking
10.6. Leading Players in Terms of Number of Developments in the Global Biosimilars Market
10.7. Key developments and Growth Strategies
10.7.1. Product Launch/Service Deployment
10.7.2. Mergers and Acquisitions
10.7.3. Joint Ventures
10.8. Major Players Financial Matrix & Market Ratio
10.8.1. Sales & Operating Income 2018
10.8.2. Major Players R&D Expenditure 2018
10.9. Major Players Capital Market Ratio
11. COMPANY PROFILES
11.1. Pfizer
11.1.1. Company Overview
11.1.2. Product Overview
11.1.3. Financial Overview
11.1.4. Key Developments
11.1.5. SWOT Analysis
11.1.6. Key Strategies
11.2. Sandoz International
11.2.1. Company Overview
11.2.2. Product Overview
11.2.3. Financial Overview
11.2.4. Key Developments
11.2.5. SWOT Analysis
11.2.6. Key Strategies
11.3. Teva Pharmaceuticals
11.3.1. Company Overview
11.3.2. Product Overview
11.3.3. Financial Overview
11.3.4. Key Developments
11.3.5. SWOT Analysis
11.3.6. Key Strategies
11.4. Amgen, Inc.
11.4.1. Company Overview
11.4.2. Product Overview
11.4.3. Financial Overview
11.4.4. Key Developments
11.4.5. SWOT Analysis
11.4.6. Key Strategies
11.5. Biocon
11.5.1. Company Overview
11.5.2. Product Overview
11.5.3. Financial Overview
11.5.4. Key Developments
11.5.5. SWOT Analysis
11.5.6. Key Strategies
11.6. Dr. Reddy’s Laboratories
11.6.1. Company Overview
11.6.2. Product Overview
11.6.3. Financial Overview
11.6.4. Key Developments
11.6.5. SWOT Analysis
11.6.6. Key Strategies
11.7. Celltrion
11.7.1. Company Overview
11.7.2. Product Overview
11.7.3. Financial Overview
11.7.4. Key Developments
11.7.5. SWOT Analysis
11.7.6. Key Strategies
11.8. Samsung Biologics
11.8.1. Company Overview
11.8.2. Product Overview
11.8.3. Financial Overview
11.8.4. Key Developments
11.8.5. SWOT Analysis
11.8.6. Key Strategies
11.9. Eli Lily & Company
11.9.1. Company Overview
11.9.2. Product Overview
11.9.3. Financial Overview
11.9.4. Key Developments
11.9.5. SWOT Analysis
11.9.6. Key Strategies
11.10. Hospira Inc.
11.10.1. Company Overview
11.10.2. Product Overview
11.10.3. Financial Overview
11.10.4. Key Developments
11.10.5. SWOT Analysis
11.10.6. Key Strategies
11.11. Actavis, Inc.
11.12. Cipla Ltd
11.13. Stada Arzneimittel Ag
11.14. Mylan, Inc.
11.15. Others
12. APPENDIX
12.1. References
12.2. Related Reports
LIST OF TABLES
TABLE 1 GLOBAL BIOSIMILARS MARKET SYNOPSIS, 2019–2025
TABLE 2 GLOBAL BIOSIMILARS MARKET ESTIMATES & FORECAST, 2019–2025 (USD MILLION)
TABLE 3 GLOBAL BIOSIMILARS MARKET, BY PRODUCT, 2019–2025 (USD MILLION)
TABLE 4 GLOBAL BIOSIMILARS MARKET, BY APPLICATIONS, 2019–2025 (USD MILLION)
TABLE 5 GLOBAL BIOSIMILARS MARKET, BY END USERS, 2019–2025 (USD MILLION)
TABLE 6 GLOBAL BIOSIMILARS MARKET, BY REGION, 2019–2025 (USD MILLION)
TABLE 7 NORTH AMERICA: BIOSIMILARS MARKET, BY PRODUCT, 2019–2025 (USD MILLION)
TABLE 8 NORTH AMERICA: BIOSIMILARS MARKET, BY APPLICATIONS, 2019–2025 (USD MILLION)
TABLE 9 NORTH AMERICA: BIOSIMILARS MARKET, BY END USERS, 2019–2025 (USD MILLION)
TABLE 10 US: BIOSIMILARS MARKET, BY PRODUCT, 2019–2025 (USD MILLION)
TABLE 11 US: BIOSIMILARS MARKET, BY APPLICATIONS, 2019–2025 (USD MILLION)
TABLE 12 US: BIOSIMILARS MARKET, BY END USERS, 2019–2025 (USD MILLION)
TABLE 13 CANADA: BIOSIMILARS MARKET, BY PRODUCT, 2019–2025 (USD MILLION)
TABLE 14 CANADA: BIOSIMILARS MARKET, BY APPLICATIONS, 2019–2025 (USD MILLION)
TABLE 15 CANADA: BIOSIMILARS MARKET, BY END USERS, 2019–2025 (USD MILLION)
TABLE 16 LATIN AMERICA: BIOSIMILARS MARKET, BY PRODUCT, 2019–2025 (USD MILLION)
TABLE 17 LATIN AMERICA: BIOSIMILARS MARKET, BY APPLICATIONS, 2019–2025 (USD MILLION)
TABLE 18 LATIN AMERICA: BIOSIMILARS MARKET, BY END USERS, 2019–2025 (USD MILLION)
TABLE 19 EUROPE: BIOSIMILARS MARKET, BY PRODUCT, 2019–2025 (USD MILLION)
TABLE 20 EUROPE: BIOSIMILARS MARKET, BY APPLICATIONS, 2019–2025 (USD MILLION)
TABLE 21 EUROPE: BIOSIMILARS MARKET, BY END USERS, 2019–2025 (USD MILLION)
TABLE 22 WESTERN EUROPE: BIOSIMILARS MARKET, BY PRODUCT, 2019–2025 (USD MILLION)
TABLE 23 WESTERN EUROPE: BIOSIMILARS MARKET, BY APPLICATIONS, 2019–2025 (USD MILLION)
TABLE 24 WESTERN EUROPE: BIOSIMILARS MARKET, BY END USERS E, 2019–2025 (USD MILLION)
TABLE 25 EASTERN EUROPE: BIOSIMILARS MARKET, BY PRODUCT, 2019–2025 (USD MILLION)
TABLE 26 EASTERN EUROPE: BIOSIMILARS MARKET, BY APPLICATIONS, 2019–2025 (USD MILLION)
TABLE 27 EASTERN EUROPE: BIOSIMILARS MARKET, BY END USERS, 2019–2025 (USD MILLION)
TABLE 28 ASIA-PACIFIC: BIOSIMILARS MARKET, BY PRODUCT, 2019–2025 (USD MILLION)
TABLE 29 ASIA-PACIFIC: BIOSIMILARS MARKET, BY APPLICATIONS, 2019–2025 (USD MILLION)
TABLE 30 ASIA-PACIFIC: BIOSIMILARS MARKET, BY END USERS, 2019–2025 (USD MILLION)
TABLE 31 MIDDLE EAST & AFRICA: BIOSIMILARS MARKET, BY PRODUCT, 2019–2025 (USD MILLION)
TABLE 32 MIDDLE EAST & AFRICA: BIOSIMILARS MARKET, BY APPLICATIONS, 2019–2025 (USD MILLION)
TABLE 33 MIDDLE EAST & AFRICA: BIOSIMILARS MARKET, BY END USERS, 2019–2025 (USD MILLION)
LIST OF FIGURES
FIGURE 1 RESEARCH PROCESS
FIGURE 2 MARKET STRUCTURE OF THE GLOBAL BIOSIMILARS MARKET
FIGURE 3 MARKET DYNAMICS OF THE GLOBAL BIOSIMILARS MARKET
FIGURE 4 GLOBAL BIOSIMILARS MARKET SHARE, BY PRODUCT, 2018 (%)
FIGURE 5 GLOBAL BIOSIMILARS MARKET SHARE, BY APPLICATIONS, 2018 (%)
FIGURE 6 GLOBAL BIOSIMILARS MARKET SHARE, BY END USERS, 2018 (%)
FIGURE 7 GLOBAL BIOSIMILARS MARKET SHARE, BY REGION, 2018 (%)
FIGURE 8 AMERICAS: BIOSIMILARS MARKET SHAR,E BY REGION, 2018 (%)
FIGURE 9 NORTH AMERICA: BIOSIMILARS MARKET SHARE, BY COUNTRY, 2018 (%)
FIGURE 10 EUROPE: BIOSIMILARS MARKET SHARE, BY REGION, 2018 (%)
FIGURE 11 WESTERN EUROPE: BIOSIMILARS MARKET SHARE, BY COUNTRY, 2018 (%)
FIGURE 12 ASIA-PACIFIC: BIOSIMILARS MARKET SHARE, BY COUNTRY, 2018 (%)
FIGURE 13 MIDDLE EAST & AFRICA: BIOSIMILARS MARKET SHARE, BY COUNTRY, 2018 (%)
FIGURE 14 GLOBAL BIOSIMILARS MARKET: COMPANY SHARE ANALYSIS, 2018 (%)
FIGURE 15 PFIZER: KEY FINANCIALS
FIGURE 16 PFIZER: SEGMENTAL REVENUE
FIGURE 17 PFIZER: REGIONAL REVENUE
FIGURE 18 SANDOZ INTERNATIONAL: KEY FINANCIALS
FIGURE 19 SANDOZ INTERNATIONAL: SEGMENTAL REVENUE
FIGURE 20 SANDOZ INTERNATIONAL: REGIONAL REVENUE
FIGURE 21 AMGEN, INC.: KEY FINANCIALS
FIGURE 22 AMGEN, INC.: SEGMENTAL REVENUE
FIGURE 23 AMGEN, INC.: REGIONAL REVENUE
FIGURE 24 TEVA PHARMACEUTICALS: KEY FINANCIALS
FIGURE 25 TEVA PHARMACEUTICALS: SEGMENTAL REVENUE
FIGURE 26 TEVA PHARMACEUTICALS: REGIONAL REVENUE
FIGURE 27 BIOCON: KEY FINANCIALS
FIGURE 28 BIOCON: SEGMENTAL REVENUE
FIGURE 29 BIOCON: REGIONAL REVENUE
FIGURE 30 DR. REDDY’S LABORATORIES: KEY FINANCIALS
FIGURE 31 DR. REDDY’S LABORATORIES: SEGMENTAL REVENUE
FIGURE 32 DR. REDDY’S LABORATORIES: REGIONAL REVENUE
FIGURE 33 CELLTRION: KEY FINANCIALS
FIGURE 34 CELLTRION: SEGMENTAL REVENUE
FIGURE 35 CELLTRION: REGIONAL REVENUE
FIGURE 36 SAMSUNG BIOLOGICS: KEY FINANCIALS
FIGURE 37 SAMSUNG BIOLOGICS: SEGMENTAL REVENUE
FIGURE 38 SAMSUNG BIOLOGICS: REGIONAL REVENUE
FIGURE 39 ELI LILY & COMPANY: KEY FINANCIALS
FIGURE 40 ELI LILY & COMPANY: SEGMENTAL REVENUE
FIGURE 41 ELI LILY & COMPANY: REGIONAL REVENUE
FIGURE 42 HOSPIRA INC.: KEY FINANCIALS
FIGURE 43 HOSPIRA INC.: SEGMENTAL REVENUE
FIGURE 44 HOSPIRA INC.: REGIONAL REVENUE
FIGURE 45 ACTAVIS, INC.: KEY FINANCIALS
FIGURE 46 ACTAVIS, INC.: SEGMENTAL REVENUE
FIGURE 47 ACTAVIS, INC.: REGIONAL REVENUE
FIGURE 48 CIPLA LTD.: KEY FINANCIALS
FIGURE 49 CIPLA LTD.: SEGMENTAL REVENUE
FIGURE 50 CIPLA LTD.: REGIONAL REVENUE
FIGURE 51 STADA ARZNEIMITTEL AG: KEY FINANCIALS
FIGURE 52 STADA ARZNEIMITTEL AG: SEGMENTAL REVENUE
FIGURE 53 STADA ARZNEIMITTEL AG: REGIONAL REVENUE
FIGURE 54 MYLAN, INC.: KEY FINANCIALS
FIGURE 55 MYLAN, INC.: SEGMENTAL REVENUE
FIGURE 56 MYLAN, INC.: REGIONAL REVENUE